#SANDUSDT looks prime for 250% Rally!Welcome to this quick SAND/USDT 1day analysis in the chart.
I have tried my best to bring the best possible outcome in this chart.
Reason of trade:-#SAND/USDT looks triangle pattern create and 250% Rally confirm and long term hold!
Entry:-$2.6470
$3.1290
Target:-250%
Stoploss:-$2.2614
With leverage 3x to 5x
And long term hold and good profit 😉🙂😊✈️✈️
Q:-What do you think about this?
Do you think we will see a new ATH of SAND in the next quarter?
Share your views in the comment section.
Remember:-This is not a piece of financial advice. All investment made by me is under my own risk and I am held responsible for my own profit and losses. So, do your own research before investing in this trade.
Happy trading.
Sorry for my English it is not my native language.
Do hit the like button if you like it and share your charts in the comments section.
Thank you...
Sandusdt

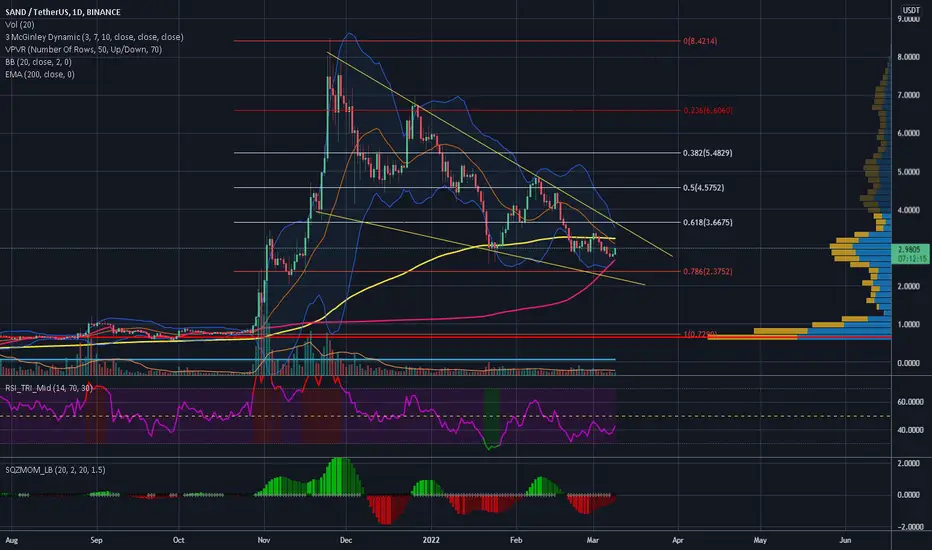
SAND into a descending wedgeI don't own SAND, I just checked it as it's an important metaverse token and I've noticed this descending wedge. I think this is a spot where those interested could start accumulating. I'd buy something now (20-30%) and then I'd wait to see how market reacts and if price pierces over EMA 200, if price creates a support on EMA 200 there you can buy more.
BB is showing a contraption which indicates a possible move in the next days, probably before starting buying you can even wait another day or two to see what happens as the contraption is happening at daily timeframe and doesn't look imminent.
Ah, indicators show a bullish DIV.
Good luck
Sand Bigger PictureI believe Sand has still to give due to the volume increase.
Let me know what you think!

Time to short Sand - again?In this post, a quick look at the SANDBTC pair, price action seems to show little to no effort to try and get past the Tenkan sen. In the past days it's found temporary support (dark blue line) while making lower highs, in a descending triangle fashion although I won't consider it as such because I prefer starting to count the lower highs within the triangle after the price has first found support, so just consider the orange dotted line as a simple resistance; nonetheless, the message conveyed by the price action stays the same, and I see no will to fight back from buyers. One thing that could argue for a reversal is that we've traded quite far away from the Kumo cloud for a while now, and the current price is a "fairly big but not huge" 12% away from the 25D MA: nothing really meaningful though until we get a clear sign of reversal from the PA, I believe. Ultimately, bias seems to be bearish for now. I probably won't be taking any trade myself for the moment, this post is for an information purpose mainly.

🔻 SAND SHORT🔻Hello everyone.
sand rejected from resistance and lost the support. Targets are in the chart.
🚨 Disclaimer: this is not a piece of financial advice always do your own research.🚨

SANDUSDTWaiting for a short position possibility, according to pitchfork which indicates bearish market trend. If the pitchfork breaks, there is a high chance of bullish trend.

SAND Short SetupSAND Short Setup
Sell Momentum
Please noted this setup is HIGH RISK because its already hit fibo 1,68 (Take profit of sell momentum area)
Entry:
Sell market high risk
Sell limit 4.2082 - 4.3809
Target:
TP1 4.0355
TP2 3.7561
TP3 3.3040
Stoploss:
You decide
Always do your own research!

SANDUSDPotential Move to the upside to Fill in this Daily FVG before we get a continuation to the downside to take out the Equal Lows and and retest $2.00

Sand will go Sand will goo soon
SAND/USDT
Entry :
2.85 : 2.95
Target :
1️⃣3.1869
2️⃣ 3.8700
3️⃣ 4.2
4️⃣ 4.8
Long
5️⃣ 5
6️⃣ 7
Stop losse
2.5
⚠️ Trading is not financial advice your responsibility only and trade with the amount that you lose will not affect your working life ⚠️

SANDUSDT UPDATED CHART 05.03.2022SANDUSDT UPDATED CHART...now in exact support ,will expect 4 -5 $ soon

SANDUSDT 1D TA : New Trend LinesAccording to the lines drawn in the correction probability analysis, we will have the range of $ 2.95 and $ 2.65, and in the next stage, we expect support in the important support area.
Its not Buy or Sell SIGNAL
DYOR
BY : Mohamad Teriz - @AtonicShark

SAND double bottom- Order block support
- Double bottom
- MACD curling up
- Bullish divergence
Looking for it to break and retest the trendline or the recent high before I enter. Preferably with some nice volume.

The Sandbox Analyze (Road Map)!!!🗺️What Is The Sandbox (SAND) ❗️❓
Launched in 2011 by Pixowl, The Sandbox is a blockchain-based virtual world allowing users to create, build, buy and sell digital assets in the form of a game. By combining the powers of decentralized autonomous organizations (DAO) and non-fungible tokens (NFTs), the Sandbox creates a decentralized platform for a thriving gaming community.
According to the official whitepaper, the Sandbox platform’s main mission is to introduce blockchain technology in mainstream gaming successfully. The platform focuses on facilitating a creative “play-to-earn” model, which allows users to be both creators and gamers simultaneously. The Sandbox employs the powers of blockchain technology by introducing the SAND utility token, which facilitates transactions on the platform.
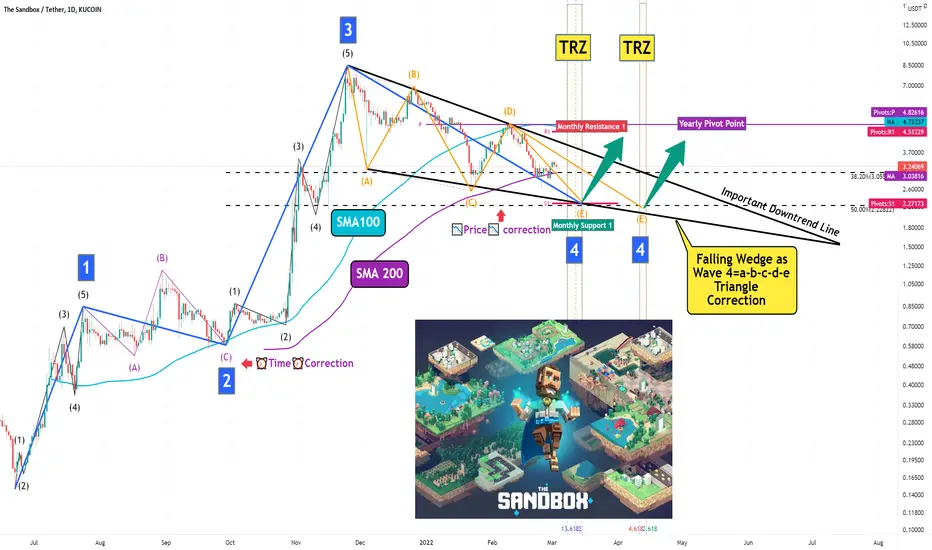
The Sandbox Analyze ( LUNAUSDT ) Timeframe Daily ⏰ ( Log Scale )
Location 🌊: The Sandbox has passed the main wave 3 at 8.48$ . And then it started the main wave 4 In the form of Falling Wedge Pattern . I tried to show the end of the main wave 4 on my chart. So if you want to add The Sandbox to your portfolio , you can wait for it to break the Important Downtrend Line .
Where is the end of Main wave 4 ❗️❓
🎯 Target 🎯: Around 2.22$ probably at my TRZ ( Time Reversal Zone )
Do not forget to put Stop loss for your positions (For every position you want to open).
Please follow your strategy , this is just my idea, and I will be glad to see your ideas in this post.
Please do not forget the ✅' like '✅ button 🙏😊 & Share it with your friends; thanks, and Trade safe.

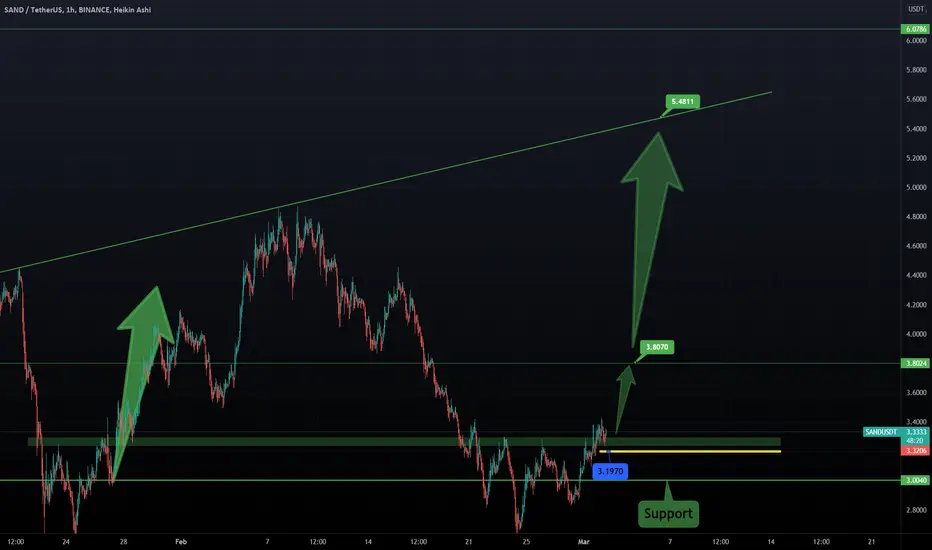
⌛🦜 SANDBOX Targets: 3,8$ and 5,4$ 🏴☠️☠Our updated chart on SANDBOX.
3,8$ and 5,40$ are our targets for the next months.
The project is great. here are some news about it:
Snoop Dogg Drops 10,000 Playable Sandbox Avatar NFTs – Mint a Unique Doggie and Explore the Metaverse in Style
Gucci is doubling down on its commitment to the metaverse.
The designer clothing brand announced on Wednesday that it’s bought an undisclosed amount of virtual land on the decentralized blockchain game The Sandbox.
Sounds and looks good to me, fundamentally and also on the chart. Time to go higher again? Why now!
One Love,
the FXPROFESSOR
SANDUSD: Long term movementHello Traders, here is the full analysis for this pair , I suggest you keep this pair on your watch-list and see if the rules of your strategy are satisfied.
If you enjoyed this free analysis and it was useful for you, like it and share it with your friends.
Please leave your comments below this post

SAND on a free fall but there is hope to hit the moon.The market fall has affected many assets.
SAND has retraced to FIB 78.6 level from its recent high that happened 9th Feburary 2022.
SAND is rested on the trend line and Fib78.6 are both. Hence the level is an important one to watch out for.
MY TAKE:
1. Break through the support level to $3.1 - $3.0 zone. Of if the sell off continues, I will add acquire some more of this asset at $2.6 zone.
2. The bull run will come back and ride this asset back to the lower TL, break through and push to $3.5 zone and beyond. With this, the assets I bought today will be in good profit.
Remember, fundamentals can turn the ball around.
🙏🙏🙏 Thanks for coming around, YOUR LIKES, FOLLOW, COMMENTS AND CRITIQUES will be appreciated

SAND, squeeze and breakout as a good buying opportunity. A key level of $3.28 can be highlighted on the SAND chart. At the moment, this level acts as resistance. The price has already tested this level several times, with each test the resistance is weakening. This means that a breakout might occur soon.
A squeeze and breakout could be a good buying opportunity.
Write in the comments all your questions and the instruments you want to see analyzed.
Friends, press the "like" button, write comments and share with your friends - it will be the best THANK YOU.
P.S. Personally, I open an entry if the price shows it according to my strategy.
Always do your analysis before making a trade.

(dashusdt) T.F(4h) TA (2/24/22) Which scenario?📈📉 As you can see, the short trend occurred according to the previous forecast
Now two more scenarios
1. Bull: Price return to 100
2-Bear: Continue the trend to Fibo 78 in price (63)
⚠️ This Analysis will be updated ...
📊 #dashusdt(DASH)
💹 Time Frame : 4H
👤 hosein alizadeh
📅 2/24/22
❤️ If you apperciate my work , Please like and comment , It Keeps me motivated to do better ❤️

SANDUSDT 1D TA : Support ZoneIn the daily timeframe, the important support of the downtrend line is lost in the short term and is moving towards the support range. In this case, more loss can be expected by losing the support range. If you return to the uptrend line, there is a possibility of a return.
The analysis will be updated according to what happens on the support range.
Its not Buy or Sell SIGNAL
DYOR
BY : Mohamad Teriz - @AtonicShark

Bullish Sign from sand - if btc wil stabilize sand is showing bullish sign in chart
holding period 1 month = 7.5 TP
if sands break 2.45 so it will invalidated

SAND/USDT @TheSandboxGamePlease find detailed insight into SAND/USDT.
During uncertain market conditions there aren’t many opportunities which can be taken advantage of, but one which I’ve been waiting for is SAND due to Alpha 2 being announced (Alpha 2 is effectively the 2nd test bed for their platform which allows people to participate in game play)
In the lead up to and during Alpha 1, Sand went from $2.96 to $8.50 over a period of 3 weeks.
There is no guarantees that this will happen this time round but then there is no reason to suggest it won’t happen and realistically should actually perform even better due to having a larger community behind the project than they had 4 months ago during Alpha 1.
It has been confirmed that Alpha 2 will be going live on March 3rd.
SAND is a project which I feel can still perform very well over the next 12/18 months even if we were to endure the overall market conditions which I have suggested.
Not only are the fundamentals strong with the launch of Alpha 2 announced for 03/03/2022, we also have confirmation of a double bottom at $2.67 which we might be lucky enough to test once more if Bitcoin moves down towards $32,800.
Daily RSI is verging on close to oversold and volume has massively dropped off since Alpha 1 in November last year.
Anticipating a move back up towards $7.00, possibly a retest of previous ATH at $8.50.

SANDUSDT Strong buying opportunityHey traders, today we are monitoring SANDUSDT for a buying opportunity around 3.00 zone, once we will receive any bullish confirmation the trade will be executed.
Trade safe, Joe.
