SAND slow stabilizationSAND is currently in a stable situation, slight price fluctuations are not a big problem, the situation looks transitional and soon we will see big things (metaverse)
Sandusdt

Time to Buy SANDBuy: $5.1 - $5.25
Nice inverse head and shoulders forming.
Stop loss 15 min candle close below trendline support

Cardano : KEY SUPPORT ZONE : $ADAThe price is currently fluctuating in the very important range of $ 1.2 .
If this key support is not lost , with the break of the downtrend , we can expect growth to the levels has shown on the chart .
Follow our other analysis & Feel free to ask any questions you have, we are here to help.
⚠️ This Analysis will be updated ...
👤 Arman Shaban : @ArmanShabanTrading
📅 20.DEC.2021
⚠️(DYOR)
❤️ If you apperciate my work , Please like and comment , It Keeps me motivated to do better ❤️

SAND is not sand, SAND is diamond Seem BINANCE:SANDUSDT is in the correction wave.
It has done wave A at $4.2
Next, wave B is happening after that wave C will turn down to $3.15, perhaps.
Because wave C = 1.618 Fib wave A.
Finally, the final impulse wave is going up to $15 up to $20. WHY???
I figured out Fibo Clusters in range $15-20. Need to patient!!!
Time will tell

sand box crypto futuresandbox crypto
congratulations all TRADING+99 members ❗️🥳
Sand/USDT
#FREE SIGNAL
WE ARE BEST🦾👊
profit with LEV 15
UNTIL NOW🔥🔥🥂
NO RISK
Big profit🎗

SAND sideways trend with slight fluctuationsSAND is stabilizing the situation on the chart and apart from slight fluctuations, no major changes are visible

Never forget XPRKUCOIN:XPRUSDT
Keep eyes on it 👀🕵️👁️
Don't forget Financial management and step
by step purchasing 💹💰💵💲
Please fallow me 🙏🥺
Please leave comments 🗨️💬
Like and share with your friends 👍💑
I hope you enjoy ☺️🌈🎉🎊🎁


SANDUSDT elliot wave analysisHello Guys
Here is a perfect analysis of SAND wave count that i published for you
Please leave your messages and ideas

SAND nice price rebound SAND shows that the current price level is not right, the current direction is up and whether we continue this depends only on BTC

SAND will go for new ATH#SAND/USDT
$SAND broke out triangle and broke out another descending resistance line and confirmed it as support. now price struggle to break resistance zone between $5.3 and $5.6. successful break out from $5.9 will lead price to make a new all time high.

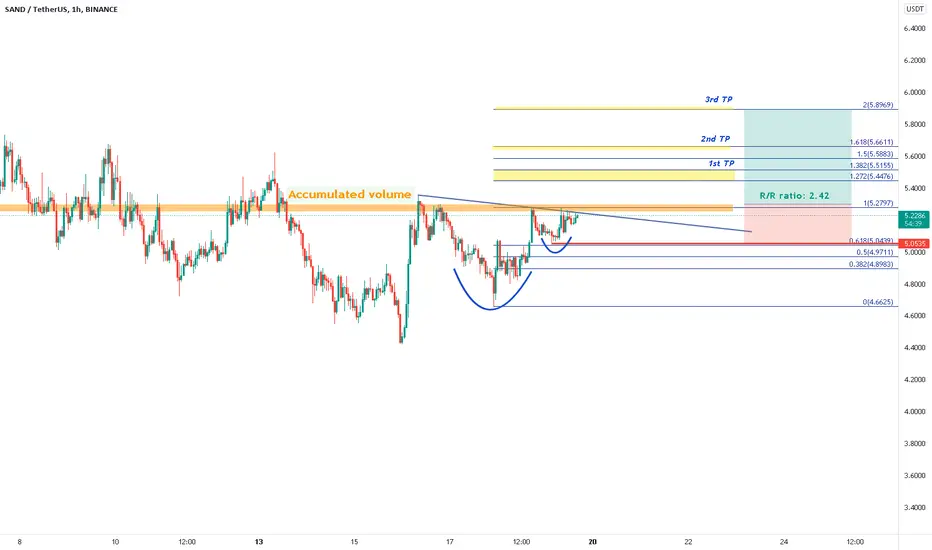
SAND - Possible Cup and Handle, and TP/SL BYBIT:SANDUSDT
1H trend chart
-
SAND is forming a potential cup and handle pattern on 1H
We can see accumulated volume are gathered around the orange zone.
If price can take it out (Fib 1), we can have a great risk-reward ratio with trading strategy as below.
-
Profit Targets:
a) 5.4476~5.5155----Fib(1.272~1.382)
b) 5.6616----Fib(1.618)
c) 5.8969----Fib(2)
Stop losses:
a) 5.0535-----Red horizontal ray
-
If you like this analysis, smash the "like button" and leave a comment below to share your thoughts
or let me know what crypto you want to see!
Trading is a reflection of yourself. Learn more daily and be ready for every opportunity.
Have a nice trading!
Get Sand Ready Goooo!Potential upward trend identified for SAND, based on few indicators:
1. Manage to hold onto the support level of $4.60
2. Selling pressure is diminishing
Great time to enter SAND at the moment, and if the correction is done at this level, we are ready to thrust $9 price level.
Entry: $4.8 to $5.1
SL: $4.3
Target: $9 (mid to long term)
Please show your support by giving a like and follow. If you have different opinion, appreciate for your constructive view.
I may do charting upon request

$SAND HOLDING ON TO THE UPTREND- Although SAND continues its movement within the falling channel, it seems to hold on to the uptrend drawn in black. I think that with the upward break of the channel (which is my expectation), the price will see 8 again, and then 10. In an opposite scenario, the price may go to the 3.50 - 3.70 range under the channel.
- SAND düşen kanal içerisinde hareketine devam etse de siyah ile çizilmiş yükseliş trendine tutunmuş gözüküyor. Kanalın yukarı kırılması ile ( ki benim beklentim o yönde ) fiyat tekrar 8 dolar, sonrasında ise 10 dolar seviyelerini görecektir diye düşünüyorum. Aksi bir senaryoda ise fiyat kanal altında 3.50 - 3.70 aralığına gidebilir.

SAND USDT My second technical analysisSorry, I am just 12 yo. how about this analysis ? Can you see my mistake ?


Sand/usdt long tradeA breakout out has taken place from the downtrend. Can ride up till 10$ and take profits in between


SAND Talked about it the end of November 🤯🍕🍣Good morning to all traders,
we had discussed sand towards the end of November when I was expecting a good retracement to enter below $5.
I think that moment has arrived since we are in a descending channel with various support zones, the first of which is around 4.60 usd but it is not certain that it will hold. As always I will behave accordingly waiting for a confirmation or the reaching of my areas of interest (Support and the POC).

SANDBOX- Updated ChartSANDBOX updated chart after the storm.
Chart shows support but mind the resistances ahead.
Interesting article:
Metaverse Investors Compare Decentraland and the Sandbox to Manhattan in the 1800s :
“We think the Fashion District purchase is like buying on Fifth Avenue back in the 1800s … or the creation of Rodeo Drive…”
good stuff,
the FXPROFESSOR

Sand is going to retest the support zoneSand is going to retest the support zone.
At the support zone it may see some more selling pressure.
Thanks and happy trading.

Falling Wedge Breakout for SAND/USDTSAND/USDT just broke above the very clear falling wedge in the 4H , which started its formation around the 29th of November.
Currently waiting for a retest on the trend line to enter a LONG position.
My SL will be set a little bit below the base of the triangle and my TPs as seen on the chart.

SAND/USDT is starting bullish trend againSAND/USDT is starting bullish trend again to ATH. Fundamentally, metaverse games are still early and in strong momentum.
