Best entries for SAND and why I think it's a bull trap right nowI will be waiting for 25 and 20 cents to buy SAND if it couldn.t cross the the 200 EMA. If it did I will be entering after some retracement from the leg that broke the EMA maybe (61 or deeper retracement). Let me know what you think.
Sandusdtlong

The Sandbox SANDUSDT price has a chance to form "Inverted H & S"It is very likely that the SAND token price of the once quite popular The Sandbox project is now close to the low of this protracted downtrend.
Looking at the global chart of SANDUSDT, it is safe to say that the price range of $0.38 - $0.45 is a tasty zone for placing buy orders with a grid. Of course, if you believe in this project and see future prospects in it and in the gaming crypto world in general.
The first target for the possible growth of the SANDUSD price is $1-1.20 (x3-x4 growth)
In the longer term, if and when the crypto market comes to life, we can think about the SAND price in the range of $2.50-3.50.
It is in this liquidity zone that the target of the probable "Inverted Head and Shoulders" pattern falls.
More precisely, the final growth target can be calculated when the formation of this pattern is finally confirmed.
Then we will update the idea of SANDUSDT with more specific targets for the final growth.
_____________________
Did you like our analysis? Leave a comment, like, and follow to get more

The Sandbox (SAND) forming bullish Shark| A good buy opportunityHi friends, hope you are well and welcome to the new trade setup of The Sandbox (SAND) with US Dollar pair.
Previously I shared a long-term trade setup for SAND, which is still in play.
Now on a 4-hr time frame, SAND is completing the final leg of a bullish Shark pattern.
Note: Above idea is for educational purpose only. It is advised to diversify and strictly follow the stop loss, and don't get stuck with trade

Crypto SAND SANDUSDTView on Crypto SAND SANDUSDT (5 Sept 2022)
SAND is in the range bound play recently and we are some value in the long term perspective.
For the near term, I'd say it shall retest the recent resistant of 1.35~1.40 region.
DYODD, all the best and read the disclaimer too.
Feel Free to "Follow", press "LIKE" "Comment".
Thank You!
Legal Risk Disclosure:
Trading foreign exchange or CFD on margin carries a high level of risk, and may not be suitable for all investors.
The high degree of leverage can work against you as well as for you. Before deciding to trade foreign exchange you should carefully consider your investment objectives, level of experience and risk appetite.
The possibility exists that you could sustain a loss of some or all of your initial investment and therefore you should not invest money that you cannot afford to lose.
You should be aware of all the risks associated with foreign exchange trading, and seek advice from an independent financial advisor.
DISCLAIMER:
Any opinions, news, research, analyses, prices or other information discussed in this presentation or linked to from this presentation are provided as general market commentary and do not constitute investment advice.
Sonicr Mastery Team does not accept liability for any loss or damage, including without limitation to, any loss of profit, which may arise directly or indirectly from use of or reliance on such information.

SANDUSDT analysis buy signal 12/3/2022we will stick to our yellow BC buying area after formation of III yellow sequence RR :3:1 talking in consideration that the market can take the bearish green target as point of starting bullish sequence

SANDUSDT analysis buy setup 12/11/2022if market go with the scenario shown with the green area it will give strength to bulls to raise the market ICI sequence will be formed

SANDUSDT Analysis (potential Inverse H&S)Hello friends.
Please support my work by clicking the LIKE button👍(If you liked). Also i will appreciate for ur activity. Thank you!
Everything on the chart.
Entry: market and lower
Target: 1.2 and ~1.4
after first target reached move ur stop to breakeven
Stop: ~0.715 (depending of ur risk). ALWAYS follow ur RM .
Risk/Reward: 1 to 3
risk is justified
Good luck everyone!
Follow me on TRADINGView, if you don't want to miss my next analysis or signals.
It's not financial advice.
Dont Forget, always make your own research before to trade my ideas!
Open to any questions and suggestions.

SAND/USDT - LONG----- Welcome, dear followers! -----
- Here is my trading methodology. I trade with a normal system and analysis of resistance and support, as well as price reversal patterns.
- For the record, I do not place a stop loss within my trades. So that I only risk 1.5% of my total capital in order to support the loss due to a price reversal against me.
- If a price reversed against my expectation and touched the drawn line r3, then I transferred targets to the entry point and waited for the price to close at it with a loss equal to almost zero.
- Today's deal is shown in the chart, and here are the entry and exit points below.
-- Support me with numbers and follow up on my account for other deals in the future. Thank you for coming to this part. --
-------------------------------------------------------
⚡️⚡️ SAND/USDT ⚡️⚡️
Exchange: ByBit USDT
Trade Type: Breakout (Long)
Leverage: Cross (3.0X)
Entry Orders:
1) 0.8519 - 100.0%
Take-Profit Orders:
1) 0.8792 - 60.0%
2) 0.9017 - 30.0%
3) 0.9353 - 10.0%
Trailing Configuration:
Stop: Breakeven -
Trigger: Target (1)


SANDUSDT - Descending Broadening wedge pattern!SANDUSDT (1D Chart) Technical analysis
SANDUSDT (1D Chart) Currently trading at $0.893
Buy level: Above $0.88
Stop loss: Below $0.65
TP1:$1
TP2: $1.4
TP3: $2
TP4: $2.5
Max Leverage 2x
Always keep Stop loss
Follow Our Tradingview Account for More Technical Analysis Updates, | Like, Share and Comment Your thoughts

SANDUSDT analysis buying signal crypto If market go as planed to our yellow WCL area this will be good buying setup or we can wait activation of the wcl by formation of smaller bullish smaller sequence

SANDUSDT analysis buying signal crypto Market is on the way to our wcl Orange area after formation of III (Impulsive sequence) with RR:2.8:1

SAND/USDT#SAND/USDT #LONG #Scalp
I'm waiting for when sand will hit the demand zone.
Entry: 0.8117
TP: 0.8360
tp 2 0.8432

🟢 SANDUSDT - 1H (26.09.2022)🟢 SANDUSDT
TF: 1H
Side: Long
SL: $0.849529
Leverage: 5x
TP 1: $0.873875
TP 2: $0.887973
TP 3: $0.899368

SAND- Lets All Play In The SandboxAnalysis:
- Support & Resistance
- Trend Line
- Supply & Demand
- Fibonacci Retracement
- Order Block Flow
T1: Target 1
T2: Target 2
B: Bottom / End of Correction / Beginning of Bull Run
S: Support
:) Breakout / Bull Run
Opinion:
The correction for Sandbox is over and price will rise the next few weeks/months

SANDUSDT - Descending Broadening Wedge Pattern!SANDUSDT (4h Chart) Technical analysis
SANDUSDT (4h Chart) Currently trading at $0.947
Buy level: Buy after Breakout
Stop loss: Below $0.844
Target 1: $0.985
Target 2: $1
Target 3: $1.2
Target 4: $1.4
Max Leverage 3x
Always keep Stop loss
Follow Our Tradingview Account for More Technical Analysis Updates, | Like, Share and Comment Your thoughts

SANDUSDT▶️SANDUSDT
❇️Buy 1.16
❇️Buy 1.08
📈Targets📈
🎯TP1 : 1.44
🎯TP2 : 1.70
🎯TP3 : 1.95
🎯TP4 : 2.45
🛑 STOP LOSSE 🛑
6H Candle closing under 0.96

SANDUSD Hello Traders,
After 88 days in accumulation phase forming a triangle SAND seems ready to breakout.
Confirmation on 4H chart.

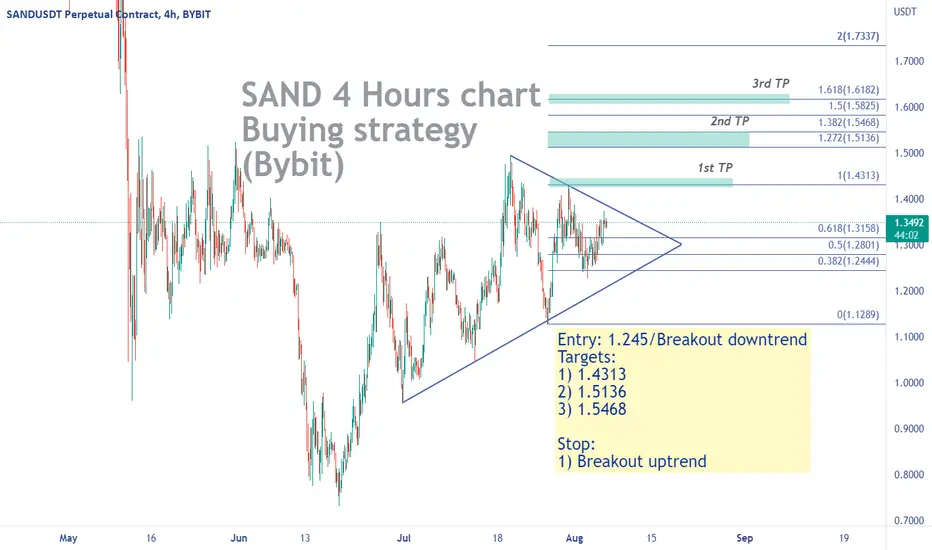
SAND - Buying signalBYBIT:SANDUSDT
4 Hours chart
-
SAND is consolidating with lower highs and higher lows in a triangle.
Currently it is approaching to the downtrend again, we can open partial position at 1.315, 1.245 or wait for breakout.
If it can take out the downtrend line and close above it, targets as below.
-
Targets:
1) 1.4313
2) 1.5136
3) 1.5468
Stop:
1) Breakout uptrend

SandusdtMarket reached our green buying area BC and reacted good with our area RR 2:1 and there is good potential in our buying one (sk analysis )

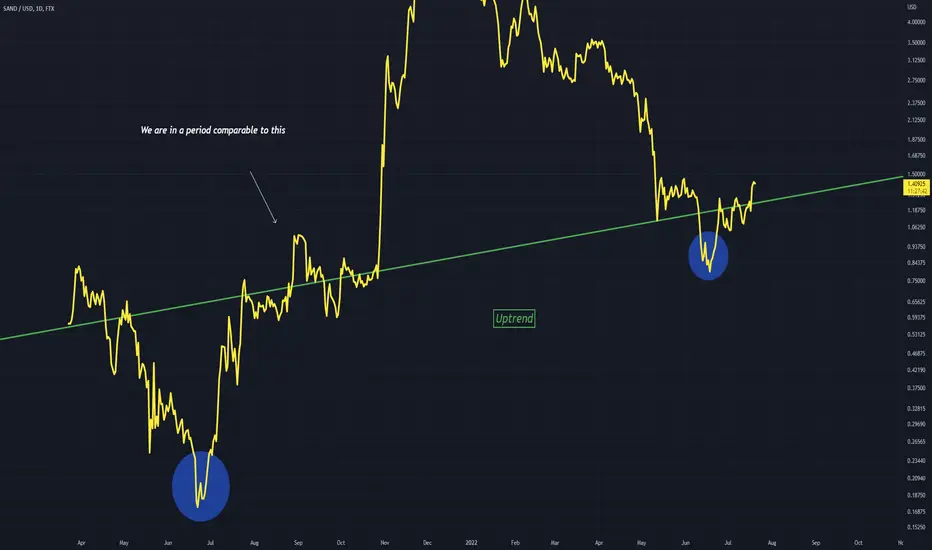
SANDUSD - Comparable Period Sand is maintained an uptrend, and has produced similar lows with a low volatility phase following this low
Arrow shows the comparable period of low volatility
The blue area could be viewed as a head of an inverted H&S
SAND Medium-term trade - our target $1,795Hello colleagues! We decided to publish the trade we entered tonight using a limit order.
This medium-term trade is carried out on the basis of the long-term forecast for SAND , which we published on July 5:
Details of the medium-term trade in SAND cryptocurrency:
Entry: $1.1026
Stop: $0.9157
TP : $1.795
