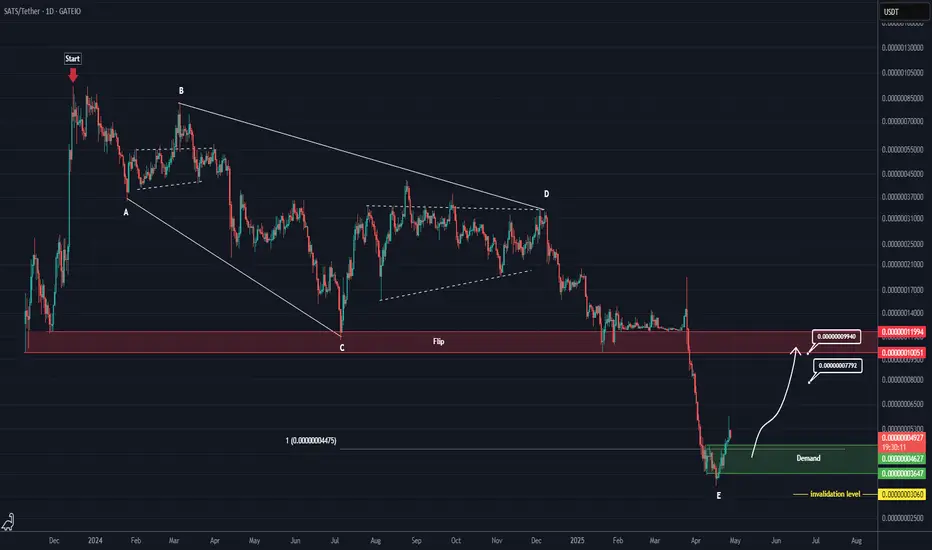
SATS has completed a corrective pattern (1D)Attention: This is a risky and highly volatile meme coin.
The correction of SATS started from the point where we placed the red arrow on the chart.
This correction appears to be an expanding triangle, as wave C is longer than wave A, and wave E is longer than wave C.
Currently, a support zone has formed below the price. As long as this area holds, the price can move toward the flip zone or near it.
Since the flip zone is fresh and untouched, the price may get rejected from this level.
The closure of a daily candle below the invalidation level would invalidate this analysis.
For risk management, please don't forget stop loss and capital management
When we reach the first target, save some profit and then change the stop to entry
Comment if you have any questions
Thank You
SATSUSD
SATS Buy/Long Setup (1H)Given the bullish structure, the formation of bullish BOS (Break of Structure), the preservation of the trendline, and the absence of any significant supply zone in front of the candles, we can consider entering this setup with proper risk and capital management.
The targets are marked on the chart. If the stop-loss is hit, it will indicate the invalidation of this trade and the position should be closed accordingly.
Do not enter the position without capital management and stop setting
Comment if you have any questions
thank you

SATSUSDT 4DSATS ~ 4D
#SATS This trade is high risk. But if you still have Conviction on this coin,. This is the last support block on this coin. Buy in stages with a minimum target of 20%+

SATSUSDT 4DSATS ~ 4D
#SATS This trade is very high risk. But if you still have Conviction on the coin,. This support block would be a very good buying place for now,,. with a short term target of at least 20%+

Trading opportunity for SATSUSDTBased on technical factors there is a Buy position in :
📊 SATSUSDT
🔵 Buy Now
🪫Stop loss 0.0002780
🔋Target 1 0.0004040
🔋Target 2 0.0005050
🔋Target 3 0.0006767
💸RISK : 1%
We hope it is profitable for you ❤️
Please support our activity with your likes👍 and comments📝

SATS Ordinals price is trying to rise, but for how long?After six months of a stable downward trend, the price of #SATS (#Ordinals) began to rise on increased trading volumes.
😱 Of course, six months to a year ago, holders were promised “golden mountains”, but in fact, after being "put in longs", there was almost a 10-fold depreciation of the asset.
🆗In the range of $0.00000045-0.00000060, there will be strong sales from those who want to get out of the drawdown at least to “zero”, this is how human psychology works.
And if you want to try your luck and trade OKX:SATSUSDT , then buying earlier than in the range of $0.00000017-0.00000022 can be harmful to your health and deposit) 🍿
_____________________
Did you like our analysis? Leave a comment, like, and follow to get more

SATS NEW INCREASE VOLUMESATS seems to have a new increase view with the possibility that we are going to see a new volume trend in the coming time frames.
For confirmations, we need to follow the coming time frames.
This coin has seen since MAR month 3 breakdown trend.. the new time frames can make a change for a new uptrend since a long time ago.

SATSUSDT Long Setup!1000SATSUSDt technical analysis update
SATS Price breaking its ascending channel
Buy zone : Below $0.00066
Stop loss : $0.00056
Take Profit 1: $0.00074
Take Profit 2: $0.00096
Take Profit 3: $0.00150
Regards
Hexa

SATS LongExpecting a pump on SATS. It has broken up resistance, it's now retesting it as support. It's approaching also short term support zone on M15 timeframe, i expect a bounce here targeting next resistance zone at 0.0006

SATS THE BREAK LINE SEEMS NOT FARThank you for reading this update.
SATS showing great volume movement.
The break line can be an important extra volume that can support the trend to new levels.
Sats show the daily volume interesting trend.
There is a good chance that SATS can target the yellow break line with a new break volume.

SATS Risky longI am trying a risky long on SATS. It has broken down major supports, and it looks oversold on higher timeframe. Level is also supported by a -0.618 fibo level from previous peak at top. There are some divergence on H1 and M15 tf, that is a bullish sign. If BTC can continue to pump, i expect SATS to follow

SATS SetupI am using a different approach here for SATS, i will wait for a break of the red box as confirmation of the strength of the momentum, next i will consider a long if box is correctly retested

SATS 1000SATS Coin Price Prediction🔥 Price on the 4H chart might come at these support area and we might get a potential bounce🔥
Potential bounce areas for Buying 0.0000006470 and 0.0000005882
👉 Follow me for More Real Time Opportunities.
Share your Thoughts if you have any?

SATS NEW VOLUME INCREASEThank you for reading this update.
Depending on our study we see that SATS has a good chance of volume increase.
This updates depending on day trade, And the market should confirm with time the right market way.
#Nottradingadvice
#For day traders take always profits when market increase
#Expect noting from the markets, but follow what it shows.

satsusdIf we consider a time correction for Satoshi, the possibility that will touch two green lines is very high.

the risk of war is on the lowest levelI was looking for an index to find out the risk of war on the markets and made this index:
(a*BTC+b*NASDAQ)/(c*GOLD+d*OIL)
I choose the coefficients to scale the parameters and make them in the same order.

the target of the Bitcoin is the blue line or the purple curve?will Bitcoin break the purple curve to reach the blue line?

the final target of Bitcoin is $240Kcrab harmonic pattern:
X=2.85e-5
A=1e-8
AB=0.38 XA
BC=0.88 AB
1.6 BC=1.44e-6
0.61 XA=1.83e-6
2 BC=3.6e-6
0.78 XA=6.1e-6
2.24 BC=6.4e-6
0.88 XA=1.26e-5
2.6 BC=1.57e-5
1.13 XA=7.26e-5
3.6 BC=1.71e-4
1.27 XA=2e-4
1.41 XA=5.42e-4
4.23 BC=7.5e-4
1.6 XA=2.41e-3

BTC Short Idea - Bearish DivergenceLooking at the daily chart, we see a clear bearish divergence.
We've recently broken the downward trendline, which many believe will be a major break out to new ATH. However, looking at the weekly and monthly charts, I still have a strong bearish outlook to the short-midterm timeframe. 12/24 we see a bearish pin bar when attempting to break above one of the rising trendlines.
I feel the bulls have a short term victory, but looking at the daily MACD, the latest fall from ATH has brought us below the bullish trendline and has left us below the 0 line marker. As this MACD rises to retest this level, I feel there will be a strong resistance and will bring the market crashing back towards the 30K level.
Feel free to comment your ideas, or ask any questions. I have further support for this theory that I did not touch on in this post.
Trade with care. Not financial advice.

Bitcoin Descending Channelfake breakout of Bitcoin descending channel.
To ensure proper position, we wait for the breakout to upward from the channel
maybe this is a flag pattern

bitcoin long position50% BUY when dynamic resistance break to upward
50% buy when pullback to static support zone in fibonaci or priceaction
KUCOIN:BTCUSDT

BTC Support & Resistance Areas in up trend channelBTC Support & Resistance Areas in up trend channel

