LCID: Could a Saudi Buyout Send This EV Stock Back to $10?If you haven`t sold LCID before the previous earnings:
Now you need to know that Lucid Motors (LCID) is one of the most polarizing EV stocks in the market — but it’s also one of the most interesting speculative turnarounds. Yes, the company faces production challenges, cash burn, and fierce competition from Tesla, BYD, and legacy automakers. But it has some unique wildcards that most other EV startups don’t:
1) The “Musk Factor”
Musk’s public comments about Lucid being “basically controlled by the Saudis” and that they make better-looking cars than Tesla might sound like trolling, but they highlight a real truth: Lucid isn’t just another budget EV player — it’s positioned as a luxury rival with design appeal that matters to high-end buyers.
2) Saudi PIF Is Deep In — Valuation Floor
The Saudi sovereign wealth fund has put billions into LCID already — and now owns around 60%+ of the shares. They’ve made no secret of their plans to expand the kingdom’s domestic EV production and see Lucid as a flagship partner.
Rumors have swirled for years about a possible full buyout to bring Lucid fully under the PIF umbrella — or merge it with other Middle East EV initiatives like the Ceer brand. Any credible news here could double or triple the stock overnight from these depressed levels.
3) Gravity SUV & Product Pipeline
The Lucid Air remains one of the few luxury EVs that truly competes with Tesla’s Model S in both design and range. The upcoming Gravity SUV could be the next big catalyst, especially as the luxury SUV segment has fatter margins and huge global demand.
Meanwhile, the new AMP-2 factory in Saudi Arabia will help Lucid localize production, get tax incentives, and serve the Middle East and Europe more cost-effectively.
4) Technical Setup: Double Bottom Pattern
Here’s what really makes this setup tradable: LCID is showing a clear double bottom on the daily chart around the $2–$2.20 zone. The stock tested that level twice and bounced, forming a W-shaped base that can signal a reversal.
Disclosure: I am part of Trade Nation's Influencer program and receive a monthly fee for using their TradingView charts in my analysis.
Saudiarabia

1150 IS PUSHING LOWERBack in January, I posted to buy 1150, but the market managed to take the opposite direction tp come lower and lower due to the conditions we currently have.
Now the price is pushing towards the level 24.24, we'll see how it will act around the level, but probably it will break through it and reach the next level at 21.92.
So for now don't buy anything on 1150.
Meanwhile, there's a golden opportunity for those who wants to learn how to trade Saudi Market, since it is in a level where you have all the possible configuration you'll face while running low.
Let me know if you got further questions!

A TRADE WE'RE HOLDING We've been holding this trade on 2040 for a month now in which we're doing great so far despite the Market slow movement.
The entry on this trade is based on liquidity and market gaps in case you wondered!
Meanwhile, there's a golden opportunity for those who wants to learn how to trade Saudi Market, since it is in a level where you have all the possible configuration you'll face while running low.
Let me know if you got further questions!

1120 IS GOING TOWARDS 82.6AL Rajhi is one of the stocks most of people buy,
I have read in a group yesterday that it's a golden oppoertunity to buy it now, but if we have a look at the chart, we'll see the opposite, the price just made a reversal as you can see, now it is heading towards 82.6 AT LEAST , don't rush and buy it, instead wait for the oprimal entry to take.
Meanwhile, there's a golden opportunity for those who wants to learn how to trade Saudi Market, since it is in a level where you have all the possible configuration you'll face while running low.
Let me know if you got further questions!

A TRADE I SHARED WITH MY CLIENTSI'm sharing with you this trade I gave to my clients which is still at the red side, we entered based on lots of criteria and we're waiting for the market now to do its job.
Note:
Tha market is slow and running low since we all know TASI is coming lower and lower, for now we could catch the 3 trades we have on Saudi Market, we'll hold them for the couple next months.
Meanwhile, there's a golden opportunity for those who wants to learn how to trade Saudi Market, since it is in a level where you have all the possible configuration you'll face while running low.
Let me know if you got further questions!

DON'T BUY 43004300 is going in a bearish movement after that it gave us a new high, for now it's not the right time to buy it, and if you just bought or holding shares any place nearby the high, you can close and wait for the next bullish rally.
Follow for more!

1322 GOING TOWARDS THE TARGETOne of the latest trades I shared with my clients is going towards the target, you still can buy but it won't be as safe as if you bought at the entry I gave them.
Follow for more!
For further questions, don't hesitate to ask!

1182 IS PREPARING AN ENTRYA month ago, I posted that 1182 is going lower to reach 11.36 for a liquidity crab, now after that it did, we can prepare ourselves to take the entry it is preparing so we can recover from the loss we've been through in the market crash.
Follow for more updates!

2222 WILL GO LOWERAramco is one of the stocks everyone's wanting to buy, but the problem is all it does is going lower and lower.
As you can notice on the cart, we have both an FVG (highlighted in purple) and a Gap (highlighted in orange), which both the price pulled back on and started going lower.
For now don't buy it, just hold your funds till I post about buying it.
The comment section is all yours for further questions!
Follow for more!

1120 IS PREPARING AN ENTRYDear Saudi Traders,
Been a while since I last posted, and here I am now with the pdates on the market.
We're all aware of the American-Saudi Business situation and how it affected the markets last week, yet we don't know for how long it will last and how lower the markets will get.
However, TASI shows that the price will continue in its normal movement before what happened last weekend.
Now we'll just wait for the market to fill the gap I highlighted in orange to get our entry based on it.
Mots of people lost their money in the market, some lost all of their wallets, my clients too lost a large mount of their portfolio, however we'll get through that and recover.
The comment section is all yours for any questions or help!
Follow for more!

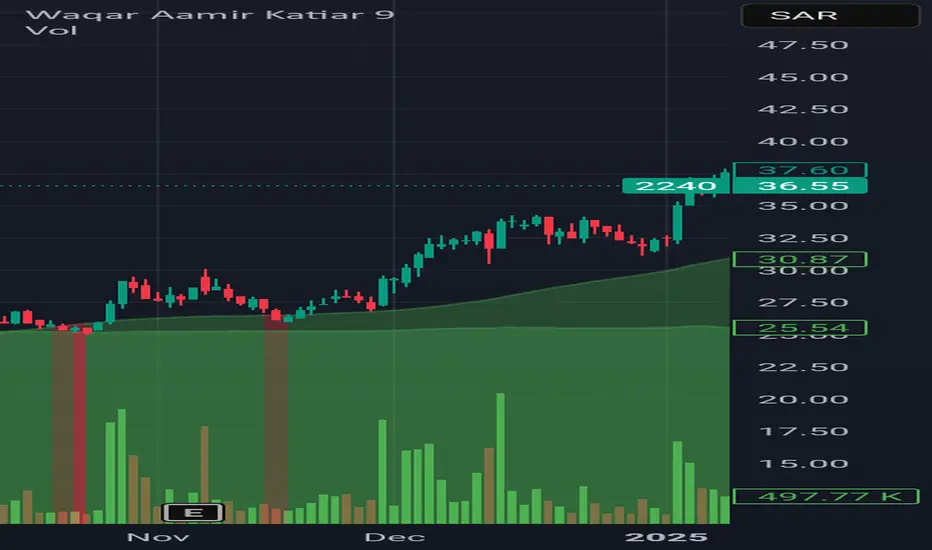
2240 (Zamil Industrial Investment) entered into bullish zone 2240 (Zamil Industrial Investment of Saudi Arabia Stock Exchange) is entered into bullish zone and may fly high.
Note, this is not a buy sell trade call. Trade at your own will.
TARGET FILLED ON 1010A trade I gave to my clients the beginning of this month reached the target last week.
These are the kind of the trades we're taking, slow but profitable!
Join the community by following us!

1201 IS ONE OF THE STOKS ON MY WATCHLISTEid Mubarak Said, Now since we're getting back to work sooner, I want to share with you some of the stocks I have on my watchlist.
For 1201, you can buy as soon as the price goes through 9.53 level to target 11.14, and your stop must be at 8.59.
Follow for more!

BUY TASIAnd yes, here is the opportunity y'all been waiting for, you can buy TASI now and set your levels as set on my chart!
This is one of the 7 trades I shared to my cients, you can follow so whenever I drop the others you can take them!

Trade Idea: ALSAIF STORES (TADAWUL: 4161)📈 Trade Idea: ALSAIF STORES (TADAWUL: 4161)
Timeframe: Daily (1D)
Current Price: 7.96 SAR
Setup Type: Breakout & Retest
🔍 Trade Narrative:
Price has broken above a recent consolidation zone (marked in light blue).
Strong bullish momentum is visible after reclaiming the key level of 7.80.
Market structure shows higher lows and a push towards previous liquidity zones.
🎯 Trade Plan:
Entry Zone: 7.80 – 7.90 (retest area)
Target 1 (T1): 8.35 (Previous High / Liquidity Grab)
Target 2 (T2): 8.44 (Final Target with Heart Marker 💗)
Stop Loss: Below 7.70 (below recent structure)
📊 Risk-to-Reward:
Approx. Risk: 0.20
Reward: 0.44 – 0.64
R:R Ratio: ~2.2 to 3.2
🔧 Confluence:
Daily structure shift confirmed
Liquidity resting above 8.35
Volume spike during breakout
Potential bullish continuation if price retests successfully

Trading Idea - Saudi Ceramic (2040) | Monthly Chart with Inverte🧠 Trading Idea - Saudi Ceramic (2040) | Monthly Chart with Inverted FVG
🔍 Chart Context:
Price has reacted from a Monthly Inverted Fair Value Gap (IFVG ), indicating a potential premium-level supply zone.
This rejection confirms sellers’ presence at the premium pricing zone, causing a sharp drop.
Price has returned to the discount zone, inside the Monthly FVG (Buy Side Imbalance Sell Side Inefficiency - BISI), offering a potential long opportunity.
📌 Key Technical Concepts:
✅ IFVG = Zone of Previous Supply / Institutional Sell Orders – price rejected sharply from there.
🟦 FVG = Current demand zone (discount area) with potential to support a reversal.
Liquidity above 54.3 SAR remains untouched, showing a magnet for future price movement.
📈 Trade Plan:
Accumulate in the FVG zone (28–30 SAR).
Watch for bullish confirmation (e.g., engulfing candles or internal BOS).
Ride the move towards Buy Side Liquidity @ 54.3 SAR.
🎯 Target Zones:
TP1: 36 SAR (range high retest)
TP2: 48 SAR (pre-IFVG reaction zone)
TP3: 54.3 SAR (BSL target – possible liquidity sweep)
📉 Stop Loss: Below 24 SAR (FVG invalidation zone)
💬 Narrative Summary:
Price was rejected from the Monthly IFVG (supply), now resting in a Monthly FVG (demand). This is a classic Discount → Premium cycle setup, with potential for a bullish reversal targeting Buy Side Liquidity above the recent highs.

2310 ALMOST AT THE PRICE GAPCouple days ago, I posted that 2310 will continue going lower to reach 20.02 before starting to go higher again.
And here is the stock coming lower to our Price Gap to fill it before starting to raise.
Meanwhile, I'm waiting for the stocks I shared to my clients to get a bit far from the entry so they can make profits from them, then I can post them to the public.
Follow for more!

2222 WILL GO LOWER2222 is also one of the stocks that are showing no indication that it will come higher anytime sooner.
We'd expect from the price to drop to 23.90 before reversing, if you're welling to buy I advice you not to.
While waiting for other opportunities, my clients and I are holding on 3 other stocks I will post as soon as the market starts going higher.
Follow for more!

1120 STILL PREPARING TO COME LOWERDays ago, I posted that 1120 will come lower, and still it didn't since it kept consolidating in the LQ we have at 102.2-100.2, we'd expect the price to come at 96.0 for a LQ Grab before continuing going higher.
Meanwhile my clients and I are holding on 3 stocks which I will share to the public as soon as the market goes a bit higher.
Follow for more!

TASI IS PREPARING AN ENTRYAfter that TASI has taken the liquidity at 11,553, it just gave us an indication that it will start going bullish, no clean entry for now, but we'll keep waiting.
Meanwhile, my clients and I have taken other trades on 3 other stocks that are still in a safe zone, waiting for them to go higher so I can share them to the public.
As soon as I catch the entry and share it to my clients, I will share it to the public.
If you really care about taking clean entries, you must wait for the confirmation of the up movement then you can have a safe entry.
Follow for more!

1182 IS STILL GOING LOWER As you can notice on the chart, 1182 is still going in a bearish trend to reach at least 11.36 before it starts creating an entry to take, for now don't buy it since it will continue dropping down.
In few days I will share with you the trades I gave to my clients!
Follow for more!

SAUDI AWWAL BANK | Weekly Timeframe (TADAWUL)Chart Analysis – SAUDI AWWAL BANK | Weekly Timeframe (TADAWUL)
Key Areas Highlighted:
Equal Highs (Buy-Side Liquidity): Marked at the top (around 46.50), indicating a liquidity pool where institutions might target to grab stop-losses above these highs.
Target Price: 42.65 is marked as a significant level where price is expected to move next (short-term target).
FVG (Fair Value Gap - Monthly): A green zone around the 33-36 range indicates an area of imbalance that price might fill before continuing upward.
Market Structure Shift (MSS): Marked on the chart showing a structural change, signaling a bullish reversal.
ITL (Internal Liquidity) & STL (Sell-Side Liquidity): Noted near the lows, highlighting liquidity zones. A note mentions:
“Price will not trade below this low until buy-side liquidity is grabbed.”
Overall Expectation:
Price may retrace into the FVG (Fair Value Gap) zone.
After that, it’s expected to move higher toward the 42.65 level and possibly target the liquidity above equal highs near 46.50.
A projected move of +21.36% is highlighted from current price zone to the 42.65 target.

TASI IS PREPARING A BULLISH MOVEMENTCouple days ago, I posted that TASI will come lower to 11,535.390, and here it is now on the level in which it will probably create us an entry to take to target higher levels.
Follow so you don't miss the future updates!
