THE BEST BUY POSITION AT TADAWULThe market is purely controlled by the buyers so we are in a good position to buy, also the market respect the support line and give us a strong pullback with a high volume, so we can take that investment with confidence,
THE BUYERS ARE IN CONTROL
Saudistocks

SEERA GROUP MAY GO SIDEWAYS You should be aware of this green trend line, the market may go down until the the test of the green trend line, but we are well supported with the 200Ma, so we are not against the market but for now the market might take a corrective wave :)

ENTER AFTER THE RETEST!!The market will take the decision in the near future because we are within the 200MA and it can act again as a strong support, the market might go up after the testing of this range, if that the case then we can expect to get out of the market until the target level

THE MARKET WILL BE IN A NUMB SITUATION SOONWe need to see a test within the green line or if you prefer the safety then you can enter after the testing of the 200MA because we are clearly in a bullish trend

PREPARE TO SELL YOU SHARE THE MARKET MIGH GO TO 74.54We have a strong indications that the market will go down :
1.The 3 recent candles are all in gravestone profile, the market can't break the VWAP indicator, the VWAP act as a strong resistance,
2.The Fibonacci give us the level of 75% as a strong resistance too,
3.The respect of the red trend line and the market need to go back to the channel,
Summary:
The market needs to go back the the level of 61§ of the Fibonacci retracement, and then we may have a good buy configuration, with all the past indications it's very hard to tell that the market will go up furthermore,

GOOD HUNT AND EASY MONEY WAIT UNTIL 46.87Please stay in your position and sell your shares at the required level


THE MARKET WILL FIND IT EASY TO GO DOWN INSTEAD OF UP Stay close by, because the retest is near to happen


buying opportunity SAUDI BASIC INDUSTRIES CORPwe have a break in vwap with a large bogie plus an interesting volume this means that the buyers have entered the market so a buying opportunity

a buying opportunity NATIONAL COMMERCIAL BANKan interesting buy signal is explained by the breakout of the vwap and a very large volume means that the buyers have entered the market
a buying opportunity national commercial bank


BANK ALJAZIRA ANALYSIS - A STRONG MOVE IS COMING This analysis was based in the price action and we can tell that the next breakout will decide the market movement,
Stay in a watch out position,
Kind regards,

WE STILL HAVE FRESH BREATH TO REACH THE TARGET LEVELthis is an analysis for one of the best SAUDI ARABIA STOCKS,
stay a buyer

HOLD ON THE MARKET WILL GO UP FURTHER MORE This analysis is dedicated to the investors in DAR ALARKAN REAL ESTATE DEVELOPEMNT CO,
Stay tuned,
Kind regards


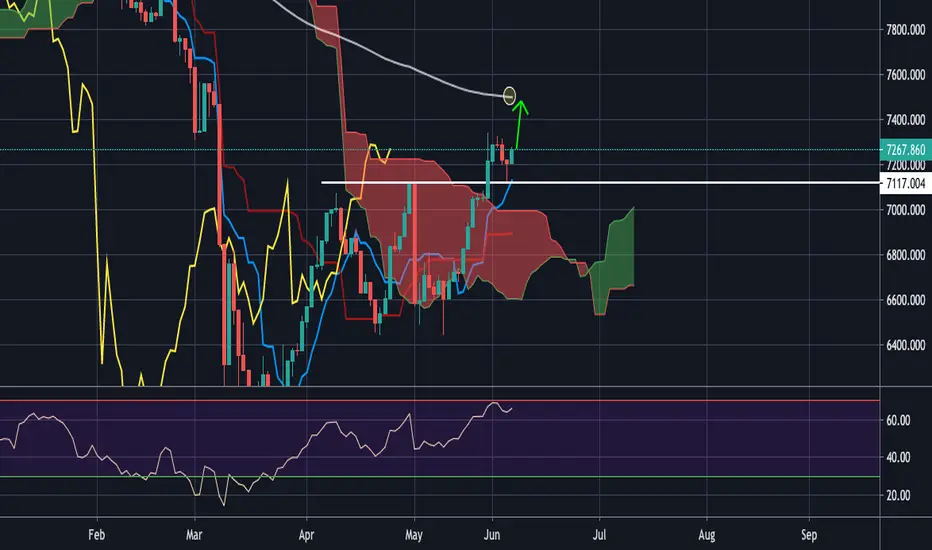
Saudi IndexTasi today gave a nice closing confirming more upside or rather resuming upside after the current small retracement from the recent highs. It also corresponds with FIb retracement levels. Market is ready to move upside and to test the 200 ema very soon. I can predict a J hook pattern which can be very strong up side move. I am bullish on this one. Happy Trading :)
Hit Like & Follow
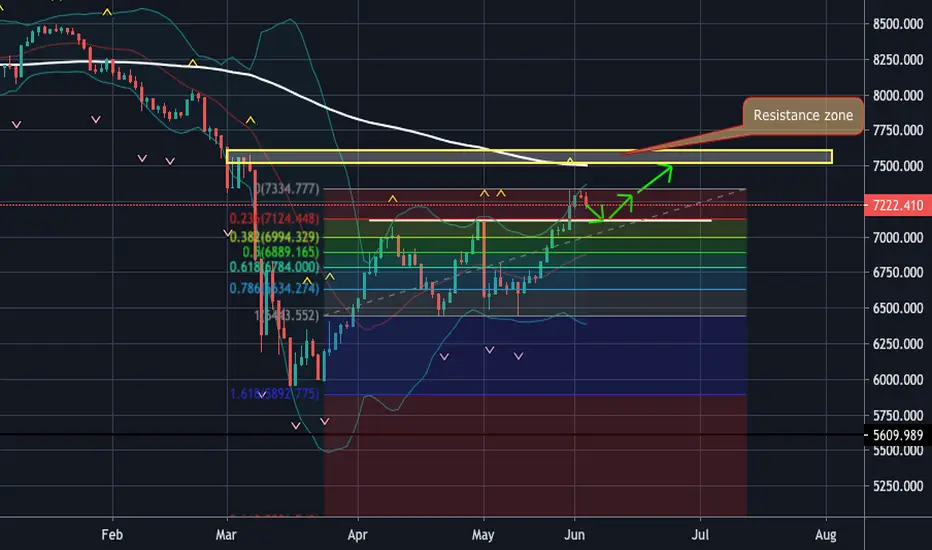
Tadawul retracementslow and steady retracement at the breakout levels. I think more upside coming soon. Many shares in tadawul have given breakout and are coming back for a restest i think more bullish scenario coming ahead. Happy Trading :)
Hit like & Follow

Tadawul Stuck in a range boxTadawul index is under pressure and in a range after heavy sell off triggered. Its been in this box for a while now and after 2 doji days i think either it should breakup or retrace from here and retest the bottom of the box area. Though still in a range but highly trade able as the range is big and looks juicy. In my opinion it will break up testing the 200 ema soon. Lets wait and watch till thn happy trading :)
Hit Like & Follow

SAUDI KAYAN PETROCHEMICHAL CO Buy Signal To Watch (2350)Recently , TADAWUL:2350 had enough bullish strength to break above the black line .
If we close in an upcoming day considerably above the green area (significantly above the 8.8 ) , this stock would very likely continue up towards the first blue rectangle area at the 9.8-10 area , with an important potential to reach the second target at the secong blue rectangle (11.2-11.7 area).
The probability of reaching the second blue rectangle area is considerable but it would depend also on how price will act around the first blue rectangle area (9.8-10 ) .
