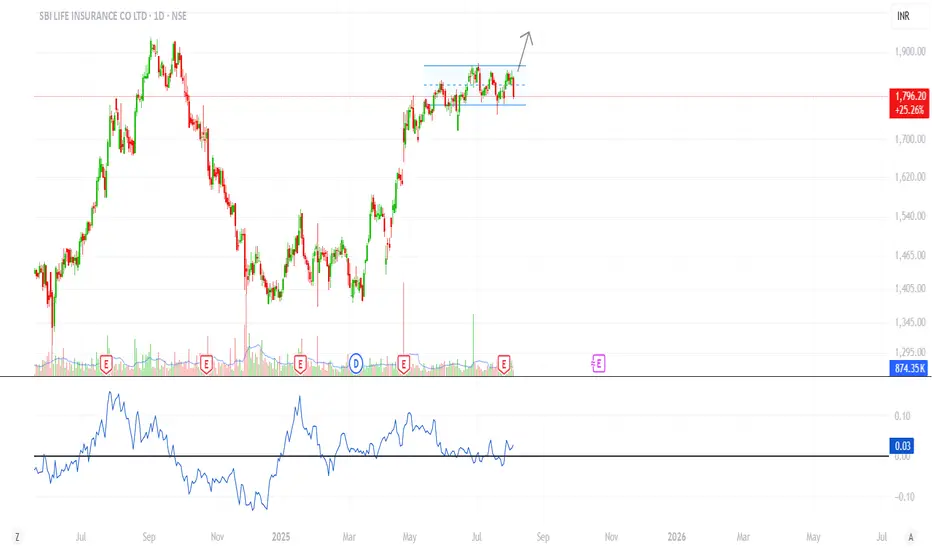
SBILIFE Chart Breakdown: Strategy, Targets & Risk Zones* Stock is outperform the Nifty in 21 days timeframe.
* Stock is little sideways and accumulation
* Wait for breakout
* SL- 1748
Sbilifeinsurance
SBI Cards in Symmetrical Traiangle PatternNSE:SBICARD formed a Symmetrical Traiangle Pattern. We can Target for 980 as a Safe target. You can still proceed and keep a Second target for 1160, however it would be Risk Reward and try to achieve keeping Trailing Stoploss. Safe Target would be 980.

SBI Life Insurance Co. Ltd. - Technical Analysis UpdateSupport and Resistance Zones:
1.Key Support Zone: ₹1,385-₹1,463
This zone aligns with the Fibonacci 0.236 retracement level and the recent reversal point, making it a strong support.
2.Immediate Resistance Levels:
₹1,555 (Fibonacci 0.382 retracement).
₹1,630 (Fibonacci 0.5 retracement).
₹1,705 (Fibonacci 0.618 retracement), a crucial level to watch.
3.Fibonacci Retracement Levels:
The stock has retraced sharply from its high of ₹1,943 and is showing signs of reversal near the 0.236 Fibonacci level. A breakout above ₹1,500 could confirm bullish momentum toward higher Fibonacci levels.
4.Volume Analysis:
Volume appears to be increasing near the support zone, indicating buying interest from market participants.
The Volume Profile indicates strong accumulation between ₹1,400-₹1,500.
5.Moving Averages:
The stock is attempting to reclaim the 20-day EMA as a dynamic support.
A crossover above the 50-day EMA could signal further bullish strength.
6.RSI (Relative Strength Index):
RSI is recovering from oversold levels, indicating a possible trend reversal. A move above 50 would strengthen the bullish case.
7.Projection:
If the stock sustains above ₹1,463, it could aim for ₹1,555 in the short term and ₹1,705 in the medium term.
A break below ₹1,385 would invalidate this view and could lead to further downside.
Conclusion:
SBI Life Insurance is poised for a potential bounce-back. Traders can consider entries near the ₹1,450-₹1,470 range, targeting ₹1,555 and ₹1,705 with appropriate stop losses below ₹1,385.

SBI LIFE SWING TRADE OPPORTUNITYSBI LIFE INSURANCE CO LTD:
Trading near Orderblock on the Sell off on 04.06.2024
Entry: 1400-1430
SL: 1300
Target: 1:3 R:R or upto 1900
NOT FINANCIAL ADVICE; FOR EDUCATIONAL PURPOSE ONLY
INVEST AT YOUR OWN RISK

SBI Life Insurance Daily Timeframe Analysis for long
NSE:SBILIFE has bounced back from strong support level of 1375 to 1400 with highest volume over past 6 month.
Can go long above 1440 with SL 1380.
Major Targets Highlighted in Blue lines, sub targets in grey lines.

SBILIFE- Swing-Bullish-Get Set Go!!
09.08.2024
Buy 1727
Target 1805
Stoploss 1662
Risk Reward: 01:01
1. Good engulfing pattern followed by good recovery with previous resistance breakout
2. Rejection from Resistance turned to support zone
3. 21 EMA Rejection & good FVG at same zone
4. Very good uptrend
5. RSI is strengthening. Volumes are contributing well

#SBILIFE Multi-year breakout stock #SBILIFE
Multi-year breakout stock
-Confirmed diagonal resistance Breakout after >4.5 years
-Continuous higher low formation
-Strong Increasing volume
Definitely worth to keep in watchlist; A retest on this stock can ignite interest for potential long.

SBILIFE- Good bullish momentum expected-Swing trade NSE:SBILIFE
Buy Above 1500
Target 1- 1565
Stop-1437
Daily & Weekly Inside candle breakout
Downward range ended & retesting successfully completed
EMA Rejections & crossover
Good volumes from last two days
Trend rejected from 0.5 Fibonacci & Above 0.382

SBILIFE Correction Time
Fresh Monthly Supply to fresh monthly Demand we have the Curve ready.
Now further in the lower timeframe we have a previous low violated and hence we se that the Sellers have come in Power.
Maybe just a little late to get inn but better late then never.

SBILIFE Breakout done after a Good Consolidation.
Volume looks good too.
Above all EMA.
Good for Short term and Long term.
Do Like ,Follow ,Comment for regular updates...
Disclaimer : This is not a Buy or Sell recommendation. I am not SEBI Registered. Please consult your financial advisor before making any investments . This is for Educational purpose only.

SBILIFE - Bearish ViewSBILIFE - Elliott Wave count
the market seems like completed all 5 impulses and has begun correction. wave A expected to hi t the target of 1250 range.
Please note that this information is for educational purposes only, and it is crucial to trade with caution.
NSE:SBILIFE NSE:SBILIFEZ2023 BSE:SBILIFE

A Clean Breakout Candidate Can u analyze and tell me how it's a good candidate to watch out for tomorrow?

#SBILIFE... Looking good 16.05.23#sbilife.. ✅▶️
Intraday as well as swing trade
All levels given in charts ...
IF good potential seen then we work in options also
if activate then possible a huge movement Keep eye on this ...
We take trade only when it activates...
Possible to give good target
TRADING FACTS

SBILIFE--Resistance becomes Support??------->> the stock is trending upwards
-------->> Broken the trendline and no retest is observed.
--------->> If the previous resistance acts as support we will observe a bullish again to the trendline.
Previous resistance zone @1150 look here for buy side.

{SBI LIFE}:{Expecting Hike 17%, Explained as per Wave Theory}
Price has completed Wave 1 and 2 and as per the Fibo Extension Wave 3 is atleast till the Golden Level of 1.618 which is Rs. 1394.75
This is a Monthly chart.
ENJOY THE RIDE ! ! !

SBI LIFE INSURANCE BUY FOR 1:2.39
Price has reacted to a Demand in Higher timeframe and will go up till the Monthly Supply formed @ 1167.25

SBI Life Insurance Cup & Handle Pattern formation*SBI Life Insurance*
Time Frame: Daily
Observation:
* Cup & Handle Pattern formation
* Mean(EMA) Diversion on daily time frame
Resistance/Target: 1359 1452 1546 1604
Support: 1205 1167

SBI LIFE INSURANCEDay chart of sbi life insurance it is making triangle pattern in which if it gives breakout in any side it can give a fast momentum.
alll time high is 1341
if it breaks upper side then can go up to 1341

SBILIFE - long viewThe stock has created a good base at the level range of 1016 levels.
As you can see the stock has taken support around this area and moved upwards.
It reached a high of 1293levels before crumbling to huge selling pressures.
The stock is trying to make its way back to the top.
I have presented my views on the chart with levels that can help you take your trades.
Thanks & Regards,
If you feel you can make use of my views and put them to good use, request you to kindly revert with feedback/suggestion/improvement

SBILIFESbi life bouncing back from a strong support zone.
It is a risky trade as the market is still not looking to move upwards.
But good to add some quantities with limited risk and keeping strict STOPLOSS of around 1085 levels.
Trade safe. Manage risk. Be profitable.
Please follow us for more simple trading analysis and setups. Also let me know in the comment in case you have any queries.
Disclaimer :- This is just my view. Please analyze charts yourself and then decide to take any trades.

SBI Life InsuranceSBI Life Insurance Formed Ascending Triangle Pattern
Disclaimer:
For Knowledge and Learning purpose only. Not a trading recommendation.

#28 SBI Life InsuranceNSE:SBILIFE
Reason Being:
1. Higher High Pattern Formation
2. Rising RSI and Above 60 Level
3. Breakout with Heavy Volume
View Negated Below: 914 in weekly closing Basis
#Disclaimer: I'm not a SEBI Registered Research Analyst, These are my views, please consult your Investment Advisor before buying and selling any position. This is just for Education Purpose.
if you liked it please don't forget to follow me
