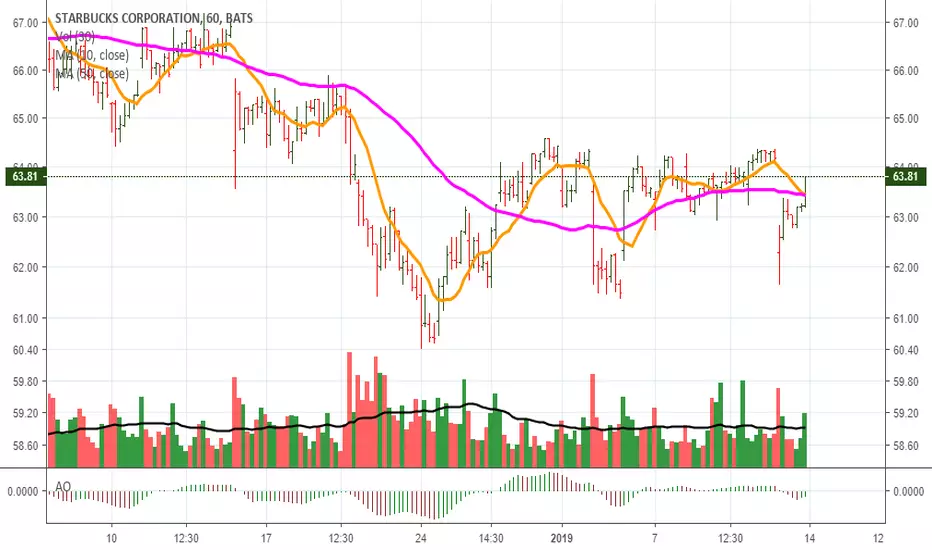
Bull flag SBUXSBUX is showing to me at least a bull flag on weekly timeframe!
But trade war, china, tarrifs, etc, SBUX should grow big in China, right? ???
SBUX

Bought SBUX Calls on a DIPSBUX down on overall market weakness, up-trend remains in-tact. Bought SBUX calls on Weakness expiring June 14th.

Wake Up With SBUX SignalsMegalodon Indicators are a must for day traders! Ease your workload, and reap profits quick!
The Megalodon Indicator uses an artificial intelligence, combined with over 500 different buy setups, as well as over 2000 different indicators to produce stunningly accurate buy and sell signals. Join Megalodon Trading today and get your hands on our automated trade bot for cryptocurrency! You will also receive real time buy and sell signals for the stock market, cryptocurrency, as well as forex markets! Link in Bio!

SBUX: Speculative with declining volume, no Dark PoolsThis chart pattern is highly speculative. This doesn’t mean the stock won’t go higher but that buying it at this price is a very risky situation. On the weekly scale, the trend is bending under selling pressure as smaller funds and retail buy because the stock has been moving up. This is NOT a Dark Pool accumulation mode. Volume is declining steadily also. Volume that declines precedes a correction, either sideways action which means more upside eventually, OR a downside correction to a support level where fundamentals meet technical price levels.


STARBUCKS CORP (SBUX)(NASDAQ) Buy Stop $76.06 >>> Target $77.32NASDAQ:SBUX
STARBUCKS CORP
Stock - NASDAQ (USA)
---
Buy Stop = $76.06
Take Profit = $77.32
Stop Loss = $74.79
------
Take Profit = +1.66%
Stop Loss = -1.67%

STARBUCKS CORP (SBUX)(NASDAQ) Buy $75.12 >>> Target $75.80NASDAQ:SBUX
STARBUCKS CORP
Stock - NASDAQ (USA)
Profit:Risk = 2:1
---
Buy = $75.12
Take Profit = $75.80
Stop Loss = $74.78
------
Take Profit = +0.91%
Stop Loss = -0.45%

Shorting Starbucks sharesOn the daily chart of SBUX, the price has formed a Two Peaks sell signal. According to my Elliott wave structure, the price has finished the 5th wave and now I expect the instrument to start the ABC zigzag, which is my profit zone. SL, TP and entry levels are marked on the chart.

SBUX distributionMulti-Year Wyckoff Distribution
Weekly Bollinger Band M Top within Macro upthrust after distribution (UTAD)
SMI Divergence
Volume Increasing within the trading range (Trait of Distribution)

Presidential CoffeeHoward Schultz, the billionaire founder of Starbucks has been in the news lately, as he flirts with the idea of running for President in 2020. With that being said, the Megalodon is giving us buy signal on the technical side!
The Megalodon indicator uses an artificial intelligence, combined with data from over 500 buy setups, and over 2000 indicators to produce extremely accurate buy signals on any and all asset classes! Send me a message if you would like to try it for yourself!

SBUX - Starbucks. Possible Short Setup.Possible short setup on SBUX, looking entry between 786-886 (highlighted in orange) or 1 line.
Don't forget to check the weekly Maxx Momentum to see if we have bearish divergence coupled with loss of momentum.
If SBUX breaks the white trend I have on the chart I believe that the targets levels I have are more likely to get tested.
Maxx <3

$sbux two fake breakout, target 61 then 58 then 54If $sbux cannot please the street. it is a short to 58 54 and even lower

THE WEEK AHEAD: IBM, SBUX, USO, OIH, XOP(Pulling hair out). Ugh. A tough market temporarily for premium sellers. With VIX caving in dramatically off of its late December greater-than-35 highs, premium selling is the old gray mare that (temporarily) just ain't what it used to be.
That being said, there are a couple of potential earnings plays to be had next week: IBM (68/31; Tuesday after market close) and SBUX (67/27; Thursday after market close).
As you can see by the background implied volatility metrics, well, they ain't great, with IBM coming in at 31 and SBUX at 27. That being said, the February to March implied volatility contraction in IBM at the moment appears to be potentially from 32.7% to 26.6% (23% or so), and the SBUX from 25.7% to 23.5% (9.4%). From that standpoint, IBM appears to be the better volatility contraction play, since the market's pricing in a bigger contraction in the "Watson AI" company than in the omnipresent coffee purveyor. However, if you're going to play Watson, you're going to have to deal with goofy five-wides in the monthlies which, in itself, makes the play unappealing. Using the weeklies for a more surgical approach gets you fairly wide markets. Again, unappealing. (Scratches IBM off his list).
SBUX suffers from the same problem, but with two-and-a-half wides. I remember playing SBUX before, but don't recall having this two-and-half wide nonsense in the monthlies. (Scratches SBUX off his list, too).
On the exchange-traded fund front, some implied volatility juice appears to be concentrated in the petros -- USO, OIH, and XOP, where it pretty much is to a lesser or greater degree all the time. This is why I pretty much have some kind of trade on and running in XOP almost all the time. (See Post Below for my current XOP trade). This isn't necessarily the greatest place to start a relationship with this underlying (the implied volatility's at the low end of its 52-week range), but it's not paying horribly. Due to its relatively small size (31.60 at Friday close), I like to short straddle it -- the March 15th 32 short straddle is paying 2.92 at the mid with a 25% max take profit .73, which beats a poke in the eye with a sharp stick.
In light of the broad market volatility crush, this is just one of those weeks where I don't anticipate putting much on unless something dramatically changes or I stumble across something directional to play. Until then, I'll just sit on a bunch of dry powder, and it deploy it when the time comes.

SBUX BOLD CALL - COFFEE IS FUTUREstarbux attractive risk reward
secret sauce
sbux can explode to 90-as high as 106


SBUX: Shift of Sentiment Pattern Leads Gap Up to PlatformSBUX has now confirmed the gap gains by holding well above the trading range highs. This provides very strong support for the stock to continue moving upward. This daily chart of the stock shows a Shift of Sentiment™ Pattern with the Accumulation/Distribution indicator. The shifting pattern begins with the common gap down by HFTs in June and then the VWAP automated selling by the smaller funds to the final low. Then, the stock moves in a typical Dark Pool Pattern out of the low. Pro traders and HFTs gap the stock up in November on earnings news. Another platform is developing now above that gap which establishes more support at this level.

How far will Starbucks retrace ? Starbucks is oversold and started pulling back. Finally the RSI dropped below 70.
First target: 62.55
Second target : 60.70

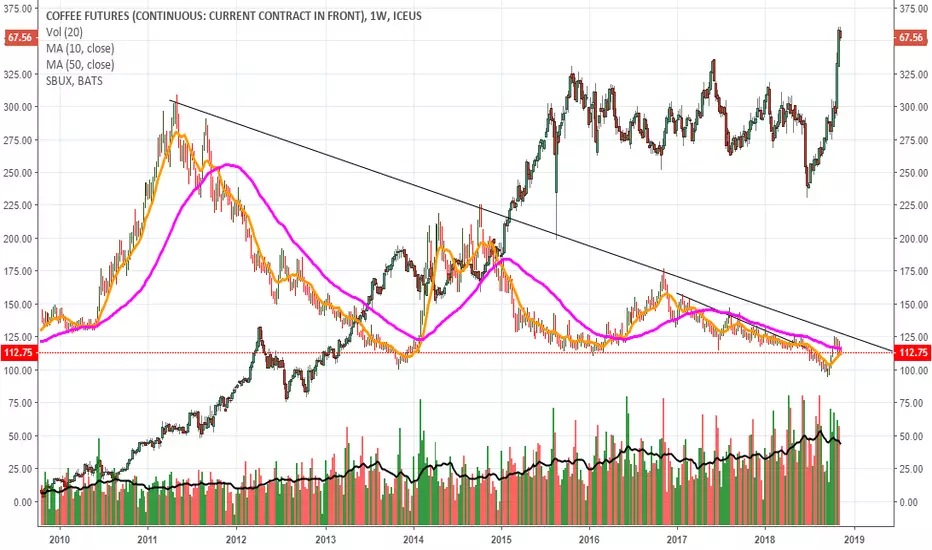
SBUX vs KC1! (coffee futures)Coffee prices seem to be reaching a pivotal point with possible break out. Starbucks has enjoyed decreasin coffee prices over the last decade. A break out in coffee could be good sign to short SBUX $BJO
1 indicator to beat SBUXit's mainly for swing trading, i use the 3 day / 15 day / monthly charts with it and it works perfectly,
it works good for stocks and cryptocurrency.
you will use heiken ashi chart style and turn on the EMA DOTS indicator.
once the indicator is on you will hide the heiken ashi so you only see the dots.
when a green dot appears you buy, if a green dot appears after that green dot you hold your investment.
if a red dot appears you sell your position. easy as that.
shorter time frames will be choppy.
larger time frames will be smooth.
