SC-cup and handle.The level of support has moved slightly lower to the level of 216-214 , this time the support is much stronger and even if the fall is deeper, it will be the l ast drop in the coin , then only go up by the Elliott waves and guided by the Fibo. resistance zones and the trend bounce zones , in the aggregate confident levels. Buy below 220 and sell for 700. Good luck!
SC-BTC

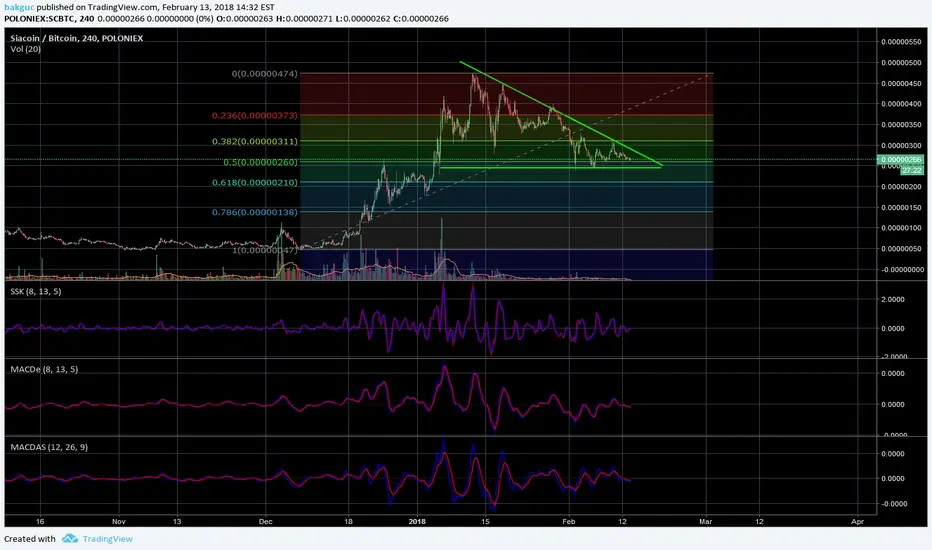
SC - SIACOIN BUY AT THIS PRICESC will move to the uptrend channel in a short time. After 310 , SC will jump to 400 easily
Siacoin (SC) vs BTC 4hr Chart UpdateA quick hi to all our followers on our Social Media and Telegram. We shall be posting occasional Technical Analysis and Charts for better understanding and support to some of our trades on TradingView.
------------------
Siacoin has remained within the pennant during the BTC dip.
As long as SC keeps nice and strong, we should see a nice spike once it breaks out towards our 20% Profit Sell target of 0.00000496BTC.
Fundamentals: coinmarketcal.com


SIA 170%+ GainSCBTC forming a three drive pattern.
TP: 440
Please do not rely on this chart, do your own research.


Sia BUY OpportunitySia is currently currently in a falling wedge and looks extremely oversold on the daily chart. RSI hovering around 20, MACD flat. With a big new release expected in November and as bitcoin's price retracement looks more and more likely I believe Sia to be one of the better buys you can make right now. Target entry is around 55sat if falling wedge is broken, first target 200sat, final target between 400 and 500 sat.
Thanks for reading, make sure you give this analysis a thumbs up if it you liked it and, as always, make sure you do your own research!

SC/BTC CryptoLeaks Signals, BUYBuy SCBTC @ 0.00000079
Target: 0.00000100
Signals:
1- Supply and Demand
2- CCI indicator crossed +100
3- MACD


Waiting patiently for Siacoin Couldn't think of a meme title for this chart, all you need to know that its a long term hold


SC: Possible drop incoming, moon afterwards.SC has been getting a lot of positive news recently (ride the trend guys, the news surrounding SC is very positive). It is definitely a long term hold. The project itself is genius - if you haven't invested in SC yet i'd recommend to do so and hold.
As for the chart - I think that history will repeat itself and we will now see a drop until it reaches the bottom (indicated as buy zone) and it will go up again.


Siacoin is grow up to 750 or more maybe 900 satoshisHello, I am new here, I have some experience in the financial or monetary world, but I have more experience in the crypto world, I am not an expert in reading charts, but it is my modest opinion on Siacoin, because I follow the SC since its creation and Is an impressive technology and project. And in recent days SC with HP announced the Minebox the first physical and decentralized storage itself. Also this month has several updates for SC. And this makes me think that the price touch the stand of 420 satpshis or less the price is to grow up to 750 to 800 satoshis maybe 900. www.tradingview.com

SiacoinSome details on chart. Could still go down, depends how btc is going I think (or other alts). Looks ok.
