USDCHF 15 min SCALPINGHello TradingView community and my followers, please if you like the ideas, don't forget to support them with likes and comments, thank you very much and here we go.
.
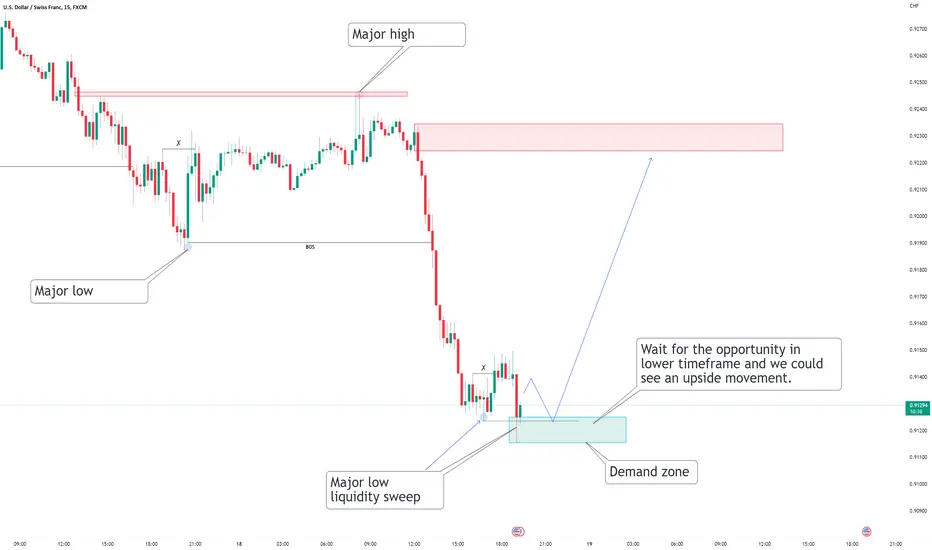
USDCHF
15 min : It has taken the liquidity from major low.
*Wait for the opportunity in lower timeframe (1 min) and we could see an upside movement.
THANK YOU !!!!
Scalping
Decreasing volumes, weak buyer. Waiting for the fallThe coin, after a long growth, went on a correction, as a result, a horizontal support level of 5.92 was formed, confirmed by several touches. Currently, the coin is consolidating at this level, volumes are declining, which indicates the weakness of the buyer. I expect a breakdown of this level, consolidation under it and a decrease to the lower support levels.

XAUUSD SCALPING SETUP on M15You might get profit around 70 PIPS on this setup/entry.
Reason for entry :
1) Market Structure: Downtrend
2) Area of Value : Potential Support Become Resistance area and its a supply zone where market done a Drop base Drop

Cascade of lows. Impulse break downOn the coin, after a strong growth, an interesting cascade of loons was formed.
I consider the impulse breakdown of the cascade after the formation of local trading at the upper level with ideas to collect liquidity below.
I will not enter the entrance when there is activity in the glass, I will not enter from the approach.

USDCHF 4H ForecastPrice is trading in a bearish trend so for the most we are in an impulse move 1-2-3-4-5, wave 4 seems to be one of those unclear triangle patterns. The idea is we can expect a sell-off soon as a wave 5. The only way to invalidate the triangle pattern is by breaking the wave A high.

There is no buying volume. Breakout of local lows. ShortFor the coin, both trading volumes and local highs are decreasing, which indicates the absence of a limit buyer ready to buy corrections. The price approaches its local loys, forming a descending triangle. I am waiting for BTC impulse liquidity removal behind the level, but only if there is a trade. Target – $20290 (1.24% of the entry point)

Decreasing volumes, weakness of the buyer. Breakdown The instrument after growth came to a sloping support line. Volumes are declining, which tells us about the weakness of the buyer to push the price higher. I expect a pulse breakdown of the inclined level with the support of volumes in the seller's glass, its retest and the reduction of the instrument to the lower support levels.

GBPUSD 15 MIN SCALPING TRADEHello TradingView community and my followers, please if you like the ideas, don't forget to support them with likes and comments, thank you very much and here we go.
.
GBPUSD
15 min : It has come to supply zone and it has took liquidity from higher high.
*Wait for the opportunity in 1 min timeframe and we could see an Downside movement.
THANK YOU !!!!

Bitcoin Scalping Signal for Day Trading🖥️ We have determined there is a 70% chance Bitcoin will RISE from our current entry point.
📉 LONG - BTC : $16,855 📉
💵 Length of trade: we are expecting BTC to hit a $200 scalp, with a high end of $300 - minimum expectation $125.
🕰️ Duration of trade: we are expecting BTC to try and retouch today's top, and then possibly continue its way up still till Friday.
📊🖥️ INDICATOR SHOWN ON CHART : Scot Signal Indicator

BTCUSDT Scalp idea By HesamUNThey traders
as we expected, BTC touched the S&D area around 17550
what u think about BTC ?
Can bulls keep the trend and break out the pattern ? or what ?
Share ur chart and leave a comment

DAY TRADING 101: How to Get StartedHello guys! Day trading is a popular way for traders to make money by buying and selling assets within the same trading day. However, before you begin day trading, it's important to understand the basics and develop a solid trading strategy. In this post, we'll cover the basics of day trading and provide some tips on how to get started.
First, it's important to understand the different types of securities that you can day trade. Some popular options include stocks, options, futures, and currencies. Each of these securities has its own unique characteristics and requires different strategies, so it's important to choose the one that best fits your goals and risk tolerance.
Next, you need to develop a trading plan . Your plan should include your trading strategy, the securities you plan to trade, and your risk management techniques. It's also important to set realistic goals and be prepared to stick to them.
Once you have a trading plan in place, you need to practice . You can do this by using a simulation or paper trading account. This will allow you to test your trading strategy and learn from your mistakes before you start risking real money.
Another important thing to consider is your risk management . This means understanding the level of risk you're willing to take and setting stop-losses and profit-taking orders to protect your capital. It's also important to maintain a proper risk-reward ratio, which means that the potential profit should be larger than the potential loss.
In addition to the above, it's crucial to keep an eye on the market and news , as they can greatly impact your trades, so it's essential to stay updated with the latest news and trends. Finally, keep in mind that day trading requires discipline and patience, so be prepared to put in the time and effort to become a successful trader.
To sum it up, day trading can be a great way to make money, but it's important to understand the basics and develop a solid trading strategy. Additionally, you should practice with a simulation or paper trading account, have a proper risk management, stay informed and be prepared to put in the time and effort.
Which type of trading do you prefer?

XAUUSD 15 min SCALPING TRADEHello TradingView community and my followers, please if you like the ideas, don't forget to support them with likes and comments, thank you very much and here we go.
.
XAUUSD
15 min : It has come to demand zone at Major low. and SL hunting is also done.
*Wait for the opportunity in 1 min timeframe and we could see an upside movement.
THANK YOU !!!!

CADCHF I Buy scalp to resistance Welcome back! Let me know your thoughts in the comments!
**CADCHF Analysis - Listen to video!
We recommend that you keep this pair on your watchlist and enter when the entry criteria of your strategy is met.
Please support this idea with a LIKE and COMMENT if you find it useful and Click "Follow" on our profile if you'd like these trade ideas delivered straight to your email in the future.
Thanks for your continued support!

AUDUSD I Scalp and intraday buy from supportWelcome back! Let me know your thoughts in the comments!
**AUDUSD Analysis - Listen to video!
We recommend that you keep this pair on your watchlist and enter when the entry criteria of your strategy is met.
Please support this idea with a LIKE and COMMENT if you find it useful and Click "Follow" on our profile if you'd like these trade ideas delivered straight to your email in the future.
Thanks for your continued support!

Scaling Short impulse catchHello, I put my sell order limit on 15.804 and I want to catch that impulse.

GBPJPYHello everyone, GJ is in a range, so I'm waiting for one of these two scenarios to take a position in either direction. To confirm the breakout, wait for the candle to close (at least on the 30 min tf).

Scalp Peak Formation on ETHEthereum has risen above 1300 which is a key whole number. We will see a lot of manipulation in this zone and we can try to take advantage of it. Many traders will have placed orders to go long whenever the price of Ethereum goes above 1300. Those orders have now been triggered, traders will likely get trapped and they will not be released for quite some time. This presents us with an opportunity to scalp the formation of a double or triple top in this area.
I believe this is the peak of level 2 on the 4hr chart and level 6 on the 1hr chart (wave 2 and wave 6 if you prefer). The market maker algorithm usually only paints 3 levels on the 1hr chart so that's why I am confident that they will now go into a peak formation. We have no way of knowing how long this will take, so I won't waste my time trying to predict the timing - it's enough to have an understanding of what is likely to happen and prepare accordingly.
If you are in agreement with my idea then you can trade the drop of the first leg down. The yellow lines on my chart are levels where they may potentially bounce and start the first leg up. If they are not yet done with this very strong push higher then price may not even drop as low as my first yellow line so please be prepared for that scenario.
We know that the market maker algorithm uses mean reversion and that is basically what we are trading here. Price would normally come back to the 50 MA on the 1 hour chart but after such a strong move up I would expect mean reversion to take price below the 50MA, below the 100MA and probably all the way to the 200MA. Keep an eye on those moving averages for potential bounces and I will update this idea as things progress. If it is too early for mean reversion then we can re-evaluate this idea after the next leg up.

AUDJPY 1 hour uptrend can be scalped on lower timeframes Here is some potential for scalping buy trades on the AUDJPY if we get good pullbacks and the right entry signals on the lower timeframes i.e. on 5 minute or 15 minute charts.

GALA Scalp By HesamUNTHey traders
check the chart
what u think about this Scalp ?
after confirmation it worth it 2 take a scalp trade with high leverage
share ur thought and leave a comment

Approached the inclined level. Buyer weak, time to sellThe instrument, after a long growth, came to a sloping support line. Volumes are declining, which tells us about the weakness of the buyer to push the price higher. I expect a pulse breakdown of the inclined level with the support of volumes in the seller's glass, its retest and the reduction of the instrument to the lower support levels.

SUSHIUSDT By HesamUNTHey traders
as u can see price playing below the supply zone around 1.5
we can expect more buy pressure to the Zone
this Zone will b trend Confirmation
as long we play below this zone, it worth it 2 take a short position
what u think ? share your thought and leave a comment

4 level touches. Getting ready to fall!The coin has grown well. The price approaches the local maximum around 0.1956. We see weakness on the part of buyers, large red candles and shadows. I expect a pin of 0.195 and a rebound from that level below. In support, an oblique level with 4 touches has formed, the next approach may be the final one before the breakdown. PoC Volume Level Targets

High BITCOIN network activity (Correction)Hello Traders
As you can see in the chart above price had a bullish momentum; in the past week, Dollar Index had a death cross and decreased, which can sustain this bullish movement of bitcoin.
On the Onchain side, I screenshotted a metric from Glassnode called Net realized Profit/Loss, which is the net profit or loss of all moved coins. The metric value has decreased drastically, indicating a bullish price move. Massive on-chain activities showed that old wallet had also moved their bitcoins in a loss. Indeed, there is a risk of volatility for the price, but I can see a correction before the continuation of the price, and I believe price can see higher prices.
Note that this is an Intraday analysis and is only valid for a couple of days or even hours.
------------------------------------------------------------------------
What is your opinion? Comment below.
If you like the idea, please hit the boost button and follow me so you will get the updates. The information given is never financial advice. Always do your research too.
Good luck.
