scusdtI am only analyzing Altcoins prone to growth in these few days
Your own risk
Manage your capital
SCUSDT

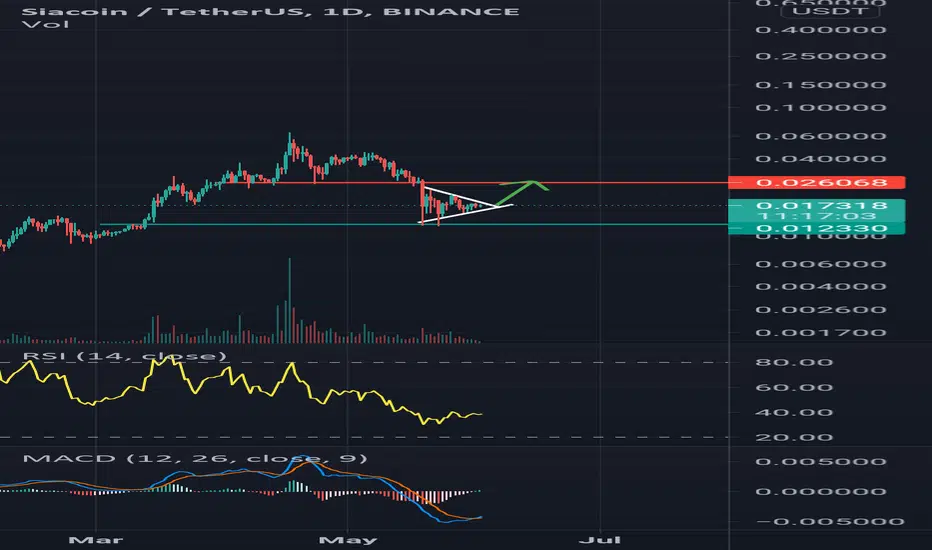
SC - OverlookSC attracted all attentions. Did a 30% pump in about one hour and still has good buy volumes.
There are support areas holding the price up and also a very powerful resistance.
So having all these in mind, I don't think that we can see another pump for now, so be careful with your long positions.
That possible target on the chart is hard to reach so don't get greedy.
Current Market Price: $0.017916
Good Luck
Tell me your ideas. Like and Share

Inverse Head & Shoulders - Long opportunity with 6:1 R:R Hi all,
Main TA Points;
***
1. Inverse H&S pattern.
2. Break and retest of 20MA currently holding.
3. Bollingers continue to tighten signalling incoming volatility.
4. No relief rally in over 10 weeks.
5. Good R:R
***
Talking Points;
***
Going to keep it simple this time,
After reaching a peak of 6.5 cents we have had a long consolidation across the board. There has been uncertainty as to whether the Crypto Bull Run is over.
I am of the persuasion that this is not the case. This month is crucial for all Crpyto to regain momentum and I think we will be successful.
Nevertheless, we have not seen a relief rally in the last 2+ months and at the very least I expect a retest of the ichomoku as resistance for Siacoin.
Additionally we have a break of the descending trend line for SCBTC pairing. Obviously we would prefer that Bitcoin leads the charge, and its worth noting that we are still valued at over 30K which is outstanding when you think about it.
***
Estimates;
***
As a measured move we are looking to test the 2.2 cent region. The R:R is good on this trade.
Good luck,
Please consider donating, following or leaving a comment if this analysis was valuable to you.
SIA donations;
807db3f1186dd2a5a40418200064b44a94bffb0e32fac9e713923088a7e3bb0886c2d0281374
***
***
Any trading advice provided has been prepared without taking into account your objectives, financial situation or needs. Before acting on the information provided you should consider the appropriateness of the information, having regard to your objectives, financial situation and needs. You should seek professional personal financial advice before making any financial or investment decisions.
All investment and trade decisions, no matter how well investigated, involve risk.

SC going to test resistance.hello everyone.
trend analysis is basic of technical analysis and trade based on it, is always trustworthy.
it is not a piece of financial advice always do your own research.

SCUSDT is continuing the Bullish channel
Welcome back Traders, Investors, and Community!
Hi Traders, SCUSDT on the H4, A Bullish channel after the breakout the Resistance, however it might break below the Support line off the channel but it’s expected to continue going higher to 0.0152
We will have more FREE forecasts in TradingView soon
❤️ Your Support is really appreciated!❤️
Have a Profitable Day


SIA COIN - On the RiseUpdated SIA coin chart.
One of our favorite projects and technically at a great time to Buy again.
the FXPROFESSOR

SCUSD| Sia formed W and bottom on RSISiacoin have already formed W on a daily timeframe (as BTC). Also we have bottom on RSI, we bounced every time from this in a Bull Market.


SIACOIN USD | 0.09| 0.12Average buy price - 3,9 cents
Below 3 cents will buy more (Big support on 2,5 cents)
Take profit on 9 cents, then will buy at 5-6 cents and take profit at 12 cents.

SC; another deeper look, moon cancelled?? wtf is happening?? hmm
k i went deep here guys. took a look at the coinmarketcap chart which can be good sometimes to spot big macro trends.
coinmarketcap.com
put it on all time and log. what do you see?
see there are two macro fractals as i see it now. the obvious one which ive been focusing on and the sneaky not so great one.
prob some heavy bias coming into play there too.
---------------------------------------
white or red (pinky red wtf it is)
two options. use your stops accordingly.
this will be the last SIACOIN analysis until the price action shows us which option is to unfold.
glhf

Siacoin Is About to Explode 🚀 🚀 🚀💡 Trade Idea
📈 SC/USDT Buy Market Order @ 0.02115
🎯 Target Profit 0.02445
🛑 Stop Loss 0.01952
❌ Do not risk more than 1% of your account on each trade
🙂 Good Luck!
Description:
The price is trading inside the wedge pattern where we have seen higher lows that led to a breakout of the strong resistance to the upside. Currently, the price is correcting toward the support (previously resistance), and after that we expect a huge rally toward our target profit.
-------------------------------------------------------------------------------------
Please press “Like” if you appreciate the trading idea 👍
“Follow” for more trading ideas in the future 👀
“Comment” below to share your thoughts with us and other traders 👥
-------------------------------------------------------------------------------------
Risk Disclaimer: All trading ideas published by “collegeofpips” are for educational purposes only. These posts can help you to enhance your trading skills, but please do your own research before opening any trading position. ⚠️


SC : SIACOIN ; i can do this all day long babySC : SIACOIN ; i can do this all day long baby
60x from here??? @@ wtf gtfoh
Ajusted the fractal to fit this last dump. Again I don't think I did have the right place. The fact we broke out of rising wedge or wtf you want to call it isn't good imo.
if this plays out ill buy you all icecreams.
i supply the hopium, you supply the bids.
x


Siacoin to reach 0.10 very soonI expect that Siacoin eventually will reach the 0.10 in a very short time (125% upwards). For the short term, I expect consolidations after an upside earlier today that gave us about 25%, Consolidations between 0.0387 and 0.0435 before we have a serious of runs up. Next target is 0.058- 0.062

SC Going to Pump ...Siacoin going to break the strong resistance and pump more than 30% ... our midterm target is $0.10

Siacoin to revisits 0.03580 then...SC to revisits the 0.03580 before the continuations upwards.
trade at your own risk

SC bullish for the short termI expect SC to rise to 0.0435 before falling again, There is still unfinished business to cover that gap of 0.035-0.0335 when the breakouts happen from the descending triangle. Right now SC is trading within the formation of rising wedge in green.
Trade at your own risk.
