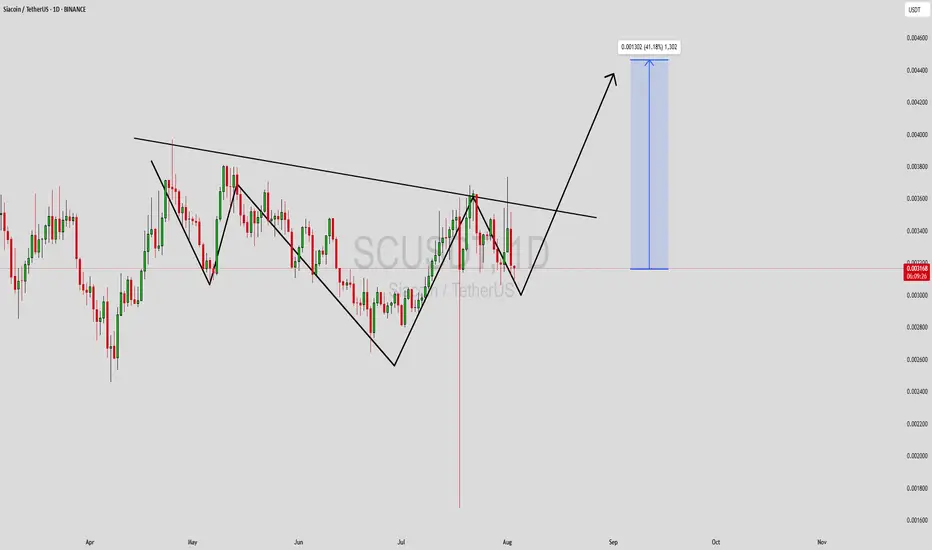
SCUSDT Forming Potential BreakoutSCUSDT (Siacoin paired with USDT) is currently shaping up to be an interesting opportunity for bullish traders. The chart reveals a potential breakout setup forming after a series of higher lows and a well-defined descending trendline. This pattern suggests a coiled price action, which typically precedes a breakout. The volume has remained healthy during the consolidation phase, and a breakout from this structure could lead to a significant upward movement.
The expected gain range of 30% to 40%+ is supported by the current price structure and projected breakout targets. If SCUSDT manages to break above the resistance zone, the momentum could accelerate quickly, especially with investor sentiment building around decentralized storage solutions like Siacoin. This crypto asset has a history of sharp upside moves when volume kicks in, and this setup aligns well with previous bullish phases.
Interest in SCUSDT is also gaining traction from the broader community, as decentralized storage continues to be a hot topic in blockchain utility. As the ecosystem around data privacy and censorship resistance grows, coins like SC become increasingly relevant. This fundamental narrative, paired with the technical breakout pattern forming, makes SCUSDT worth watching closely.
Traders should keep an eye on the breakout zone marked on the chart. A confirmed candle close above that trendline with volume could ignite a fresh rally toward the 40% target area. Managing risk properly and watching for continuation patterns post-breakout can help capitalize on the upcoming move.
✅ Show your support by hitting the like button and
✅ Leaving a comment below! (What is You opinion about this Coin)
Your feedback and engagement keep me inspired to share more insightful market analysis with you!
Scusdtbuy
SCUSDT 1WSC ~ 1W Analysis
#SC This is the lowest support for now. Buy from here if you have a Conviction on this coin with a short -term target of at least 20%+.

SCUSDT 1WSC ~ 1W
#SC If you still have Conviction on this coin,. This support block is a great price to start buying again.

sc testing resistancesia coin is testing resistance here, needs to flip it support to see a next move up
but if you got in on my previous chart when i called the bottom just enjoy the ride

sc nice bounce off bottomsia coin had a nice bounce off the bottom support with bull divs
could see a big move coming soon

SCUSDT - Trend BreakoutSCUSDT (4h Chart) Technical analysis
SCUSDT (4h Chart) Currently trading at $0.0161
Buy level :Above $0.0158
Stop loss: Below $0.0142
TP1: $0.0169
TP2: $0.0184
TP3: $0.0201
TP4: $0.0217
Max Leverage 3x
Always keep Stop loss
Follow Our Tradingview Account for More Technical Analysis Updates, | Like, Share and Comment Your thoughts.


SC/USDT 1HOUR UPDATEWelcome to this quick SC/USDT analysis.
I have tried my best to bring the best possible outcome me in this chart.
Reason of trade :- SC/USDT is bullish and good news
Entry:-CMP and green zone
Traget:- 30% to 40%
Stoploss:- $0.015900
Remember:-This is not a piece of financial advice. All investment made by me is under my own risk and I am held responsible for my own profit and losses. So, do your own research before investing in this trade.
Happy trading.
Sorry for my english it is not my native languages.
Do hit the like button if you like it and share your charts in the comments section.
Thank you...

SCUSDT Perfect CwH Pattern | 215% Move ExpectedSCUSDT Perfect CwH Pattern | 215% Move Expected
SC has been trading below 0.020282 since May 26, 2021, and tried to break that price on June 5, 2021, and August 1, 2021, but failed after creating triple tops.
Now we can see that a very strong trend reversal pattern (Cup with Handle) is formed and the market is again trying to break 0.020282.
I am expecting a 200% move from the current position if we see a successful breakout.
I have explained everything in the chart and here you can read price points.
Entry: 0.020282
TP1: 0.027660
TP2: 0.033414
TP3: 0.040349
TP4: 0.047432
TP5: 0.053776
Final Target: 0.063810
SL: 0.015265
Net ROI: 190% 215%
Trade Risk: 25%
Exchange: Binance
Do not use more than 10% risk of your account.
NOTE: Educational Purpose. Do your own analysis. Do proper risk and money management. Respect your stop loss. Spot Trading only. I will not be responsible for any of your losses.
