BTC - Trap, Tap, and Blast Off!BTC has been overall bullish, trading within the rising blue channel (1). After reaching a local high, it entered a short-term correction, forming a falling red channel (2).
👀All eyes are now on the key demand zone (3), which aligns with the lower bound of both the red channel and the rising blue structure.
🔎As long as this confluence holds, we anticipate a potential bullish impulse in August.
A retest of the $111,500–$112,000 zone could serve as the trigger for the next leg toward $128,000. Let’s see if BTC is gearing up for another breakout or if a deeper correction is in play.
🔔 Disclaimer: This analysis is for educational and informational purposes only. It does not constitute financial advice or a recommendation to buy or sell any asset. Always do your own research and manage your risk accordingly.
📚 Always follow your trading plan => including entry, risk management, and trade execution.
Good luck!
All strategies are good, if managed properly.
~ Richard Nasr
Season

$HBAR Wave 4 finishing soon?CRYPTOCAP:HBAR Hedera appears to have completed wave 4 with the test of the High Volume Node support at the 0.382 Fibonacci retracement.
Wave 5 has an expected target of the High Volume Node resistance at $0.4 before a larger retracement in wave 2 aligning with my summer pump august / September dump view.
Analysis is invalidated below $0.1933 at the 0.5 Fib retracement and will be updated to a wave 2 instead of 4.
Safe trading

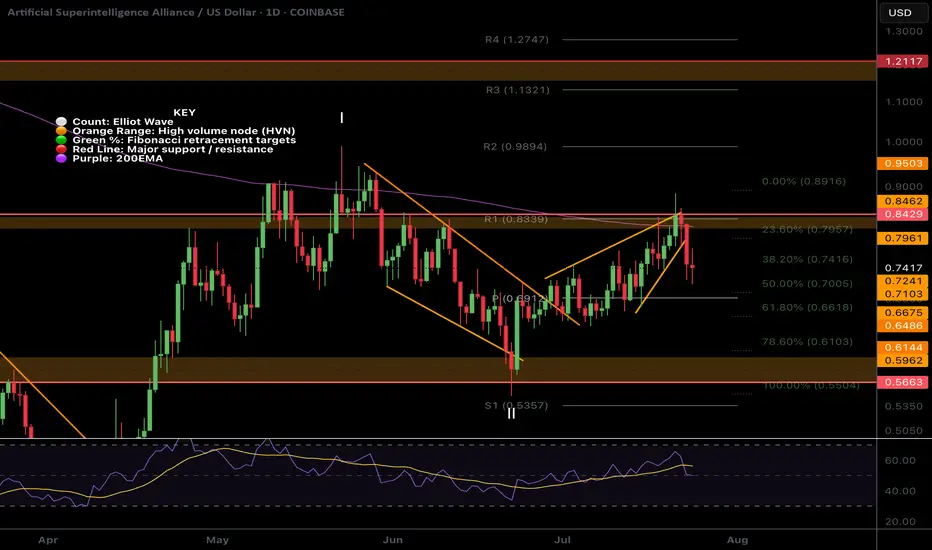
$FET local ending Diagonal and wave 2 near completion?NYSE:FET was rejected for the 4th time at the daily 200EMA! Each time the probability of a breakout increases.
I have adjusted the High Volume Nodes for accuracy.
Locally Fetch appears to have completed a motif wave up with an ending diagonal for wave 5. Wave 2 is expected to find support at the daily pivot and .618 Fibonacci retracement before attempting a breakout of the daily 200EMA once more.
A move below wave II will invalidate this analysis.
Safe trading
$ETH Hit Our Targets and was rejectedCRYPTOCAP:ETH hit our signal take profit target at $3820 and was rejected at the High Volume Node EQ to the penny.
That appears to have completed wave 3 of this motif wave. Wave 4 has an expected target of the R2 daily pivot and 0.236-0.382 Fibonacci retracement, $3260 before continuing to the upside in wave 5 with a target of the all time high.
This aligns with my views of a significant pullback at the end of August and September which is typical after a summer rally.
No divergences yet in daily RSI.
Safe trading

$AAVE Daily Hidden Bullish divergence?CRYPTOCAP:AAVE and alts begin their retracement Wednesday but is this a long term top or just local? Im betting we have a higher to go this summer..
Hidden daily bullish divergence is printing on RSI at the daily pivot and 0.5 Fibonacci retracement which should all act as strong support provided BTC doesn't dump.
The 'alt-coin golden pocket' Fibonacci retracement 0.786 sits at the descending daily 200EMA and High Volume Node support offering a secondary target for reversal and continued upside.
Losing this and closing below would flip me bearish until a new bullish signal emerges.
Safe trading.

$SHIB Ready to Move?CRYPTOCAP:SHIB has printed confirmed weekly bullish divergence in RSI and is now attempting to overcome the weekly 200EMA resistance.
A High Volume Node lies just above but a close above this will signal a bullish trend ready to move the initial target of the weekly pivot point followed by the 0.0003579 High Volume Node.
Price completed its retracement to the 'alt-coin' golden pocket 0.786 Fibonacci retracement.
Bearish divergence is currently growing on the weekly RSI but will be diverted with a thrust high!
Is it MEME season? CRYPTOCAP:DOGE also looks ready to go!
Safe trading

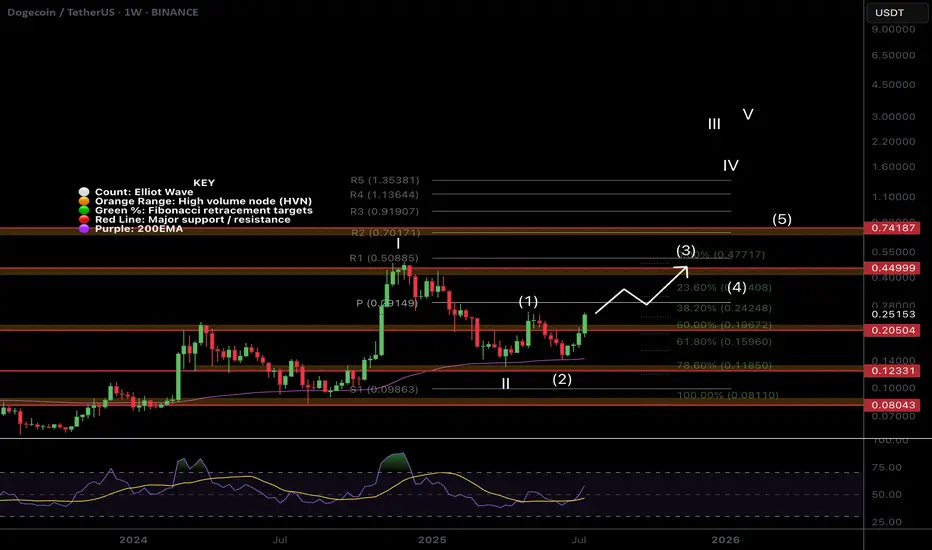
$DOGE Flipping to Bullish Structure!CRYPTOCAP:DOGE is coming to life after a second test of the weekly 200EMA as support and about to make a higher high, cementing in that higher low and flipping the macro structure bullish!
If the count is correct wave 3 of (III) should be powerful! The weekly pivot should put up a challenge as the first resistance before the High Volume Node at $0.45
Safe Trading
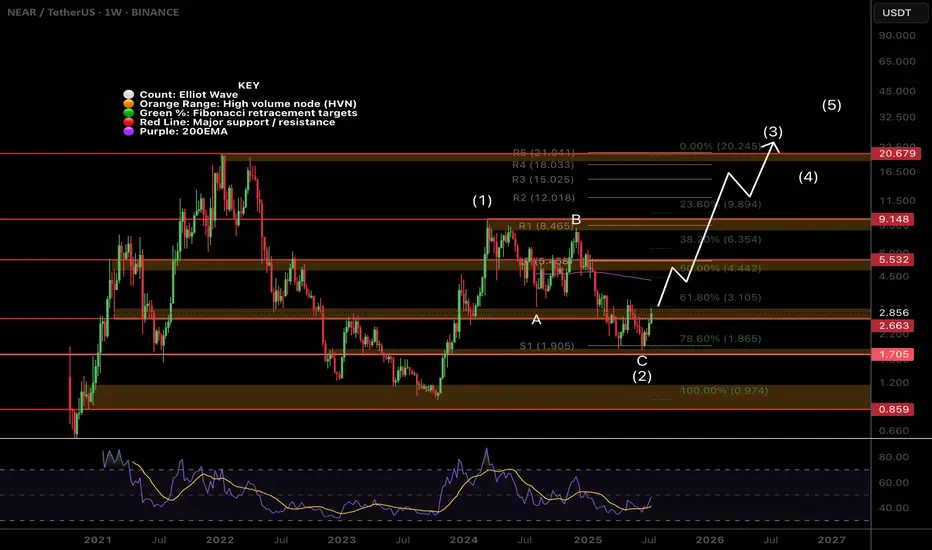
$NEAR Weekly TextBook Elliot Wave!CBOE:NEAR Weekly chart is a great demonstration of the text book motif wave followed by ABC corrective wave.
Bullish divergence has printed on the weekly RSI at the S1 weekly pivot support and the 'alt-coin golden pocket' 0.786 Fibonacci retracement. Price is closing in the major resistance High Volume Node.
The upside target is the newly printed weekly 200EMA followed by the weekly pivot and major resistance HVN just above $5.
A terminal target for this cycle may only see NEAR hitting all time highs around $21, the R5 weekly pivot point.
Safe trading
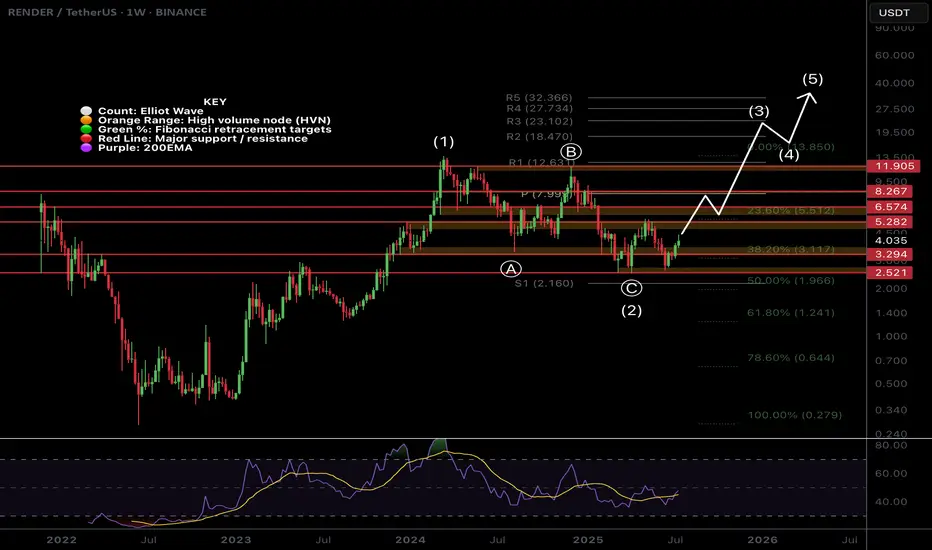
$RENDER Weekly Brings Clarity!CRYPTOCAP:RENDER weekly chart shows long term strength through the depth of the Fibonacci retracement not even reaching 0.5.
The depth of the recent swing low been so close wave (C) does concern me that the larger correction is not yet over and maybe price does want to visit the 'alt-coin' golden pocket of the 0.618-0.768 Fib retracement Where the would be a High Volume Node (not drawn).
For now the upside target is the weekly pivot but the local chart has a lot of work to do first with daily 200EMA!
Safe trading
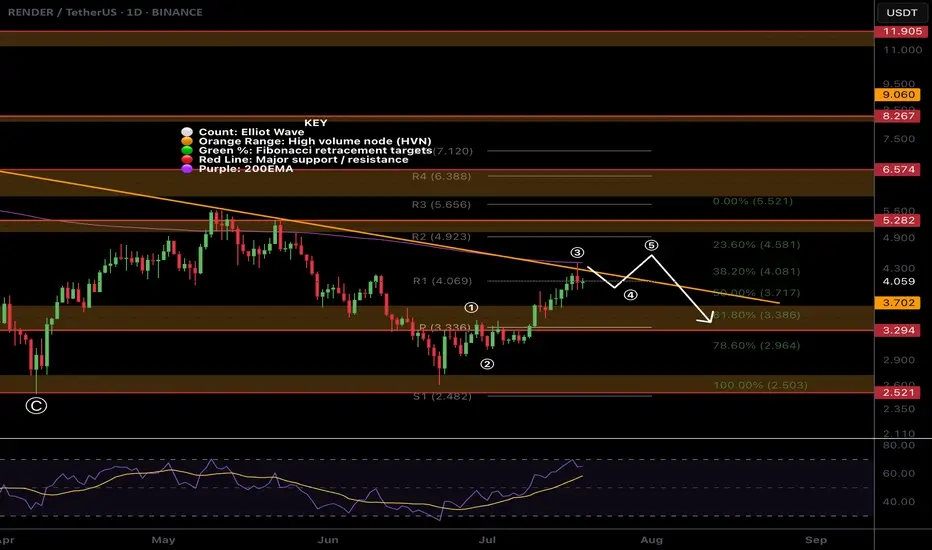
$RENDER At Major Resistance!CRYPTOCAP:RENDER has been relatively weak. Looking at the local chart it appears we have finished a wave (3) at the daily 200EMA and descending resistance.
Price has overcome the High Volume Node (HVN) support flipped resistance but a strong at coin pull could see fresh lows for Render.
There is also daily bearish divergence on the RSI.
The Elliot Wave count could also be an ABC corrective wave up which has now terminated.
If its a new motif wave and a major bottom has formed , wave 2 should find support at the HVN, daily pivot and 'alt-coin' golden pocket between 0.168 and 0.782 Fibonacci retracement
Safe trading
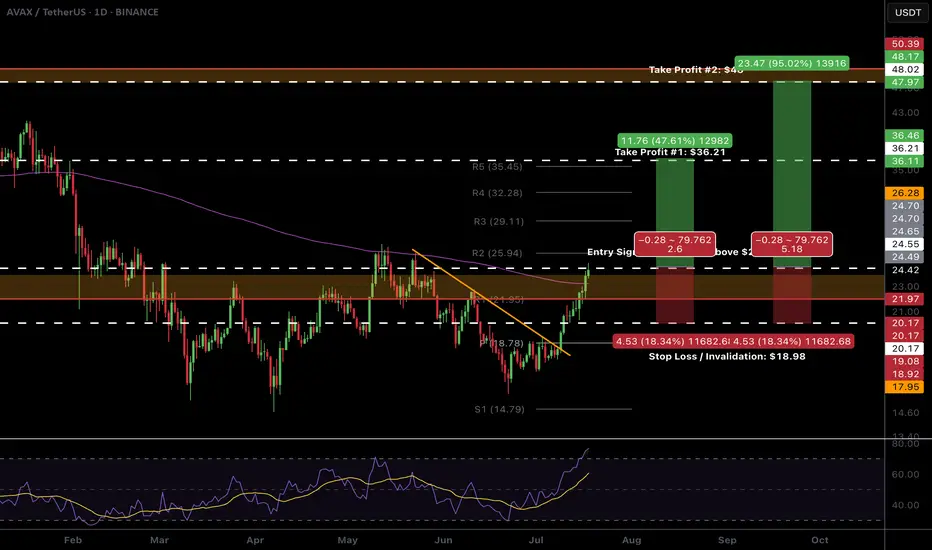
$AVAX Ready to breakout!CRYPTOCAP:AVAX looks ready to pop.
High Volume Node resistance and daily 200EMA is clear and now support. We don't want to see price rejected and moving back below this area.
The R5 daily pivot is my first partial take profit $35-36 followed by the major resistance High Volume Node at $48
Daily RSI is overbought with unconfirmed bearish divergence so watch out for this but should be good to run in the mean time. BTC permitting...
Safe trading
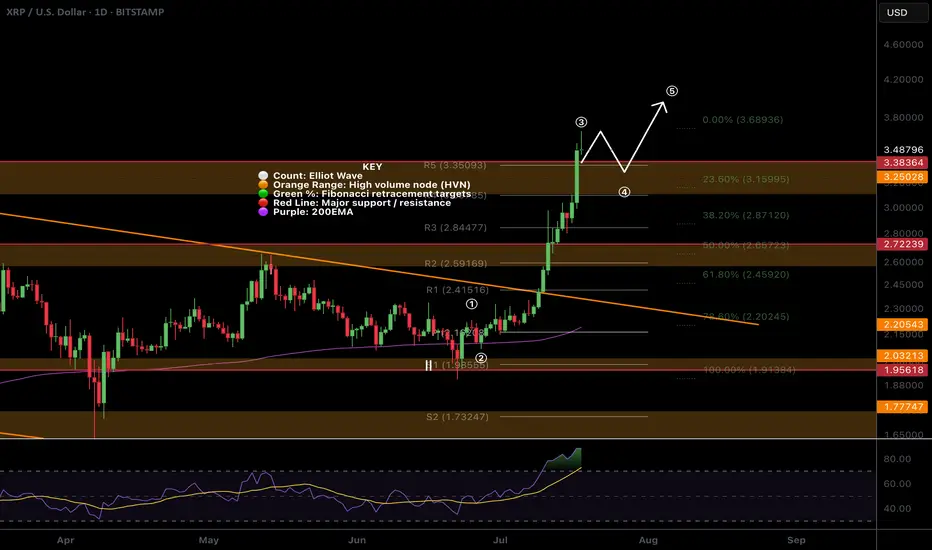
$XRP All time high! Time to sell or...?CRYPTOCAP:XRP appear to have completed wave 3 with a poke above all time high, typically this os behaviour of a wave 5.
The daily R5 pivot point has been breached so there is a significant chance of a decent pullback now but I wouldn't bet against the trend!
Wave 4 could be shallow, targeting the previous all time high, High Volume Node with waver 5 completing near $4.
Daily RSI is overbought but no bearish divergence yet which will likely emerge during wave 5.
Safe trading
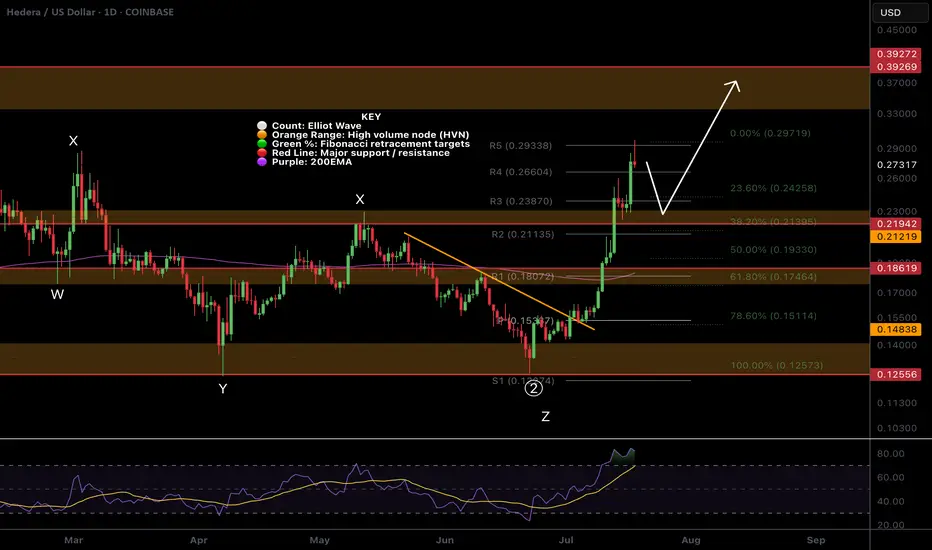
$HBAR Pull Back Started, What is the target?CRYPTOCAP:HBAR doing extremely well, the R5 daily pivot point has been hit and a pull back should be expected before continuation!
It appears wave 3 is now complete and wav4 i expected to pull back to the 0.382 Fibonacci retracement which adds confluence to the High Volume Node in the same place at $0.22 our previous take profit #2 target.
Daily RSI is overbought but no bearish divergence yet! Price behaviour can often pop above the swing high just made to trap new buyers before dumping hard! Watch out for that, that would be the bearish divergence print also.
The next take profit is $0.39
Safe trading
$XRP All Tie High After Shallow Pullback?CRYPTOCAP:XRP had a fantastic week smashing all resistances. I am looking for a shallow pull back to test the High Volume Node support at $2.7 at the .236 Fibonacci retracement before continuing to challenge the all time high.
Wave (3) of a motif wave appears complete adding confluence to a shallow retracement for wave (4).
Daily RSI is extremely overbought.
Safe trading

$HBAR Weekly Pivot Time...In classic CRYPTOCAP:HBAR fashion what a powerful move this week! Moves like this leave me skeptical of continuation straight away as you often get a pretty decent pullback afterwards before the next leg up. However how many times have you seen a move like this that completely unwinds weeks later and goes lower?
Wave (3) looks truly underway after wave (2) tested the High Volume Node and 'Golden Pocket' 0.50.618 Fibonacci retracement as support on weekly bullish divergence from the RSI.
The weekly pivot is now resistance and it already proving itself. If price continues the all time high is next resistance and price has a weekly R5 pivot target of $1.2 while the Fibonacci extension targets have a minimum of $5.2..
Analysis is invalidated below $0.12
Safe trading

$FET Does Zooming out look better?NYSE:FET has been underperforming lately and the local chart looks trash so I wanted to zoom out to give us all some context on the larger picture which hasn't really changed.
Price appears to have completed wave II at the High Volume Node (HVN) support and 0.5- 0.618 'Golden Pocket' Fibonacci retracement and wave 3 is underway but finding local resistance.
Pivots are warped due to the strength of the move last year so wouldn't count them as reliable so focusing on support and resistance. The megaphone pattern is clear and the next area of resistance when FET starts moving is the $1.2
Weekly RSI is decreasing and is attempting to cross bearishly. If Bitcoin has a significant pullback I would expect new lows for FET at this rate. I have a neutral stance at this point.
Analysis is invalidated below $0.546
Safe trading

$ETH Pullback to $2630 Support?CRYPTOCAP:ETH has a great week pushing through resistance and making new local highs after testing the daily 200EMA and daily pivot as support.
Price is likely to retest the swing high and previous resistance as support around $2600-2700, also the .382 Fibonacci retracement.
RSI is printing daily bearish divergence in overbought from the wave (3) top to current as it did at the wave (5) top seeing large rejection. The retest of $2600 would reset RSI.
Price is ultimately set to test $3600 as the next resistance if the Elliot wave count is correct.
Analysis is invalidated below $2050
Safe trading

$AAVE Macro outlook Grinding the PathCRYPTOCAP:AAVE continues to grind higher poking above the swing high which was rejected to test the weekly pivot and .382 Fibonacci retracement as support successfully. This was a shallow wave 2 so I am expecting a big thrust up in wave 3. However, the alternative count could suggest a wave is only completing now with wave 2 actually being wave (4) of 1, this would be the case if price falls back below $171.
Weekly RSI is still bullish with plenty of room to rise ahead of it. It printed a weekly bullish divergence at the wave II low and major support high volume node.
AAVE is definitely one too watch this cycle.
Safe trading

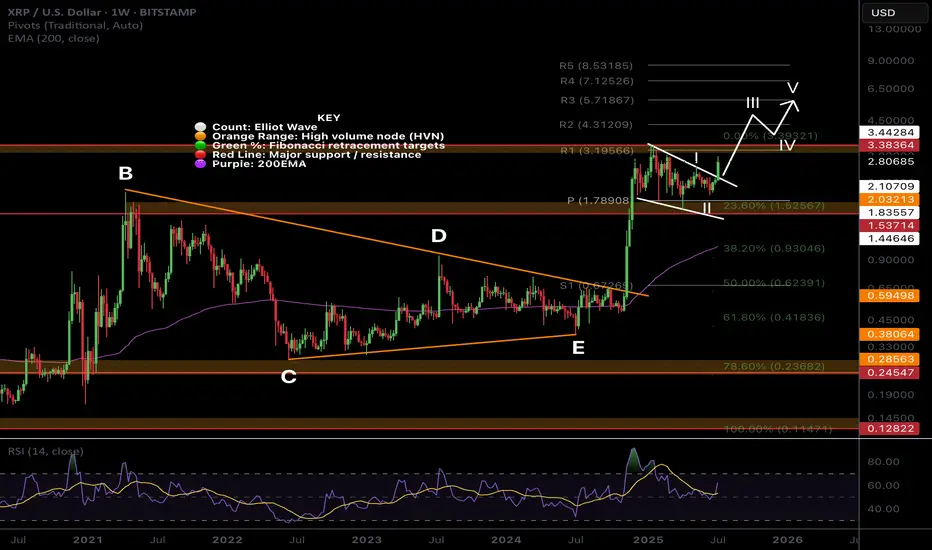
$XRP Macro Tiangle Final Thrust ContinuationCRYPTOCAP:XRP completed a macro triangle pattern last year. Triangles proceed a terminal motif wave which already completed a wave 3.
Wave (3) of (5) is underway with a terminal target around $5.7 after price broke out of the pennant / wedge pattern.
Weekly RSI confirmed bullish divergence.
Safe trading
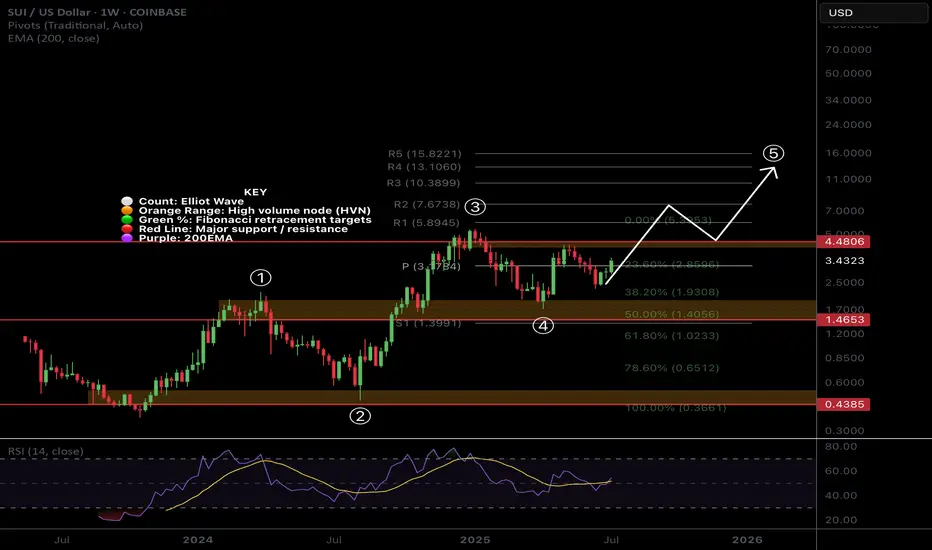
$SUI Wave 3 to Continue with a Strong Weekly CloseCRYPTOCAP:SUI printed a great weekly candle that will be closing today above the weekly pivot point with RSI trying to flip bullishly.
Price found support at 0.5 Fibonacci retracement and High Volume Node.
Wave 4 penetrated wave 1 which we potentially have a ending or leading diagonal Elliot Wave count limiting the potential upside with my current terminal target being around $10-13. Wave 4 could also actually be another wave 2 which would give us ridiculous targets but this is my preferred count for now.
Safe trading
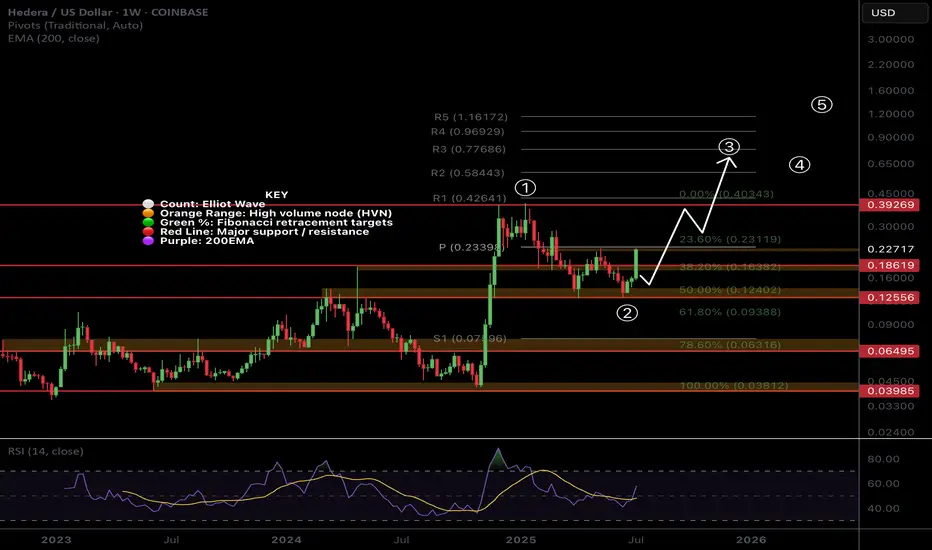
$HBAR Shooting Up in Wave 3CRYPTOCAP:HBAR is flying off the High Volume Node and 0.5 Fibonacci retracement with Elliot wave 3 characteristics keeping the count alive.
Price is testing the weekly pivot point which should act as resistance for the time being but a break straight through will demonstrate a very bullish trend. Traders should be cautious about entering here.
RSI confirmed a weekly bullish divergence
Safe Trading
ETH Hits $3K — Next Stop: Moon or Pause?ETH just tagged the psychological $3 000 barrier after a sharp impulse, printing a fresh higher high inside its rising channel.
🧠 Game plan:
1️⃣Pullback zone: The orange structure area at $2 550 – $2 700 aligns with the channel’s lower trend-line — a prime spot for bulls to reload.
2️⃣Continuation trigger: A clean 4H close back above $3 000 turns the level into support, unlocking the path toward $3 100 (first target) and potentially higher into the summer.
3️⃣Invalidation: A decisive break below the channel would neutralise the setup and shift focus back to the macro support near $2 400.
Until then, every dip toward the orange demand is a gift in this bullish structure. Trade the plan, not the noise.
📚 Always follow your trading plan regarding entry, risk management, and trade management.
Good luck!
All Strategies Are Good; If Managed Properly!
~Richard Nasr

$ETH clear for an impulsive move to $3600?CRYPTOCAP:ETH has slowly but surely cleared resistance, with just the swing high to tackle which will activate another trade signal in my Trade Signals Substack.
Major support High Volume Node, daily pivot and daily 200 EMA proved tough support and demand continues to come in.
ETFs had an astonishing amount of inflows yesterday at $200M+
Analysis is invalidated below $2100
Safe trading
