BTC: could this be it? It might be too early to tell, but this could be the top. Strong divergence in Weekly chart, but would only be confirmed if we breakdown the support levels as price can potentially push up into failure. Just a caveat, I can easily be wrong here.
Seasonality
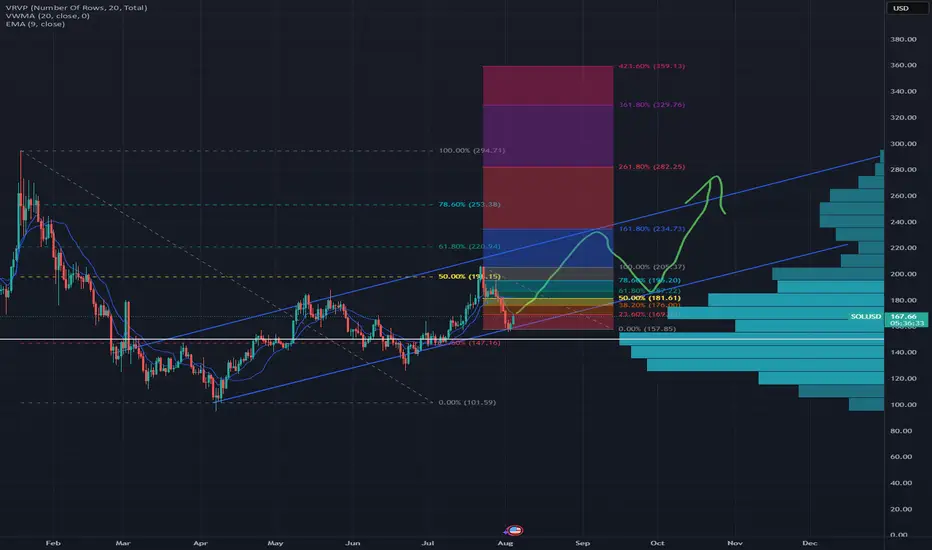
On our way to a new ATH for SOLUSD?This is a possible scenario idea I have in mind for SOLUSD that I want to share with everyone.
Keep in mind that this is not an advice to buy, it should be your decision to buy this specific asset.
There are 4 reasons I am thinking that we are (still) on our way to a new ATH for Solana and why I am extremely bullish on this specific crypto asset:
1. The orange man is pushing the FED for rate cuts for weeks: there already are some numbers (f.e. low inflation) out there that this might happen THIS week!
2. There is enough volume on 150$ & 170$ levels. We will are still on our way up!
3. The common crypto cycle is still happening: BTCUSD have bounced perfectly from the 112$k level and continued to move up, whales and other big guys are still buying BTCUSD at this time which is very bullish (another ATH is inevitable!) -> if the cycle repeats itself, BTCUSD will probably crash afterwards just like previous cycles -> this will be followed by a new ATH for ETHUSD -> after that, SOLUSD will be the next one to set a new ATH afterwards, just like back in Q4 2024 & Q1 2025. The higher ETHUSD will go the better it will be for alt coins like our baby Solana.
4. Solana is not even close to its former ATH: stepping in right now, will make larger profits later.
5. Last but not least: ETF approvals are still on the way!
The ATH I have in mind that will be set for Solana will be between 400$-600$ or with some luck, even higher.
Some people might not be happy in the way SOLUSD is performing right now, but I only learned one thing: that patience makes money when it comes to crypto. For everyone that is thinking about stepping in, I think there is still time to make profit from here on (but then again, of course at own risk, at all times!).
Another thing I want to add to this idea is to watch out for the first retracement/resistant level: this might be around 225$-234$ as shown in this Graph. Because there was more selling volume in Q1 2025 at that level.
Hope you liked my idea & graph about SOLUSD. Good day and happy trading everyone!
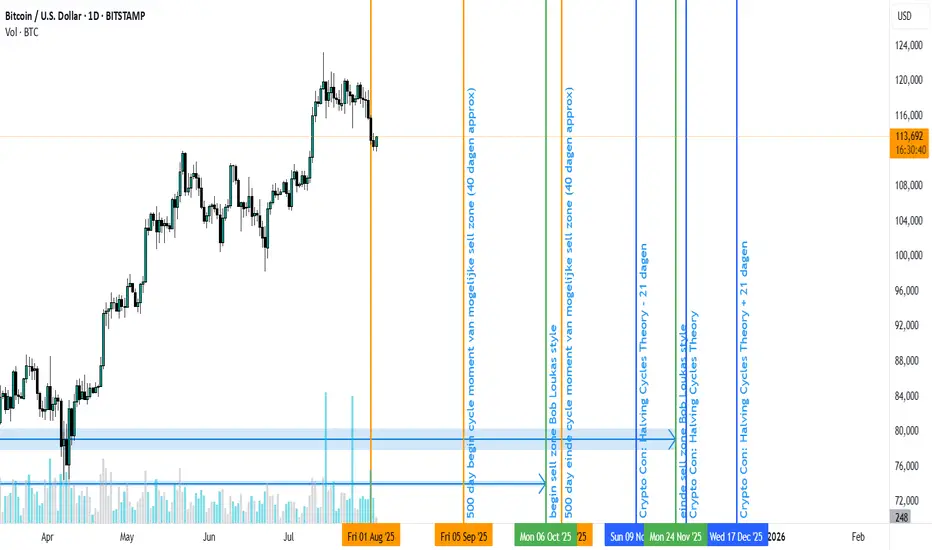
Next crypto/btc top timeframe according to different sourcesAccording to different sources the timing of the next crypto/btc top, could be as early as september 5th. See this chart for the different timeframes.
My current guess, if we get a rally towards $150k+ would be september/oktober.
BTCUSD – Is the Correction Over? Key Support Holding so FarLast week was a red one for Bitcoin, with price declining day after day, and losses accelerating into Thursday and Friday.
However, yesterday’s low around 112K landed perfectly at a strong confluence support: a key horizontal level aligned with the ascending trendline from April.
Despite the drop, the broader structure remains firmly bullish. So far, this move looks like a normal correction within an uptrend — nothing more.
Looking ahead, I expect a reversal from this support. If bulls can reclaim the 117.5K–118K zone, the path toward a new all-time high opens up again.
🔍 Bias: Bullish
🎯 I consider this current level a good swing trade opportunity, with at least a 1:2 risk–reward potential.

Nasdaq US100 Wave 3 Expansion Toward 31,606 in PlayNasdaq US100 has completed a significant wave cycle with a confirmed wave 1 in the broader Elliott Wave structure. Following this, price underwent a corrective wave 2 that extended from the $22,237 supply zone down to $16,334, marking the conclusion of the previous cycle’s correction. This structure now signals the initiation of a fresh upward impulse, setting the stage for a powerful wave 3 advance.
The emergence of wave 3 will gain full confirmation once price successfully breaks above the external supply zone, reclaiming $22,237. If this breakout occurs with sustained momentum, the wave 3 projection targets an expansion toward $31,606, which aligns with the 161.8% Fibonacci extension from the prior cycle. This forthcoming rally is anticipated to unfold in a five-subwave format, indicative of a high-momentum bullish leg.
As long as price action remains above the key support at $16,334, the bullish cycle remains valid. All eyes should now be on the breakout structure and volume profile around $22,237, as it represents the gateway to a much broader impulsive move.

JPY at Key Zone – EURJPY & GBPJPY Could Drop 1k+ PipsExactly one year ago, the JPY Currency Index broke above the falling trendline of a falling wedge, signaling the end of a bearish cycle that had lasted nearly five years.
As is typical after long-term reversals, the reaction was sharp and fast, and the price quickly reached the first resistance target of the pattern.
Since then, the index entered a lateral phase, with clear support forming around the 730 zone.
________________________________________
🔍 Current Price Action
Recently, the price pulled back to test that same support, and at the time of writing it sits at 737, forming a tight consolidation.
This suggests we’re again at an inflection point.
________________________________________
📊 Trade Outlook
From a medium-term perspective, I believe the index is preparing for another leg higher, potentially toward resistance at 780.
➡️ That would mean a 7% rise on the JPY Index – and this move could translate into more than 1,000 pips of downside for pairs like EURJPY and GBPJPY.
________________________________________
🔄 What’s Next?
In the coming sessions, I’ll focus on these two pairs as they offer the clearest setups and have the strongest volatility.
Stay tuned — follow for the next updates. 🚀

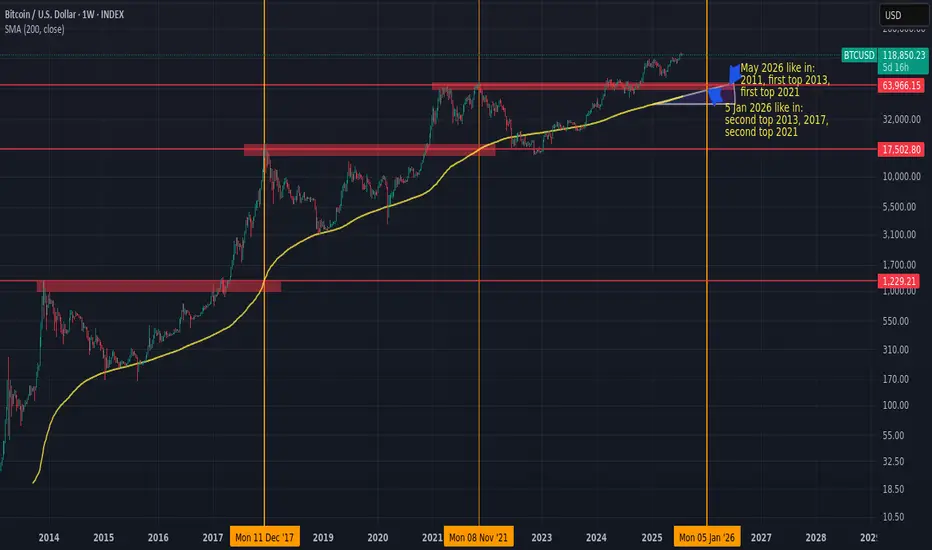
Next BTC topHistorically, BTC/USD has tended to peak when the 200-week simple moving average (200W SMA) approaches or crosses the high from the previous market cycle.
If this pattern holds, and assuming the 200W SMA continues rising at its current pace, the next top could occur sometime between January and May 2026.
If BTC accelerates earlier, the moving average would steepen, potentially shifting the timing forward.
Something worth watching to manage risk and position sizing accordingly.
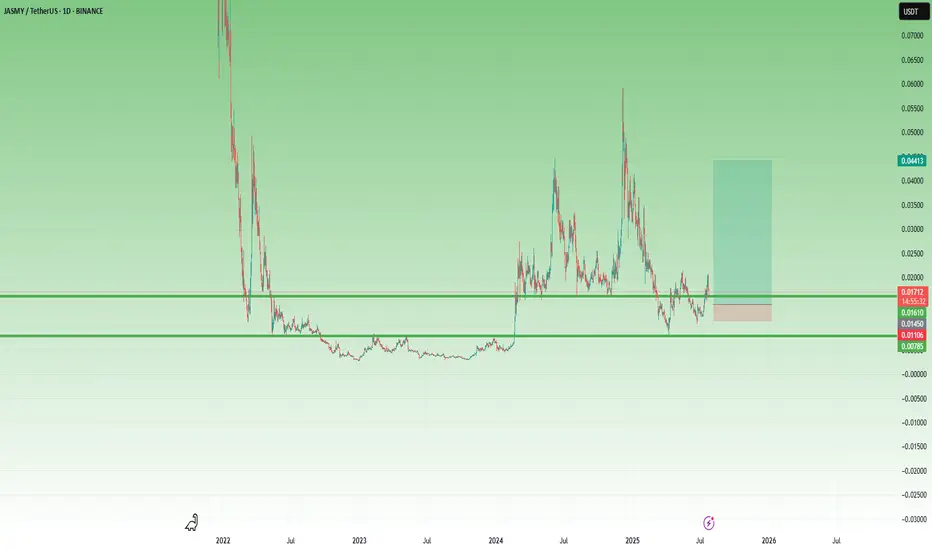
JASMY – A Volatile Setup with x3 Potential 🔸 After bottoming out at 0.003 and spending over a year in accumulation, JASMY finally broke above the key 0.008 resistance zone in February 2024. That breakout triggered a series of explosive moves – but just as violent were the drops that followed.
🔸 What stands out:
• The first post-breakout spike found a new support at 0.015.
• Then came a second vertical move toward 0.06, followed (of course) by a brutal drop.
• But… 0.008 held, and by late June, the chart printed a higher low, showing that buyers became interested.
📍 Right now, the price has reclaimed the 0.015 zone and is trying to stabilize above it. If this level holds, it could become the new base for the next wave.
💡 My plan?
This is very speculative, but I like the setup.
I’m looking to buy around 0.015–0.016, with clear negation below 0.010.
Target? Around 0.045, for a potential x3 move and a tasty 1:8 risk/reward.
⚠️ I’m not the guy who repeats the cliché “ only trade what you can afford to lose, ”
but seriously – this one is for clubbing money, not summer vacation money.
Let the volatility work in our favor. 🚀
XAU/USD – Ranging Market Prepping for Breakout?Gold has been ranging for the next couple months and usually I am out of the market during the months of April Through July because historically these are not my best months trading XAU/USD. However you will see me posting a lot more in the coming months because my best months historically are August - December where the market really cranks up with some bigger moves.
So in a summarized version below you will find what it is that i am looking at with gold.
Gold (XAU/USD) has remained locked in a defined consolidation range between 3,250 (support) and 3,450–3,502 (resistance) since early April. Price has printed multiple internal falling wedge formations within this zone, indicating compression before potential expansion.
🔍 Technical Overview
Range Duration: ~3.5 months
Key Range:
Support: 3,250
Resistance: 3,450–3,502
Compression Patterns: Multiple falling wedges breaking upwards inside the range, hinting at bullish pressure.
Touch Confirmations: Both range boundaries have been tested multiple times, reinforcing validity (per Multi-Touch Confirmation).
Contextual Bias: Seasonally, August–December tends to be a high-volatility trending period for Gold.
🎯 Trade Plan
Inside Range:
Maintain neutral bias.
Execute range-to-range scalps/swing setups with clear invalidation zones.
Avoid trading mid-range.
Breakout Scenario (Bullish):
A clean close above 3,502 triggers breakout watch.
Ideal setup: Retest + 15-min flag → long continuation.
Potential upside target: ~3,700 (range height extension).
Breakdown Scenario (Bearish):
Loss of 3,250 opens door to bearish continuation.
Look for clean liquidity sweep or structure flip before committing.
Initial downside target: 3,100 zone.
🛡️ Risk Notes
Avoid third-touch entries in aggressive momentum unless followed by flag formation.
Remain disciplined with the 80/20 confluence rule — don't let perfectionism delay entries.
Always execute with pre-trade checklist and defined R:R profile.
✅ Summary
Gold is at a pivotal point. The confluence of a tight multi-month range, internal compression patterns, historical breakout timing, and validated levels builds a compelling case for an imminent expansion move. Remain patient, avoid anticipation, and react to confirmed structure and price behavior.

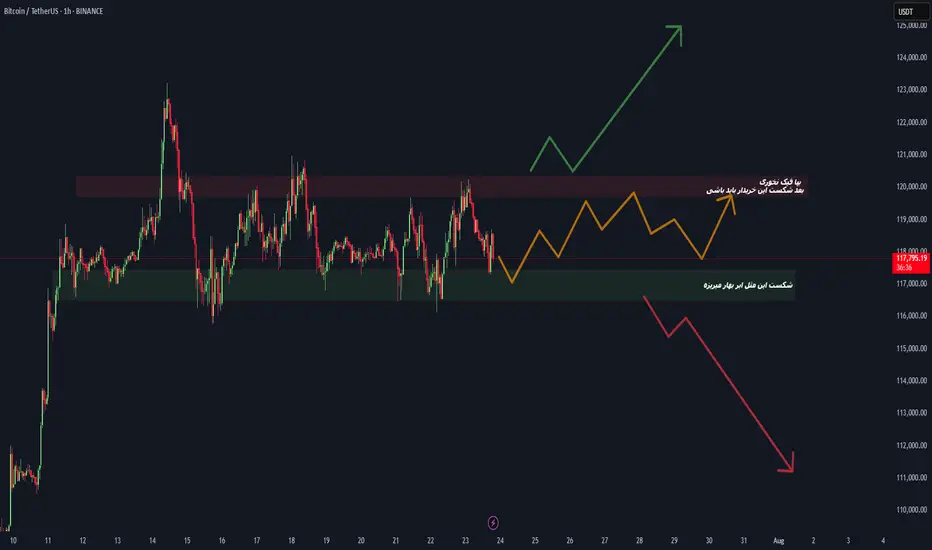
BTC at Make-or-Break Level! Which Side Are You On?#Bitcoin #BTCUSDT #CryptoTrading #TradeWithMky
📉 Scenario 1 – Bearish Breakdown
If BTC loses the green zone (~117K), expect a heavy drop toward 113K and beyond. This is a key demand zone — break it, and bears dominate.
📈 Scenario 2 – Bullish Reversal
Watch for accumulation between the green & red zones. A breakout above the red supply zone (~119K) will signal buyers are back in charge.
🗣️ As the chart says: "بیا فیک نزن، بعد شکست این محدوده باید بخری!"
🚀 Whether you're a breakout trader or a range player — this is the zone to watch.
📊 Chart by TradeWithMky — Where Altcoins Speak Louder than Bitcoin!
👇 Share your thoughts and setups below! Let's ride this move together.
Bonk USDT Buy / Long SetupBonk performing well among all meme sectors, wait for the entry and take risk, if tp hits first then ignore. I already shared this setup on my group, we closed the trade at minor profit, but now this is showing strong momentum on 1hr tf also, that's why sharing.

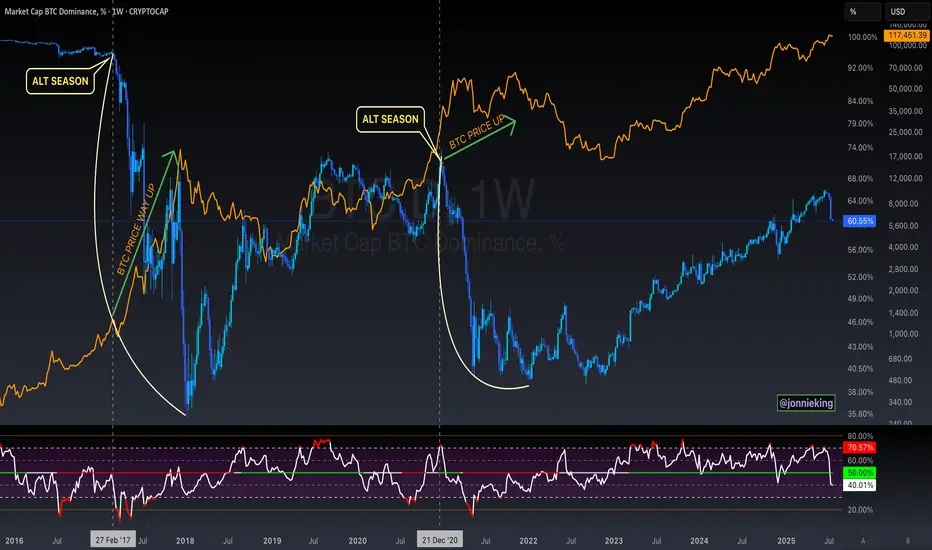
$BTC Will Go Up Alongside Alt SeasonSomeone posted on one of my tweets the following:
" Jonnie my bro, the only problem for me right now is that btc didnt top yet. You also talked how btc shoud top around 200k range. Alt season can only come when btc reach top"
MYTH DEBUNKED ✅
CRYPTOCAP:BTC does NOT need to top in order for Alt Season to commence.
Both can and will occur in tandem 🤝
SPY: Climbing the Wall of Worry — But Is a Turn Coming?SPY: Climbing the Wall of Worry — But Is a Turn Coming?
The S&P 500 (SPY) is pushing into a critical zone as we approach July 28th, and I can’t ignore the confluence of signals piling up here.
Technical Setup
We’re testing the top of a rising wedge formation.
Key round number overhead at $640 — a psychological and options magnet.
Price is extended well above moving averages with declining volume, often a warning sign for bulls.
Multiple resistance lines converge in this zone, creating a high-pressure point.
📆 Timing Matters
July 28 = weekly options expiry — with massive open interest clustered around $630–$640.
Seasonally, late July often marks a peak before August chop.
Add in some “tin foil hat” vibes: SPY’s riding momentum while major indices are diverging (looking at you, IWM), and the macro narrative feels shaky at best.
What Would Confirm a Reversal?
Breakdown below $625 with a high-volume red candle.
Bearish engulfing or shooting star candle near resistance.
VIX divergence or big money flowing into puts mid-week.
Key Levels
Resistance: $640 / $649.90
Support: $630 / $622 / $595
Reversal target (if confirmed): $594–$575 area
Final Thoughts
As we all know, markets can stay irrational longer than you can stay solvent. However, when trendlines, round numbers, timing, and seasonality align, I start watching for cracks. This may not be the top — but it might be the spark.
Following closely. Alerts set. Ready for the flush if it comes.

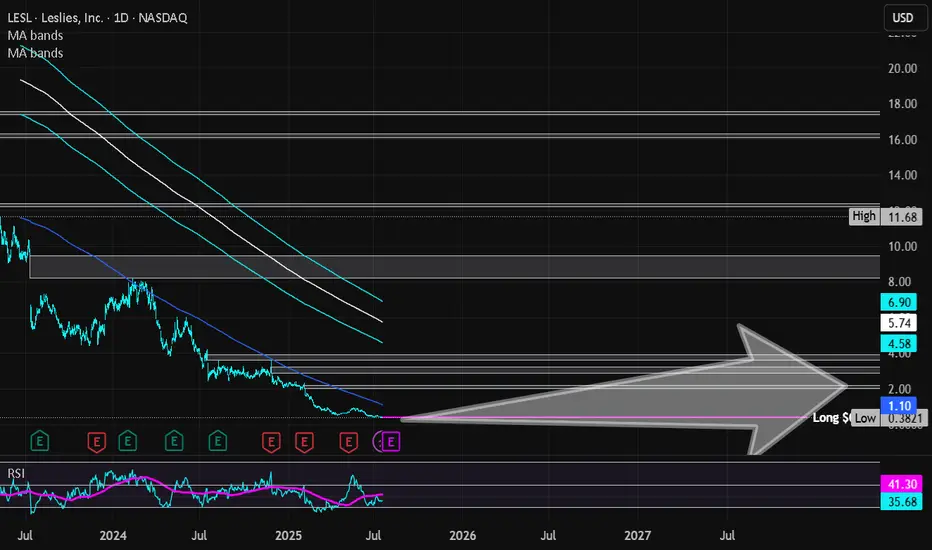
Leslies Inc | LESL | Long at $0.41**VERY risky trade - 25% or more risk of bankruptcy**
Leslies NASDAQ:LESL is a direct-to-consumer pool and spa care brand in the U.S., selling chemicals, equipment, and services. The stock dropped 88.86% last year due to weak demand, flat revenue, shrinking gross margins from stock write-downs, higher rent, shipping costs, and an earnings miss (-$0.25 vs. -$0.244). High debt, market share losses to e-commerce, and a competitive pool supply market also contributed.
On a positive note, the company generated $1.33 billion in revenue for fiscal year 2024. New leadership has entered the picture, cost-cutting is starting to happen, and summer season may boost pool sales. While 2025 is still projected to be a rough year, revenue is forecasted to grow 6.4% in 2026 and 2027 and earnings are likely to turn positive (based on company statements). While this is a *highly risky* play and there are absolutely better companies out there, I think there is a chance this ticker may get some steam in the near future. 7% short interest, 176 million float.
Thus, at $0.41, NASDAQ:LESL is in a personal buy zone.
Targets into 2027:
$1.00 (+143.9%)
$2.00 (+387.8%)
Bitcoin monthly RSI CYCLEEvery time Bitcoin peaked in previous cycles, its monthly RSI exceeded 90. In this cycle, the RSI hasn't surpassed 75, but I expect a breakout through 75 to at least 86 in the coming months.

DOGE | Gearing up For a BIG MOVEDoge is looking mighty bullish after establishing a clear bottom.
Together with confirmation from BTC, we can safely say that altseason is yet ahead of us. BTC's recent increase show that the bullish impulse is still upon us. And after ETH increases, the rest of the altcoin market will follow suit as per usual.
DOGE is bullish because:
✅ Clear bottom
✅ Higher lows, daily looking to reclaim the moving averages:
✅ Altseason upon us after ETH increase
Ultimately, we need to wait for confirmation - if THIS major resistance zone is cleared (in other words if daily candles close ABOVE this zone) then we're full bull mode.
________________
BINANCE:DOGEUSDT

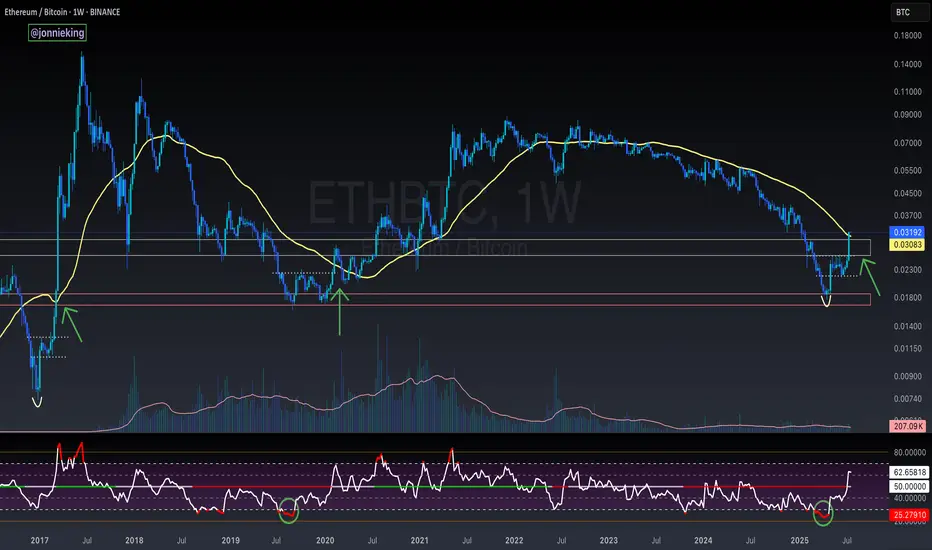
$ETH Closes Above the 50WMA - Alt Season Signal ALT SEASON ALERT 🚨
CRYPTOCAP:ETH Closed the Week ABOVE the 50WMA
Historically this has signaled the start of ALT SEASON.
*NOTE* 2020 had the pandemic hiccup.
This bottoming pattern looks very similar to the 2017 explosion.
Also the RSI matches the 2019 bottom.
Dare I call it yet bros? 🤓
ALtseason-2025: where to exit?I have 2 metrics when I'm going to exit the market (with my profit):
1. When BTC.D falls to 40%;
2. When (Total3-USDT)/BTC = 1, in other words, when the amount of money in the altcoins is almost equal to the amount of money in Bitcoin and Ethereum.
When you see it happen, sell everything and exit the crypto market.

Ethereum (ETH) – Strategic Trade PlanEthereum (ETH) continues to show resilience, currently trading around $1,790 after a strong bounce earlier this month. While the crypto market remains volatile, ETH is holding key technical levels that could fuel a major move in the coming weeks.
🎯 Entry Points:
Market Price: $1,790 — Ideal for an early position, as ETH holds above critical support zones.
$1,645 — Secondary strong support, aligning with the 20-day EMA; great for scaling in if market pulls back.
$1,400 — Deep value zone, offering a high-risk/high-reward setup if broader market correction occurs.
💰 Profit Targets:
$2,500 — First major resistance. A realistic mid-term target if bullish momentum sustains.
$3,000 — Psychological milestone and breakout confirmation level.
$3,800+ — Ambitious but achievable with broader crypto market recovery and strong ETH network metrics.
🛡️ Risk Management:
Set stop-losses dynamically below each entry support level.
Scale into positions progressively to manage volatility.
Monitor macroeconomic trends and Bitcoin's influence closely.
🔍 Key Observations:
Strong on-chain activity supports a bullish thesis.
Current resistance around $1,812 must be broken to confirm bullish continuation.
Be cautious of sudden market-wide corrections — always plan your exits and manage your risk accordingly.
📢 Disclaimer: This is not financial advice. Trading cryptocurrencies involves significant risk, and you should only invest what you can afford to lose. Always perform your own research before entering any position.

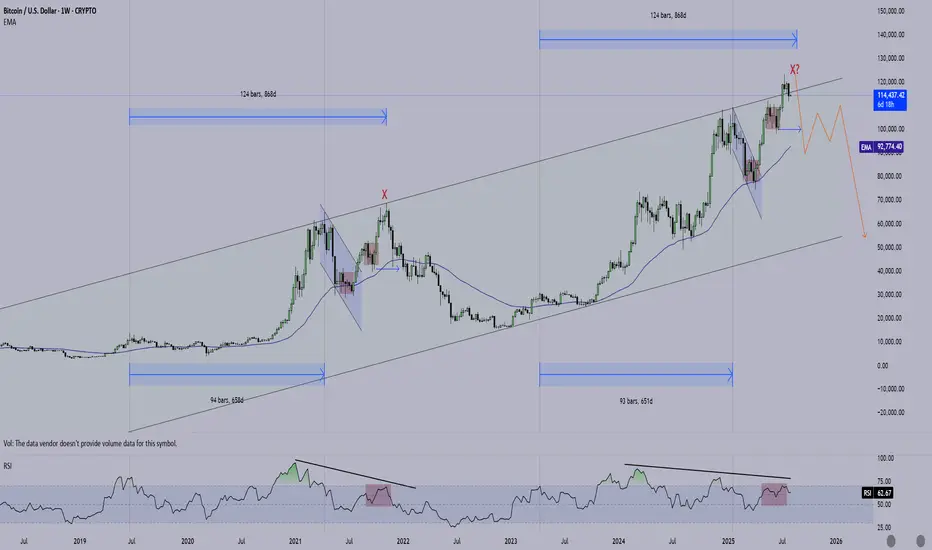
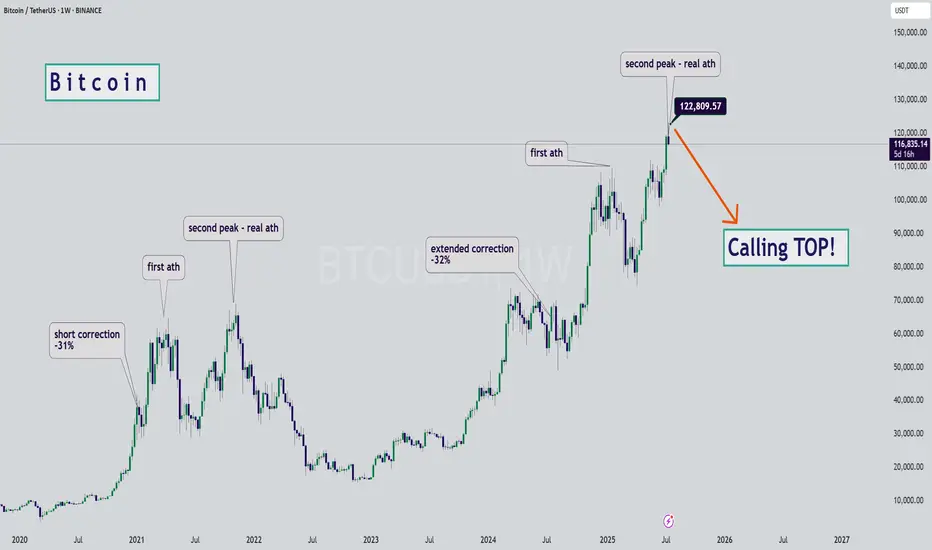
BTC - Calling the Start of the Bearish SeasonHello Watchers ☕
This was my previous Bitcoin update where I had a target of $116K, and also then closed all open positions at $122K:
I'm calling the top here mainly because of the way the chart looks, it really is classic Wyckoff if you look at the duration of the current bullish cycle, which has lasted a whole 973 Days with a 564% increase. What goes up, must come down!
Just for interest sake, the previous bullish cycle ran for 600 days with a 700% increase.
The Final Turn Before the Altcoin RotationAs Bitcoin continued its rise, altcoins couldn't keep up. This isn't the first time; the market has experienced this many times. The general pattern is as follows:
1. Global liquidity increases, providing a kind of spark to the market.
2. Bitcoin catches fire, and a bull market begins. If global liquidity increases during this time, great.
3. For various reasons, altcoins don't rise at the same pace as Bitcoin, and therefore Bitcoin's dominance begins to gradually increase.
4. When the market reaches saturation, dominance declines, leading to a rotation into altcoins.
5. The altcoin market capitalization equals Bitcoin's, and the bull market begins.
We're currently at a stage where Bitcoin's dominance has peaked and liquidity is still rising. The beginning of a decline in dominance will trigger a market rotation. This will trigger a capital flow into altcoins, bringing their market value equal to Bitcoin's.
Therefore, we're at the final plateau before entering a bull market. A further rise or hold in Bitcoin is expected. I'm currently buying altcoins, but I'm holding Bitcoin. I don't have a sell mindset at the moment.
BTC bullish sentiment and All time highs?BTC is printing a good structure and characteristics resembling the highs of 2021. 2025 is the only bullish year left before BTC crashes again.
Usually BTC is bullish in the end of the year. This OCT/NOV could print 130K-136k for btc before a fatal crash

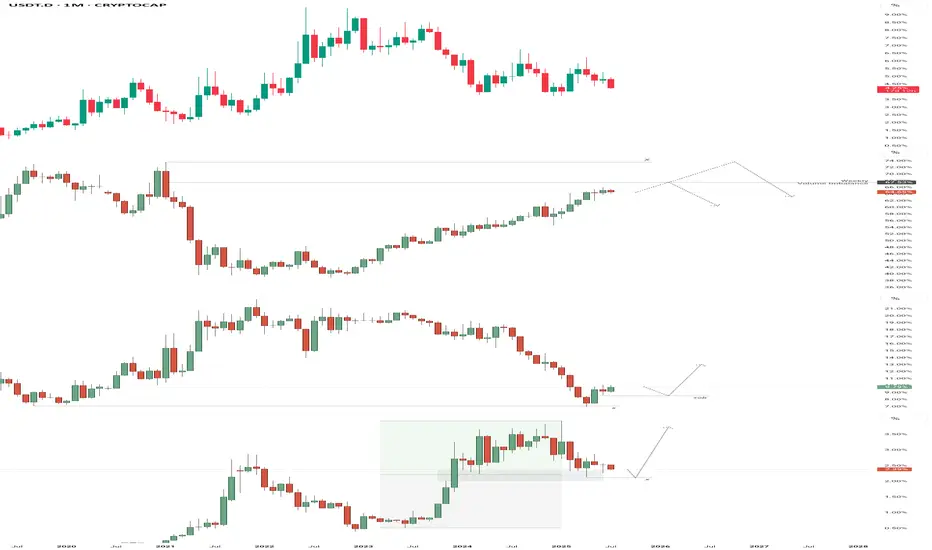
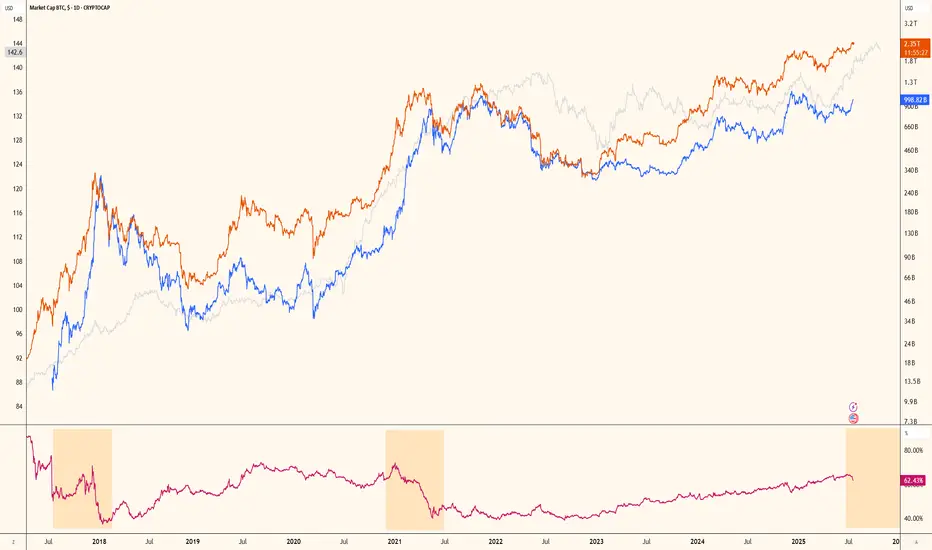
Capital Flow Outlook – BTC Leads, Alts Await a SignalOver the past two quarters, Tether's (USDT) market cap has expanded by over 66%, rising from ~$95B in late 2024 to ~$159.5B by mid-July 2025. This confirms a strong capital injection into the crypto space — reminiscent of early bull market cycles.
But where that capital flows tells the deeper story:
USDT.D is in a clean downtrend, showing that capital is actively rotating out of stables — a risk-on signal.
BTC.D continues climbing, confirming Bitcoin as the primary recipient of inflows. While the current move hasn’t reached exhaustion, the nearest potential reversal point is the weekly volume imbalance at ~67.5%.
Should that level fail to trigger a reaction, the next major reversal zone lies near 73% — the last known macro ceiling for dominance.
ETH.D has shown a structural shift, bouncing from a key macro low with a clear Change in State of Delivery (CSD). A revisit to the April high around 8.55% is looking increasingly likely.
SOL.D is fighting for structure, having reacted to a mid-point imbalance situated in the discount zone. This positioning is favorable for buyers, but structurally it still leans toward sweeping the April low at 2.13% before a valid CSD can form.
---
🧠 Conclusion:
While capital is clearly flowing back into the market, Bitcoin remains the primary destination. Until we see:
A reaction or rejection at BTC.D reversal zones
ETH.D continuing upward toward prior range highs
And SOL.D confirming a structural shift from discount
...a full altseason expansion remains premature.
> The capital is here — but the rotation isn’t.
Altseason is still brewing — and could take the rest of the year to fully materialize.
— Silent Edge