July Seasonality Patterns For Index, Metals and ForexSeasonality can be a useful tool if used wisely (and in context) with current sentiment and news flows. Seasonality really is a backwards looking indicator that can easily be overpowered by key macro drivers. But its strength comes in to play when seasonality aligns with the macro landscape.
With that in mind, I share my seasonality matrix for indices, metals and USD FX pairs to highlight potential patterns for July, then wrap up with an update on my Nasdaq 100 analysis.
Matt Simpson, Market Analyst at City Index and Forex.com.
Seasonality-trading

USDJPY Potential DownsidesHey Traders, in today's trading session we are monitoring USDJPY for a selling opportunity around 143.200 zone, USDJPY is trading in a downtrend and currently is in a correction phase in which it is approaching the trend at 143.200 support and resistance area.
Trade safe, Joe.

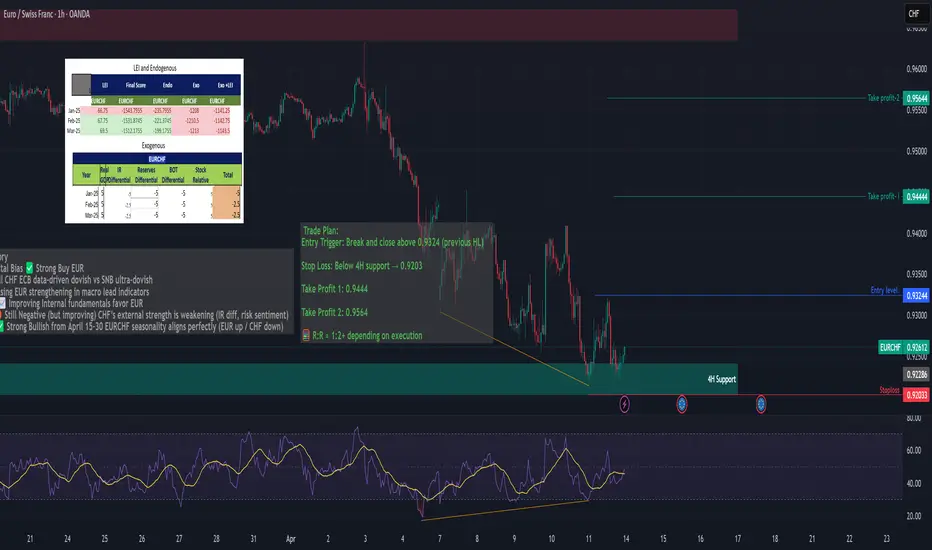
EURCHF – Bullish Reversal Setup + Fundamentals Trade Idea Summary: EUR/CHF showing strong bullish confluence:
✅ Bullish RSI Divergence on both 1H & 4H
📉 Price testing a key 4H support zone
📊 Seasonality favors EURCHF upside (bullish from April 15–30)
🧠 Fundamentals, COT, LEI + Endogenous indicators support long EUR / short CHF
ECB: Dovish but stable, EUR fundamentals improving (LEI ↑, Endo ↑)
SNB: Aggressively dovish, low inflation, weak CHF outlook
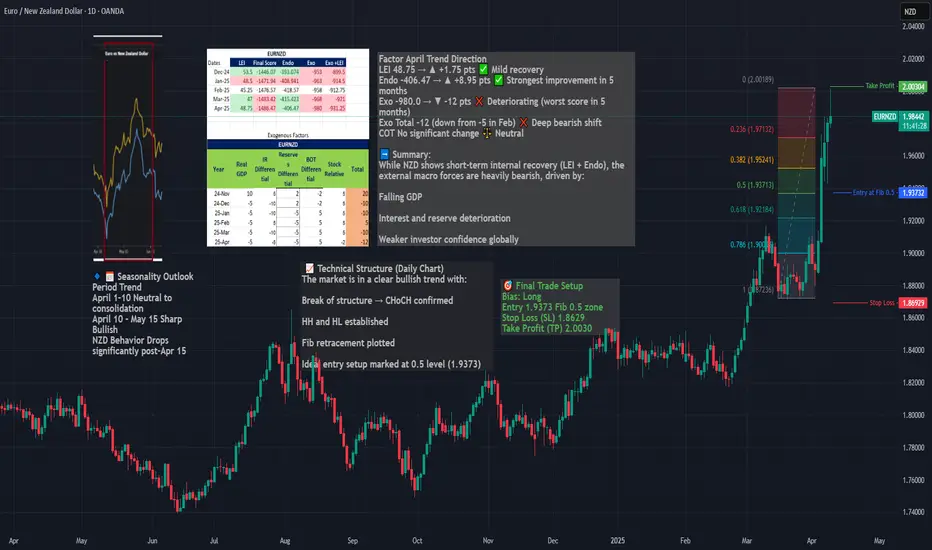
Long EURNZD – Seasonal, Fundamentals & Technical ConfluenceWe are entering a long position on EURNZD, capitalizing on a powerful confluence of:
Seasonal EUR strength + NZD weakness (April 10 – May 15)
A clear bullish market structure (CHoCH, HH/HL)
A clean Fibonacci retracement entry at 0.5
Strong macro divergence, with NZD exogenous conditions deteriorating
Macro & Seasonal Context
EUR enters a strong seasonal uptrend from April 10 to end of month
NZD shows seasonal weakness from April 15 onward
NZD’s exogenous model score worsened to -12 in April
While NZD LEI and endo improved, it remains structurally weak
Timing
Best execution: on pullback to 1.9373 zone, ideally between April 10–15, aligned with seasonal entry window.
Here's Why I'm Bullish on TSLA: Smart Money is Buying...Here's Why I'm Bullish on NASDAQ:TSLA Multi-Timeframe Analysis Using Larry Williams' Methods
After a significant downtrend, NASDAQ:TSLA is presenting multiple bullish signals based on Larry Williams' methodology. The weekly and daily timeframes are aligning for a potential reversal opportunity with clearly defined risk parameters.
Weekly Timeframe Analysis
The weekly chart reveals several key bullish indicators:
- The COT Proxy Index shows commercials are buying at significantly higher levels compared to 6 months ago, 1 year ago, and 3 years ago.
- Seasonality patterns have reached a turning point, now indicating the beginning of an uptrend phase
- The WillVal indicator shows NASDAQ:TSLA is currently undervalued at multiple securities (DXY, QCCH, ZBLU all showing "Under")
- ADX reading above 60 (currently at 62.42) signals the existing downtrend is likely exhausting and nearing completion
Daily Timeframe Analysis
On the daily chart, we're seeing initial confirmation signals but still waiting for the optimal entry setup:
- The general market has created a Rally Day, and we're now watching for a Follow Through Day to confirm the new uptrend
- Price structure requires further confirmation through a change of character before entry
- The ProGo indicator has already turned positive, providing an early bullish signal
- Williams %R is showing oversold conditions, suggesting a potential bounce
- We need the Large Traders index to turn its slope upward for additional confirmation
Entry Strategy
I'm looking for one of these entry triggers:
- Primary : First pullback after change of character , using Williams %R for precise timing
- Alternative : Entry on first pullback after price moves above the WillTrend line
- Aggressive option : Entry if price breaks above the $245 resistance level
Profit Targets & Risk Management
Targets:
- First target: $327 (1.27 Fibonacci level)
- Second target: $390 (Larry Williams Target Shooter -> 2.00 Fibonacci level )
Risk Management:
- Initial stop loss: $228 or 120% of ATR(3) from entry point
- Once in profit, trailing stop based on price closes at WillTrend levels
The confluence of indicators across timeframes suggests a significant reversal potential in NASDAQ:TSLA , but waiting for daily chart confirmation will provide a higher probability setup with clearly defined risk parameters.
DISCLAIMER
This analysis is provided for informational and educational purposes only. The ideas and strategies presented should never be used without first assessing your own personal and financial situation. This content is not financial advice and should not be construed as a recommendation to buy, sell, or hold any securities or to engage in any specific investment strategy. All investment carries risk, including the possibility of losing some or all of your initial investment. Past performance of securities, including the patterns, signals, and indicators discussed, is not indicative of future results. The author does not guarantee the accuracy, completeness, or usefulness of any information presented. Each investor should conduct their own research and consult with qualified financial professionals before making investment decisions. Trading Tesla ( NASDAQ:TSLA ) stock involves significant risks that may not be appropriate for all investors. You should only invest funds that you can afford to lose.

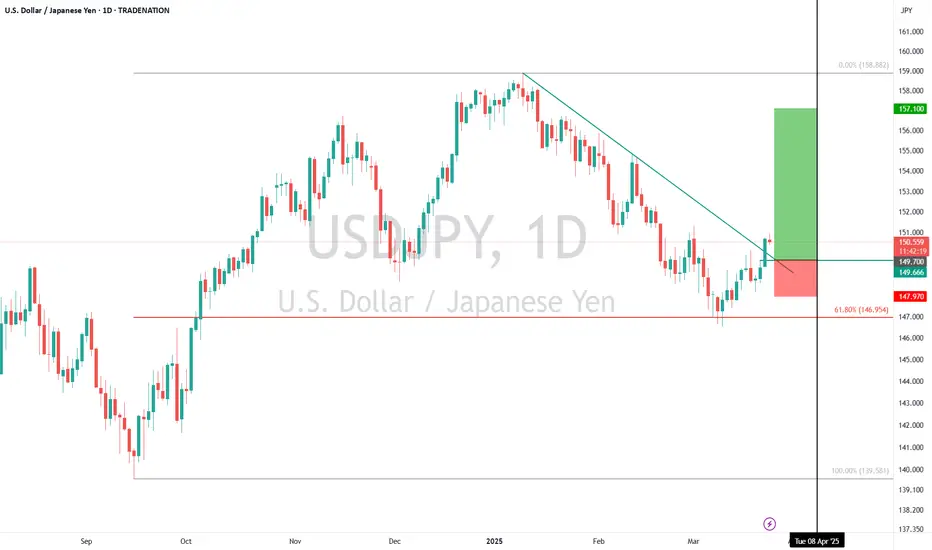
USDJPY Buy Setup – Breakout Confirmation & Seasonal TailwindTechnical: USDJPY has broken above a downtrend resistance line after finding support at the 61.8% Fibonacci retracement level at 146.95 . This breakout suggests the corrective phase may have ended, signaling potential for further upside. Pullbacks toward 149.70 (a retest of the broken trendline) present an attractive entry opportunity. Upside targets are 152.74 and 157.10 in the short to medium term. The setup is invalidated below 147.97 , with a break below 146.33 negating further bullish expectations.
Fundamental: Commercial selling of the Japanese Yen and renewed dollar purchases indicate a shift favoring USD over JPY, supporting the bullish technical outlook.
Seasonal: Over the past 25 years , USDJPY has risen 76% of the time between March 25 – April 8 , with an average gain of 1.04% .
Trade Idea:
Entry: On pullbacks toward 149.70
Stop Loss: 147.97 (or 146.33 for extended risk management)
Targets: 152.74 and 157.10
Disclosure: I am part of Trade Nation's Influencer program and receive a monthly fee for using their TradingView charts in my analysis.
USDCAD Short Setup – Potential Top Formation & Seasonal WeaknessTechnical: USDCAD has stalled in recent weeks, signaling a potential topping pattern. A recent break of the short-term trend suggests a deeper correction may follow. Key resistance is at 1.4355 , offering a favourable risk-reward short opportunity.
Fundamental: The U.S. dollar remains weak, with commercial participants showing little interest in buying. Meanwhile, the Canadian dollar is seeing increased accumulation, indicating a potential shift in momentum.
Seasonal: Historically, from March 24 – April 30 , USDCAD has declined 76.2% of the time over the past 21 years, with an average drop of 1.30%.
Trade Idea:
Sell: 1.4355
Stop Loss: 1.4551
Target: 1.3948
Disclosure: I am part of Trade Nation's Influencer program and receive a monthly fee for using their TradingView charts in my analysis.

Dow Jones: A Make-or-Break Buy Setup with Smart Money BackingDow Jones Industrial Average - Buy Setup
Technical: U.S. markets have struggled recently due to uncertainty over tariffs imposed by President Trump. While the S&P 500 and NASDAQ have broken key support levels, the Dow remains resilient, holding the critical 41,648 support. A break below would confirm a large double-top pattern, signaling a bearish outlook. This is a pivotal moment. The rebound from overnight lows is encouraging, but with the U.S. CPI release tomorrow, caution is warranted. While speculative, COT and seasonal data favour a short-term move higher.
Fundamental: The latest Commitment of Traders (COT) Report shows increasing long interest in the Dow, suggesting "smart money" accumulation.
Seasonal: Historically, from March 12 – May 2, the Dow has posted gains 84% of the time, averaging +3.68% over the past 25 years.
Setup:
Entry: 41,800 – 42,000
Stop Loss: 41,285 (below the Nov 2024 low at 41,648)
Target: 44,290
Disclosure: I am part of Trade Nation's Influencer program and receive a monthly fee for using their TradingView charts in my analysis.

AUD/USD – High Probability Long Setup1️⃣ Trade Execution – Why I Took the Long Position
Today's AUD/USD trade was a perfect setup combining Fibonacci retracements, institutional order flow, and seasonality trends from Prime Market Terminal. The confluences aligned well for a high-probability long entry.
💡 Entry Details:
✅ Entry: 0.6380 (Key demand zone + Fibonacci golden zone)
✅ Stop Loss: 0.6365 (Below market structure)
✅ Take Profit: 0.6429 - 0.6450 (Previous supply zone & liquidity target)
✅ Risk-Reward Ratio: 3:1
🎯 Result: Currently in profit, monitoring for further upside! ✅
2️⃣ Why This Trade Worked – A Breakdown of the Confluences
📊 Fibonacci Retracement – Textbook Pullback & Bounce
Price retraced into the 61.8%-78.6% Fibonacci zone (0.6380 - 0.6365) and bounced perfectly.
The bullish move followed an impulse leg, suggesting smart money accumulation in this zone.
📈 Smart Money & Order Flow – Trading with Institutions
🔹 Order flow from Prime Market Terminal shows major liquidity pools accumulating long positions.
🔹 DMX Data: 43% long vs. 57% short, indicating potential for a reversal as shorts get trapped.
🔹 COT Data: Institutional traders increasing their net long exposure on AUD.
🕵️♂️ Seasonality & Historical Trends Supported the Long
📊 Seasonal Prime data indicates AUD/USD historically trends higher in late February & March.
📅 Next 3-5 day forecast shows bullish probability, reinforcing the long bias.
📉 Technical Confirmation – Structure & Momentum
✅ SuperTrend flipped bullish on the 4H chart
✅ Price is trading above key moving averages (EMA 6, 24, 72, 288)
✅ Broke above short-term resistance, confirming upward momentum
3️⃣ Key Takeaways from This Trade
🔹 Trading with smart money flow and against retail sentiment increases trade probability.
🔹 Seasonality trends aligned perfectly, adding confidence in the setup.
🔹 Fibonacci, EMAs, and Prime Market Terminal data provided a precise entry.
🔹 Patience and risk management ensured a well-executed trade.
📌 Final Thoughts – What’s Next for AUD/USD?
🚀 With this bullish breakout, I’m looking for further longs on dips, targeting the 0.6450 - 0.6480 zone.
👀 What’s your outlook on AUD/USD? Are you long or short? Let’s discuss in the comments!
🔗 Follow me for more institutional trade setups & contrarian trading ideas!

GBP/USD Trade Recap – A Perfect Long Setup 1️⃣ Trade Execution – Why I Took the Long Position
Today’s GBP/USD trade was a textbook example of combining Fibonacci retracements, smart money positioning, and seasonality trends to catch a high-probability long setup.
💡 Entry Details:
✅ Entry: 1.2600 (Fibonacci golden zone)
✅ Stop Loss: 1.2587 (Below structure)
✅ Take Profit: 1.2635 (Key resistance zone)
✅ Risk-Reward Ratio: 3:1
🎯 Result: Hit TP at 1.2635 for a solid profit! ✅
2️⃣ Why This Trade Worked – A Breakdown of the Confluences
📊 Fibonacci Retracement – Perfect Pullback & Reversal
Price retraced to the 61.8%-78.6% Fibonacci zone (1.2600 - 1.2593) before reversing.
The bullish move was expected after a strong impulse leg, following smart money positioning.
📈 Smart Money & Retail Sentiment – Trading Against the Herd
🔹 62% of retail traders were SHORT on GBP/USD (as per DMX data).
🔹 Since I trade against retail sentiment, this provided a strong bullish confirmation.
🔹 Institutional COT data showed big players increasing long positions, further supporting a bullish bias.
🕵️♂️ Seasonality & Historical Trends Supported the Long
📊 15-year seasonality data indicated GBP/USD typically rallies in late February and early March.
📅 The next 3-5 day forecast showed a bullish probability, adding further conviction.
📉 Technical Confirmation – Momentum Indicators & Structure
✅ SuperTrend flipped bullish on the 4H chart
✅ Price was trading above key moving averages (EMA 6, 24, 72, 288)
✅ Broke above short-term trendline resistance, confirming upward momentum
3️⃣ Key Takeaways from This Trade
🔹 Trading with smart money & against retail sentiment = High probability setups
🔹 Seasonality provided extra confidence in taking the long trade
🔹 Using Fibonacci and EMAs for confluence led to a precise entry
🔹 Patience and risk management were key to securing profits
📌 Final Thoughts – What’s Next for GBP/USD?
🚀 With this bullish breakout, I will look for further longs on dips, targeting the next key resistance at 1.2680 - 1.2700.
👀 Are you bullish or bearish on GBP/USD? Let’s discuss in the comments!

MMSI / Merit Buy IdeaBroke trendline, then went up. yesterday retested Breaking-Candle#s high. Not on the way to new high.
The idea is to trade with the seasonality and expect a substancial kick to the bullish side after breaking the high.
I guess there is more than 10% possible profit until first haft of May.
But trade at your own risk and discretion....
Cheers

"February Momentum: Is Bitcoin Set to Soar Again?"Geopolitical Tailwinds
Trump’s tariffs accelerate dedollarization. Bitcoin’s neutrality and censorship resistance make it the ultimate geopolitical hedge. Retaliatory measures will destabilize fiat corridors, forcing institutions to rebalance into BTC.
February Seasonality
Historical 15.6% average
FBullish Bias: Bitcoin remains historically strong in February and institutions continue to accumulate.

TOTAL 3 DOUBLE BUBBLEIf Total 3 surges in the next two weeks, mirroring the length and percentage growth of the previous alt season, this chart reveals what you can anticipate from our beloved altcoins. Brace yourself; thrilling times may be just around the corner!

Gold and Silver Are Gearing Up For Higher PricesKicking off my 2025 posts with a positive outlook on Silver and Gold prices! 😊
Over the past three months, I’ve highlighted the "Nice areas" that have held prices well for both gold and silver. Hopefully, you’ve found those levels useful so far.
So, what’s next? 🤷🏻
In this post, I’ll focus more on technical analysis.
If gold closes above $2,740 this week, I’d expect its movement to follow the orange line I’ve drawn on the chart. My target is $2,850 to $2,900, which I hope to see reached within the next three months. However, I’d also like to see a brief revisit to the area below $2,700 before that move.
For silver, I’m looking for a strong close above $32.30. Only if that happens, I’d view any corrections as a great opportunity to add to my position, targeting $36. Ideally, I’d love to see this happen by the first week of March.
Note: Never try to time the market. The timeframes I mention are based on the seasonality patterns of Gold and Silver and don’t hold significant weight in my analysis.

AUDJPY Analysis - BuyAUDJPY Analysis Overview
1. Seasonality:
AUD: Bearish until midweek — Seasonal weakness in AUD early in the week aligns with a short-term bearish sentiment.
JPY: Bullish — JPY strength throughout the week supports its safe-haven appeal.
---
2. COT Report (Commitment of Traders):
AUD:
4-week flip indicates a Sell bias.
Non-commercial short positions are increasing, signaling bearish sentiment for AUD.
JPY:
4-week flip indicates a Buy bias.
Non-commercial long positions are increasing, reinforcing bullish sentiment for JPY.
---
3. Fundamental Analysis:
LEI (Leading Economic Indicator):
AUD:Decreasing — Suggests deteriorating economic momentum, adding to bearish pressure.
JPY: Range — Neutral economic conditions but still supportive due to JPY's safe-haven status.
Endogenous Factors:
AUD: Mix to Decreasing — Weak internal factors limit AUD’s strength.
JPY: Increasing — Improving domestic conditions support JPY buying.
---
4. Exogenous Factors:
GBPJPY: Strong Sell — Broader risk-off sentiment in the market favors safe-haven currencies like JPY over risk-sensitive ones like AUD.
---
5. Technical Analysis:
On the 1-hour chart:
A Cup and Handle pattern and an ABCD pattern are forming, indicating bullish potential.
After point C, the price is making Higher Highs (HH) and Higher Lows (HL), suggesting a bullish continuation.
These bullish patterns present a good Buy Opportunity, especially as the price confirms its breakout above the handle.
---
Bias: Buy
Despite AUD's seasonal weakness early in the week, the technical setup on the 1-hour chart favors a bullish bias for AUDJPY. JPY's strength provides additional support for safe-haven flows, but the technical patterns indicate that AUDJPY has room to rally in the short term. Consider entering long positions upon confirmation of the breakout above the handle.

Macroeconomic analysis, positioning, technical analysis. Short GHello everyone, today I want to share a trading idea that recently triggered my short entry.
The GBP/AUD pair is hovering near period highs not seen since 2020.
I think in the short term we might witness some pullback. Let’s analyze the situation.
MACROECONOMIC ANALYSIS
- Data
The latest data reflects a marked improvement in the Australian labor market, with the unemployment rate beating expectations. A rise to 4.2% was forecasted, but the figure dropped to 3.9%. This comes after the RBA decided to keep the reference rate unchanged, adopting a dovish tone compared to recent statements. It remains to be seen if this data could shift the narrative once again.
- Economic growth
The positioning and momentum on the pound indicate confidence that the economy could grow by 2025 or that inflation will remain stickier than expected. This affects the BOE’s monetary policy decisions. Interest rates have risen more than in other economies and are now at their peaks. On the other hand, the BOE recently adopted a dovish tone, suggesting the possibility of four rate cuts in 2025.
In a recent article, Goldman Sachs highlighted that the UK’s growth might underperform expectations. UK GDP is expected to grow by 1.2% in 2025, slower than the Bank of England's 1.5% projection and slightly below Bloomberg's consensus estimate of 1.3%. The team predicts growth of 0.4% in the first quarter of 2025 compared to the last quarter of 2024, with a slowdown to around 0.25–0.30% quarterly for the remainder of the year. They also foresee inflationary pressures easing through 2025, paving the way for deeper rate cuts than currently priced in by the market.
www.goldmansachs.com
- Interest rates
Interest rates in the UK have risen more than in other economies, reaching a peak of 4.6%, reflecting aggressive rate policies. Meanwhile, AUD/USD movements appear closely tied to Chinese rates, which are at historic lows, potentially priming for a rebound and, consequently, a recovery in the cross, due to potential stimulus measures for the Chinese economy.
POSITIONING
- COT (Commitment of Traders)
Let’s analyze the COT to check for extremes on either side.
www.tradingster.com .
Long positioning on the pound is at its highest since 2018, while for the Australian dollar, we are in negative territory after a decline. Momentum does not favor either currency, as traders are offloading or increasing short positions.
SEASONALITY
We are entering a period of strong negative seasonality for the pound, which typically tends to decline from the first week of December until the end of the month.
TECHNICAL ANALYSIS
From a chart perspective, the pair has just broken a dynamic trendline support on the 4H chart after a strong rally to period highs. The RSI clearly shows overbought conditions with bearish divergence.
Entry: Upon the break or retest of the trendline.
Stop Loss: Above the volume area signaling the break.
Take Profit: Near the volume area supporting the price.
Thanks for your attention!

GBPCAD Analysis - Bearish - Trade 06GBPCAD Analysis Overview
---
1. Seasonality
GBP: Seasonality indicates a **sell** signal for GBP in the first week of December.
CAD: Seasonality suggests a **strong buy** signal for CAD.
Seasonality Bias: Sell GBPCAD
---
2. COT Report
GBP:
COT RSI: 52 weeks at 30%, 26 and 13 weeks at bottom.
COT Index: 3-year at 50%, 1-year at 30%, indicating weak positioning for GBP.
Net Non-Commercial: Decreasing, showing a bearish sentiment.
CAD:
COT RSI: 52, 26, and 13 weeks at 20% and increasing, showing bullish momentum.
COT Index: 3-year and 1-year at 20% and increasing, aligning with a buy sentiment.
Net Non-Commercial: Increasing, with a positive bias.
COT Bias: Sell GBPCAD.
---
3. Fundamental Analysis
Leading Economic Indicators:
GBP: Decreasing, signaling economic weakness.
CAD: Increasing, pointing to economic strength.
Endogenous Factors:
GBP: Decreasing, aligning with a sell sentiment.
CAD: Increasing, further supporting a buy stance.
Exogenous Factors:
GBPCAD exogenous signal indicates a buy CAD, sell GBP sentiment.
Fundamental Bias: Sell GBPCAD.
---
4. Technical Analysis
RSI Divergence: Bearish divergence identified, indicating potential downside movement.
Breakout Indicator: A red arrow confirms bearish momentum on key breakout levels.
Resistance Zone: Price is currently at a strong resistance zone, showing rejection patterns.
Technical Bias: Sell GBPCAD.
---
Final Bias: Sell GBPCAD
The alignment across seasonality, COT data, fundamental indicators, and technical analysis strongly supports a sell setup for GBPCAD.

AUDNZD Analysis - Bullish - Trade 07AUDNZD Analysis Overview
---
1. Seasonality
AUD: Strong **buy** signal for the first week of December, suggesting upward momentum.
NZD: Range-bound signal, indicating weaker performance compared to AUD.
Seasonality Bias: Buy AUDNZD.
---
2. COT Report
AUD:
COT RSI : Decreasing from the top but still indicates bullish positioning.
COT Index : Near the top, signaling strong institutional interest in AUD.
Net Non-Commercial : Increasing, aligning with a buy sentiment.
NZD :
COT RSI : At the bottom (0%), but overall positioning is weak.
COT Index : Bottomed at 0%, reflecting limited institutional support for NZD.
Net Non-Commercial : Decreasing, suggesting bearish momentum.
COT Bias: Buy AUDNZD.
---
3. Fundamental Analysis
Leading Economic Indicators (LEI) :
AUD : Increasing, pointing to improving economic conditions.
NZD : Increasing, but weaker overall impact compared to AUD.
Endogenous Factors:
AUD : Mix to decreasing, but seasonal strength supports AUD’s buy case.
NZD : Increasing, but weaker compared to AUD.
Exogenous Factors :
AUDNZD exogenous signal supports a buy AUD, sell NZD bias.
Fundamental Bias: Buy AUDNZD.
---
4. Technical Analysis
RSI Divergence: Bullish divergence spotted on the 4H timeframe, signaling potential upward movement.
Parallel Channel : Price is at the bottom of a bearish parallel channel, indicating possible reversal to the upside.
Daily Support : Currently holding above a strong daily support zone, reinforcing the bullish setup.
Technical Bias: Buy AUDNZD.
---
Final Bias: Buy AUDNZD
All factors—seasonality, COT data, fundamentals, and technicals—align in favor of a BUY setup for AUDNZD. This pair shows potential for upward movement, supported by strong economic and technical signals.

AUDUSD Analysis - Bearish - Trade 021. Seasonality:
During the first week of December, the USD exhibits bearish momentum, while the AUD shows bullish tendencies. This combination makes AUDUSD overall bullish.
2. COT Report:
The AUD's COT RSI and Index are near the top, while the USD is near the bottom, indicating potential overextension. This suggests a bearish outlook for AUDUSD.
3. Fundamental Analysis:
LEI
The USD Leading Economic Indicator (LEI) is increasing, while the AUD LEI is decreasing. Global LEI is also rising, favoring USD strength and adding a bearish tone to AUDUSD.
Endogenous Factors
These suggest bearish pressure for the AUD and bullish sentiment for the USD, further supporting a bearish bias.
Exogenous Factors
Exogenous influences, however, indicate an increase in AUDUSD, favoring a bullish trend.
4. Technical Analysis:
AUDUSD is forming an ABCD pattern and is currently at the 0.618 Fibonacci retracement level on the 1-hour chart. Additionally, there is significant resistance on the 4-hour chart, indicating potential bearish pressure from a technical standpoint.
Summary
The analysis presents mixed signals: seasonality and exogenous factors favor bullishness, while the COT report, LEI trends, endogenous factors, and technical resistance suggest bearish potential.
Bias
The combined analysis leans toward a short entry for AUDUSD.
Trade Plan
Entry: 0.64746
SL: 0.65130
TP: 0.64362

1-800-Flowers.com | FLWS | Long at $8.001-800-Flowers.com NASDAQ:FLWS has been in price consolidation mode since 2022 and may be gearing up for an upward move as my historical selected simple moving average reconnects with the price. The company is expected to become profitable in 2025 and the holiday season is approaching. Historically, this is the period when the price begins to rise. With a 25 million float and 14.54% short interest, this ticker could get interesting if it takes off. But be cautious as the economy seems to be showing signs of slowing... At $8.00, NASDAQ:FLWS is in a personal buy zone.
Target #1 = $9.20
Target #2 = $10.50
Target #3 = $20.50 (long-term if the economy is strong...)

How to Optimize Your Investments and Navigate Economic SeasonsThe economy operates in recurring phases of expansion and contraction, known as business cycles or economic cycles. These cycles play a fundamental role in shaping economic activity, employment, and investment decisions. In this article, we will explore the different phases of the business cycle, relate them to the seasons of the year, and discuss how investors and businesses can navigate these cycles effectively.
🔵𝚆𝙷𝙰𝚃 𝙸𝚂 𝙰 𝙱𝚄𝚂𝙸𝙽𝙴𝚂𝚂 𝙲𝚈𝙲𝙻𝙴?
A business cycle refers to the fluctuation of economic activity over a period, encompassing periods of growth and decline. It is measured through changes in key economic indicators such as GDP (Gross Domestic Product), employment, consumer spending, and industrial production.
Business cycles typically follow a regular pattern, starting with a phase of expansion, followed by a peak, a period of contraction or recession, and eventually a trough, after which the economy recovers and the cycle begins anew.
🔵𝙱𝚄𝚂𝙸𝙽𝙴𝚂𝚂 𝙲𝚈𝙲𝙻𝙴𝚂 𝙰𝙽𝙳 𝚃𝙷𝙴 𝚂𝙴𝙰𝚂𝙾𝙽𝚂 𝙾𝙵 𝚃𝙷𝙴 𝚈𝙴𝙰𝚁
Each phase of the business cycle can be compared to a season of the year, which provides a helpful way to visualize the economic conditions at play:
Spring (Recovery) : After the trough (winter), the economy enters a phase of recovery. Like spring, it's a time of renewal, with growth resuming and businesses beginning to thrive again. Employment rises, consumer confidence improves, and investment increases.
Summer (Expansion) : The economy reaches its full strength during the expansion phase. Just like summer brings warmth and energy, this phase brings rising consumer confidence, employment, and production. Companies grow, and investments yield high returns.
Autumn (Weakening) : As the cycle peaks, the economy starts showing signs of weakening, much like the cooling of autumn. Consumer spending and business growth slow down, and inflation may rise. The peak signals that the economy is at its maximum potential, and a slowdown or contraction may follow.
Winter (Contraction or Recession) : In winter, the economy enters a recession, characterized by declining economic activity, falling production, and rising unemployment. Just as winter halts nature’s growth, a recession slows down economic growth. This is the time when businesses may suffer losses, and consumer confidence weakens.
🔵𝙸𝙼𝙿𝙰𝙲𝚃 𝙾𝙵 𝙱𝚄𝚂𝙸𝙽𝙴𝚂𝚂 𝙲𝚈𝙲𝙻𝙴𝚂 𝙾𝙽 𝙳𝙸𝙵𝙵𝙴𝚁𝙴𝙽𝚃 𝚂𝙴𝙲𝚃𝙾𝚁𝚂
Business cycles affect various sectors of the economy differently. Some sectors, like consumer discretionary and industrials, tend to perform well during expansions but suffer during recessions. Others, such as utilities and consumer staples, may be more resilient during downturns, as they provide essential goods and services.
For example:
Technology and Manufacturing : These sectors are highly sensitive to business cycles and tend to flourish during periods of expansion due to increased consumer and business spending.
Healthcare and Utilities : These sectors often remain stable during recessions because demand for healthcare and essential services remains constant.
Crypto Sector:
SP500:
🔵𝙽𝙰𝚅𝙸𝙶𝙰𝚃𝙸𝙽𝙶 𝙱𝚄𝚂𝙸𝙽𝙴𝚂𝚂 𝙲𝚈𝙲𝙻𝙴𝚂 𝙰𝚂 𝙰𝙽 𝙸𝙽𝚅𝙴𝚂𝚃𝙾𝚁
Investors can use knowledge of the business cycle to adjust their portfolios. During expansion phases, growth stocks and cyclical industries may offer better returns.
Risk-On vs. Risk-Off Investing in Different Business Cycle Phases
During periods of economic expansion (summer), the environment is often referred to as "risk-on." Investors are more willing to take risks because economic growth drives higher returns on riskier assets, such as equities, growth stocks, or emerging markets. As consumer confidence, business spending, and investments increase, the potential rewards from higher-risk investments become more appealing.
Example of risk-on and off of cryptocurrency
Example of risk-on and off of Stock Market
However, during periods of economic contraction or recession (winter), investors typically shift to a "risk-off" strategy. In this phase, they seek to protect their capital by moving away from high-risk assets and toward lower-risk investments like government bonds, blue-chip stocks, or cash. The focus shifts to preserving wealth, and risk-taking is minimized or eliminated.
Investors may use leading and lagging indicators to anticipate where the economy is headed. Leading indicators, such as stock market performance or consumer confidence, tend to signal changes before the economy as a whole moves. Lagging indicators, like unemployment or corporate profits, confirm trends after they occur.
🔵𝙶𝙾𝚅𝙴𝚁𝙽𝙼𝙴𝙽𝚃 𝙿𝙾𝙻𝙸𝙲𝙸𝙴𝚂 𝙰𝙽𝙳 𝙱𝚄𝚂𝙸𝙽𝙴𝚂𝚂 𝙲𝚈𝙲𝙻𝙴𝚂
Governments often intervene to smooth out the extremes of business cycles through fiscal and monetary policy. During recessions, governments may implement stimulus packages, cut taxes, or increase spending to boost demand. Central banks may lower interest rates to encourage borrowing and investment.
Conversely, during periods of rapid expansion and inflationary pressure, governments may raise taxes or cut spending, while central banks might increase interest rates to prevent the economy from overheating.
🔵𝙲𝙾𝙽𝙲𝙻𝚄𝚂𝙸𝙾𝙽
Business cycles are a natural part of economic activity, influencing everything from consumer spending to corporate profitability and investment strategies. By understanding the phases of the business cycle (or seasons of the economy) and their impact on various sectors, investors and businesses can better position themselves to navigate economic fluctuations.
Whether the economy is expanding or contracting, being aware of the current phase of the business cycle helps guide decisions, manage risks, and seize opportunities.

Fall Rally Patterns Setting Up: GMNYSE:GM was driven down way below its fundamentals by panicky retail. It is now back up into its fundamental level, well ahead of the Fall Rally. The fast recovery indicates that the selling was not aligned with fundamentals. Auto sales have an annual cycle with the highest number of sales in the final quarter of each year.

Well, let's change the sidesUsually, I really don't like shorting stocks. But this time I couldn't resist in placing a sell stop underneath the current floor. At least till the earnings I could be short in DLTR.
