4 year cycle inversion possibilityCurrently as it stands bitcoin's 4th cycle printed right translation (after Nov '25), market participants now are looking for where the top is going to be year 3 of the cycle. Based off of previous cycles we'd look for a November of 2026, 4 year cycle low.
The main scenarios currently being considered
1. March local top, consolidation until October blow off
2. March top, lower high in October
3. Steady climb until
A 4th scenario not often talked about is a cycle inversion in 2025. If a sell off of risk assets forcing the 4 year monthly cycle to invert where we would start the new 4 year cycle in 2025.
Seasonality

NMNQ short idea 20680 target.My daily target for MNQ towards my daily point of interaction was reached. My target idea is to short, aiming for 20,680.0 I’d like to see the setup form prior to PMI on 1/7/2025 and ensure it gets the push it needs from this week’s FOMC.

#Monero $XMRUSD One Year AnalysisCRYPTO:XMRUSD
Keylevels / Range
$120: Lowest trend price. If the price closes below this level, it would signal a bearish trend.
$163: Lowest range price. A close below this level would unlock a new lower zone extending down to $120.
$203: Current price.
$233: Upper limit of the current channel/wedge.
$370: Long-term target.
Analysis:
Monero has been trading within a range of $183 to $206 for the past two weeks. The price has closed above $197 for the first time since May 2022. This move potentially unlocks a new range, reaching at least $233, where the upper limit of the current channel/wedge and a monthly/weekly supply zone are located.
A weekly close above $237 would strongly indicate the unlocking of a new charted zone extending from $237 to $370.
Coin Bio:
Monero (XMR), is a privacy-focused cryptocurrency launched in April 2014. It was originally forked from the Bytecoin blockchain. Unlike many other cryptocurrencies, Monero's primary focus is on ensuring the anonymity and untraceability of transactions.
Key features include:
Ring Signatures: Obfuscate the sender's identity.
Ring Confidential Transactions (RingCT): Hide the transaction amount.
Stealth Addresses: Create unique, one-time addresses for each transaction, obscuring the receiver's identity.
These features make Monero attractive to individuals seeking financial privacy and are a core differentiator in the cryptocurrency space. It's developed by an anonymous community of developers and has gained significant traction for its commitment to private and fungible transactions. While its focus on privacy can be controversial, it remains a prominent cryptocurrency with a dedicated user base. XRMUSD specifically refers to the trading pair of Monero against the US Dollar.
#CRYPTO #MONERO #XMRUSD #XMR #CRYPTOCURRENCY #AHMEDMESBAH

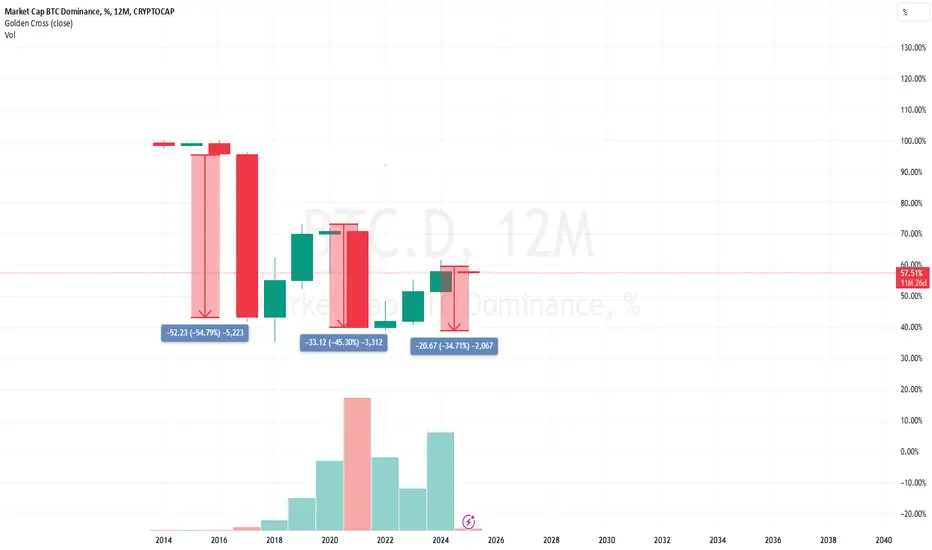
Next Alt sessionBTC.D tends to drop right after its halving cycle; this may be the last altcoin season.
BTC dominance reveals how to navigate crypto cyclesHello everyone,
this one is for patient (long-term) traders/investors, not for those chasing daily gains or short term swings.
We are looking at BTC dominance chart. BTC dominance is currently at 60%, which is pretty high.
Everyone who follows cryptos for some time should know how crypto cycles work. BTC is king and always leads the way. BTC if the first one to start the bull run, altcoins follow. When BTC is near its peak, money transfers into ALTs --> start of ALTSEASON.
The first peak of altcoin season was January 2018. BTC dominance was at 35%. After Jan 2018 we went into a bear market. BTC dropped in value, ALTCOINS dropped even more. Consequently, BTC dominance went up.
BTC dominance reached top at 74% in Jan 2021. That is when ALTSEASON started.
THIS DOES NOT MEAN THAT BTC REACHED TOP in Jan 2021.
BTC rose from 40k to 70k between Jan 2021 and Nov 2021, but ALTs in this period made bigger gains.
BTC dominance in this period plummeted from 74% to 40%, creating a base for future.
From Jan 2023 BTC has been rising and increasing its dominance, currently sitting at 60%. I am positive it will not break high of Jan 2018. Next strong resistance is in the area of 64-67%, I expect dominance to reverse in this area.
BTC has already made a new ATH, but total crypto market space is not at an ATH yet. So ALTs are lagging in comparison to previous cycle.
I believe we are at the start of ALT season and I will be looking into ALTs for my last gains this cycle. Check my other posts to see which ALTS I am considering. I will also be posting some other ALTs in coming days/weeks, so subscribe to stay notified.
Good luck to everyone.

EurUsd could drop under parity in 2025 (0.95 target)Now that 2024 has concluded, EUR/USD has ended the year at its lowest point, marking a 7% decline from January and a 9% drop from its summer peak.
Most notably, the pair fell 6% since November—a significant move for such a typically stable currency pair, highlighting strong bearish momentum.
Technical Analysis
On the daily chart, the EUR/USD has shown a steady downtrend since its double top in August and September. Every meaningful reversal attempt was met with selling pressure, leading to a quick resumption of the downward trajectory.
The long-term (monthly) chart paints an even grimmer picture. The pair has been in a clear downtrend since its 2008 peak of 1.60, and it now sits precariously on critical support levels from the 2015 and 2017 lows.
Fundamental Outlook
The fundamentals align with the technical bearish trend. Diverging monetary policies and a bleak economic outlook for the EU add to the pair's struggles.
Conclusion:
Given these conditions, a drop below parity appears likely in the coming year. The most prudent trading strategy for EUR/USD is to sell into rallies and wait for further declines.
My target is 0.95, but, to be honest, I would not be very surprised by 0.9

$BTC Cheat Sheet They Don't Want You To See!THE CRYPTO CHEAT SHEET
After seeing this, don't let anyone tell you that trading the market is hard.
All you need is a 4-year mindset.
Sell in November (the latest) post-halving year, ie 2025
Buy in November the year after, ie 2026
It really is that simple.
CRYPTOCAP:BTC 👑

$BTC Cycle Elliot Wave AnalysisMore confluence on why this CRYPTOCAP:BTC cycle will perform similar to 2017 vs 2021.
If we look at Elliot Wave theory, we can see the first cycle (red) had a long 3rd wave and somewhat truncated 5th wave.
The second cycle (green) had a muted 3rd wave and extended 5th wave.
The third cycle performed similar to the first, which makes me believe the fourth cycle will perform similar to the second cycle.
It appears the ₿itcoin cycle flip-flops every other time.
*NOTE* I used Closing Candles for when drawing EW to cancel out noise.
**EW drawings are extremely subjective, hence why I don’t use often for analysis.

ICP performance in this bullrunImportant resistances 16,23,52,84,160,250 and 500, If the bullrun goes with hype, we will be able to reach perfectly all the leels, maybe more

Niftythese days looks like same as
AUG- SEP-24 ME NIFTY TOP MAR RAHA THA ,LEKIN PORTFOLIO TUT RAHA THA
31-DEC -24 NIFTY NICHE JA RAHAHE LEKIN STOCKS PRICES SUSTAIN SE UPER HO RAHEHE
it seems made monthly low and if nifty fut sustain above 23900 should do well for 24200++
today nifty fut made open low 23500
also made 3 support zone 23300-500 range

new wave 5 targets on ada since deep wave 4 correction
in above mentioned idea i outlined most passive targets on ada. Today there was a impulsive weekly Candle that take off ada to 10% 24h pump as only coin in top 10 .
Just for the bigger Picture that means ADAs marketcap pumped from 40 to 44billion dollars in1-2 days 4 billion on top thats massive. As iam in that market since 2017 i learned if ada pumps that hard out of nothing, that is a superb sign of outperforming next days.
New Target
1,47 minimum up to 1,70$ in a normal wavecount scenario
INFO:
if alt season starts my targets probable are nonsense because ada will rise much higher
If BTC dumps then all alts including ada will dump to. Then the Chart needs a new point of view and analysing.

Alt Season: The Calm Before the Storm?Hi fellow traders, Crypto21Official here! 🚀
After a strong impulse in the crypto market, we’ve had a teaser of what could be an alt season. The crypto market cap chart (excluding the top 10) showed a beautiful surge to $450 billion, a key level that marked the recent high.
Since then, we’ve retraced around 27%, and the downtrend appears to be losing momentum. Right now, we’re dipping into a key buy zone, where I’ve marked a potential double-bottom pattern. If confirmed, this could signal a bullish reversal and set the stage for further growth.
On the Bitcoin Dominance (BTC.D) chart, we still see room for dominance to rise slightly before a healthy decline could pave the way for a full-blown alt season. Historically, such patterns have preceded explosive altcoin growth.
Why Could January Be a Game-Changer?
Tax-Loss Harvesting Rebound: As the year ends, investors often sell assets to optimize for tax benefits. By January, these funds tend to flow back into the market, sparking renewed interest.
U.S. Election Cycle Momentum: Political developments surrounding the U.S. election cycle could act as a macro catalyst, influencing risk-on markets like crypto.
Historical Patterns: As we’ve seen before:
Bitcoin typically leads the market with a strong rally.
Altcoins dip or consolidate.
Then, altcoins blast off, following Bitcoin’s momentum. 🚀
My Take
I remain bullish, expecting January to be a pivotal month for Bitcoin, which could open the floodgates for altcoins to follow. History doesn’t repeat itself, but it often rhymes. Let’s see if the market plays along. 🌕
What are your thoughts? Are we on the brink of something big? Let me know below! 👇

Bitcoin: Entering New Presidential CycleCharts are essential, but it’s equally important to stay aware of major events that can significantly impact markets. Alongside this, I’ll share some theoretical insights.
Market During Presidencies:
The chart tracks the S&P 500’s growth on a logarithmic scale, highlighting U.S. presidential terms by party since 1933. Blue areas represent Democrat presidencies, and red areas indicate Republican presidencies. It shows that the market has grown steadily over time, despite fluctuations tied to economic cycles, policies, and global events. Key trends include significant growth during Clinton and Obama presidencies (dot-com boom, post-2008 recovery) and slower growth during Nixon and Carter presidencies. The chart also reflects recent market gains under Trump and Biden, despite challenges like the COVID-19 pandemic. Overall, it demonstrates consistent long-term market growth under both political parties, driven by a mix of policies and external factors.
PRESIDENTIAL CYCLE
"Presidential Cycle" in trading refers to a theory that financial markets tend to follow a recurring pattern tied to the four-year term of U.S. presidential administrations. This cycle is based on the idea that government policies and political events during a president’s term can influence economic conditions and market behavior in predictable ways.
PHASES:
Post-Election Year
Stock Market: New or re-elected presidents introduce reforms that may unsettle markets. Slower growth and higher volatility are common as policies stabilize.
₿ Market:
Historically, Bitcoin has experienced significant growth following U.S. presidential elections. For instance, after the 2016 election, Bitcoin’s price increased by over 2,500% in the subsequent year.
Potential Impact:
The resolution of electoral uncertainty typically restores market stability. Additionally, newly introduced policies can foster investor confidence, making alternative assets like Bitcoin more appealing. If these policies are crypto-friendly, they could accelerate Bitcoin adoption and drive price appreciation.
Midterm Year
Stock Market: Midterm elections create political uncertainty, often causing market corrections. The second half of the year typically sees recovery as clarity improves.
₿ Market:
Bitcoin may experience corrections or slower growth during midterm years. For example, in 2018, Bitcoin’s price declined significantly, aligning with the midterm election period.
Potential Impact:
Midterm elections can lead to shifts in political power, creating regulatory uncertainty for the crypto market. This could deter institutional investors or slow Bitcoin’s momentum. However, as the political landscape becomes clearer, the market could stabilize, potentially paving the way for future growth.
Pre-Election Year
Stock Market: Historically the strongest year, with administrations boosting the economy. Market-friendly policies lead to stronger performance and public support.
₿ Market:
Pre-election years have often been bullish for Bitcoin. In 2019, Bitcoin’s price saw substantial gains, rising from around $3,700 in January to over $13,000 by June.
Potential Impact:
Increased government spending and the anticipation of policy changes often stimulate economic activity, benefiting risk-on assets like Bitcoin. This optimism can lead to higher investor participation and significant price increases as the market factors in favorable policy expectations.
Election Year
Stock Market: Election uncertainty heightens volatility, but clarity post-election boosts markets. Performance depends on the perceived business-friendliness of leading candidates.
₿ Market:
Bitcoin has shown mixed reactions during election years. In 2020, despite initial volatility, Bitcoin reached a new all-time high post-election, suggesting that the resolution of political uncertainty can positively influence its price.
Potential Impact:
The election outcome often dictates the regulatory direction for cryptocurrencies. A pro-crypto administration could fuel optimism and attract new investors, while stricter regulations could introduce headwinds. Regardless, the post-election clarity often drives market confidence, benefiting Bitcoin’s valuation.
Chronological Flow of Events Fueling Bitcoin’s Exponential Growth
Shift to CFTC Regulation
Trump proposed moving crypto regulation from the SEC to the CFTC, creating a friendlier environment to foster innovation and boost investor confidence.
Institutional and Retail Adoption
Bitcoin became accessible through retirement accounts and ETFs, driving demand from both institutions and retail investors.
Market Sentiment and Musk’s Influence
Endorsements from Elon Musk (Trump's circle) sparked optimism, fueling rallies and increasing crypto adoption.
Geopolitical Competition
The U.S. aimed to lead the crypto space, countering China’s dominance and stabilizing Bitcoin’s market.
Trump’s Bitcoin Strategic Reserve
A proposed U.S. Bitcoin reserve would position it alongside gold, boosting demand and global legitimacy.
J.D. Vance’s Proposal to Devalue the U.S. Dollar
Vance’s plan to weaken the dollar to boost exports contrasts sharply with Bitcoin’s fixed supply of 21m coins, which makes it an inflation-resistant alternative to fiat currencies. Bitcoin’s finite supply and decentralized nature make it a strong hedge during monetary policy uncertainty, further solidifying its role as a store of value. Vance’s proposal inadvertently highlights the vulnerabilities of fiat currencies, positioning Bitcoin as a compelling alternative in a volatile economic landscape.
Holiday Effect
Bitcoin’s performance is influenced by alignment of market sentiment, economic factors, and geopolitical events with holiday seasonality known as the “holiday effect” during major holidays like Christmas and New Year.
🏛️ FEDERAL RESERVE
The Federal Reserve operates independently of the President and Congress, focusing on economic goals like controlling inflation, maintaining employment, and ensuring stability. While the President appoints members to the Board of Governors, these appointments require Senate confirmation and fixed terms, insulating monetary policy from political influence. This structure safeguards long-term economic stability and credibility.
Donald Trump’s pro-crypto stance faces significant challenges due to the Federal Reserve’s autonomy and cautious approach to cryptocurrencies. The Fed has historically expressed skepticism about decentralized assets, citing concerns over financial stability, regulatory risks, and potential misuse. Instead, it prioritizes initiatives like Central Bank Digital Currencies (CBDCs), such as a digital dollar, which could compete with cryptocurrencies like Bitcoin.
This divergence underscores a conflict of goals: pro-crypto policies encourage innovation and adoption, while the Fed views decentralized cryptocurrencies as a challenge to its control over monetary policy and the U.S. dollar’s global reserve currency status. Additionally, the Fed collaborates with other regulatory agencies, like the SEC and Treasury, which have traditionally taken a cautious stance on cryptocurrencies.
Ultimately, while Trump’s policies may boost private crypto adoption and innovation, the Federal Reserve’s focus on financial stability and its own priorities, like CBDCs, limits the broader impact of these policies. This highlights the difficulty of aligning political aspirations with the Fed’s institutional priorities.

GALA 300% Next MovePrice is coiling up for the second half of this fractal pattern (Rally C) and I'm looking
at a bottom some time around February as the last pattern took off around the same time
The reason for this forecast to hit the Demand level again is because of the divergence move
seen on the Trend Reader, and the fractal pattern itself calls for a retest back to demand
Long term EMA is projecting flat readings for the future and this can also give us a signal for
price to slam back down.
Trend Reader
The Short Term Signal Line is racing back to the oversold zone and once the crossover takes effect we should see price shoot back up
Looking back at the Long Term Signal Line its projecting that long term momentum is dying off
and that after we hit this next high we can expect price to selloff like shown before with
the last divergence pattern.
Targets
7.7 Cents
13 Cents
16 Cents

EURUSD Wyckoff Distribution Phase
EURUSD has been in a accumulation phase for over a year, and I believe that it is going into Phase E of the Wyckoff distribution phase.

$COOKIE reminds me $SUSHI... this will be HUGE.Get ready for an explosive move! The recent patterns in $COOKIE are reminiscent of the incredible CRYPTOCAP:SUSHI rally we witnessed last year. With similar market conditions and strong community backing, I predict a potential rise of over 7000% .
Don't miss out on this opportunity – it's time to ride the wave and see your investments soar to new heights!
Disclaimer: This is not financial advice. Please do your own research before making any investment decisions."

#Sui $SUIUSD Short-Term AnalysisAnticipating CRYPTO:SUIUSD to seek demand where the closes major demand zone is located close to 2.40
#SUI #SUIUSD # CRYPTO #CRYPTOUSD #CRYPTOANALYSIS #AHMEDMESBAH #SUPPLYANDDEMAND

AVAX - Next Big MovePrice action is successfully holding above bullish liquidity and I'm expecting a bottom in between $25 - $35 while price swings around inside this triangle pattern
First targets are around $77 (~150% profit)
This next move wont be ready until April based on seasonality effects.

#Ethereum $ETHUSD One year analysis.CRYPTO:ETHUSD Key Levels:
1. 4500 = Nearest major supply & 12 month target.
2. 4105 = Last year's high.
3. 2700 = Closest majot demand.
Analysis:
CRYPTO:ETHUSD is currently trading slightly below the 2024 high of approximately $4105. This level has broken above March's high around $4090, therefore it is no longer valid and must be cleared for ETH to reach a new all time high above the upper channel wedge.
The current uptrend appears to be losing momentum. For a resumption of the bullish trend, a period of price consolidation near the lower wedge of the current channel, around the $2700 demand zone, may be required to gather momentum.
Conclusion, A retest of the $2700 level may provide a very favorable buying opportunity.
#AhmedMesbah #Ethereum #ETH #ETHUSD #ETHANALYSIS #CRYPTO #CRYPTOCURRENCY #ETHCOIN #SUPPLYANDDEMAND

#PEPE $PEPEUSD Is seaking demand.CRYPTO:PEPEUSD Key levels:
0.00021600 = Nearest Weekly/Daily Supply
0.000014900 = Nearest Demand / Breakout level
0.000010100 = Channel lower wedge last buying level "Below this the coin turns bearish"
CRYPTO:PEPEUSD
Is currently seeking demand after the price has tested the recent nearest supply around 0.00021600.
Price is determined to test the nearest demand around 0.00014900. A daily close below this level is unlocking a new zone that extends until the lower channel wedge around 0.000010100.
The coin is abuy as long as it is trading above 0.000010100. Any daily/monthly close below this level is bearish.
#AHMEDMESBAH #CRYPTOCOIN #PEPE #PEPEUSD #ETHEREUM #MEMECOIN #MEME #SUPPLYANDDEMAND #CRYPTOCURRENCY

Dollar Bias for Christmas weekEverything is clear in the chart.Low volatility long vacations but mindful to play.

Bitcoin: The Cyclic Pattern Unfolding Again?Analyzing the current BTC weekly chart reveals striking similarities to the past, specifically the cycle seen at the end of 2023 and the beginning of 2024. Let’s break it down step by step.
1. Price Movement Comparison
Late 2023 vs. Late 2024: At the end of 2023, Bitcoin experienced a sharp rally of around 65%, moving from the lows to a significant peak. Fast forward to late 2024, and we see a nearly identical pattern—again, approximately 65% growth from the bottom to the recent high. The symmetry is hard to ignore.
2. WaveFlow Indicator
On both occasions, the WaveFlow indicator paints an eerily similar picture. It shows a strong push from the lows to the highs, followed by an expected pullback before another rally. If history repeats itself, the current setup implies that BTC will form a second peak following an intermediate bottom in the near term.
3. PrimeMomentum Long-Term Signal
The red diamond signal from the PrimeMomentum Long-Term Signal BTC indicator appears in a nearly identical spot:
The beginning of 2024: Red diamond signaled a top before a significant correction.
Late 2024: The same signal has just appeared, aligning with a possible cyclical correction phase.
4. PrimeMomentum Oscillator
At the bottom of the chart, the PrimeMomentum oscillator shows behavior that mirrors the end of 2023. This resemblance reinforces the idea that Bitcoin’s price action is following a cyclic pattern.
5. Expectations and Forecast
January Correction: Based on these indicators and historical patterns, we anticipate a pullback at the beginning of January 2025, targeting a mid-range consolidation or support zone.
February–March Rally: Following the correction in the second half of January, a rally is expected, peaking around March 2025, similar to early 2024’s price action.
Post-March Decline: After March, we could see another downward phase, mirroring the price behavior in mid-2024.
Conclusion: The Power of Cyclicality
This chart showcases the undeniable rhythm of Bitcoin’s cyclicality. Indicators like WaveFlow and PrimeMomentum provide clear parallels between the current market state and historical movements. If the cycle repeats as expected:
Short-Term: Prepare for a correction.
Mid-Term: Watch for a strong rally.
Long-Term: Plan for another cyclical downturn.
The data strongly suggests that Bitcoin’s market structure continues to adhere to predictable cyclical trends. With this knowledge, traders can better anticipate key market movements and position themselves accordingly.

BAC | BIG Drop for Next YearSimilar distribution pattern to 2022 Feb drop, price continues to make Higher Highs and indicators make Lower Highs while trading in overbought zones
Dont think its the best time to invest but to rather Trade instead with how high price is.
I'm looking at about 40% in price fall by February like the last time but for now long positions may be better at $43, and then price topping out at $50.
To prolong this pattern but not necessarily invalidate it I need to see a breakout above $50 and some type of quick retest with price action overshooting to the high end of the Major Resistance Zone $55, then we can end up seeing more than a 40% drop.
