$BTC Summer Gets Decided in the Next 30 Minutes!Bitcoin Bulls have 30 minutes til the Weekly close
Closing below the bullish trendline confirms the 10% downwards move to retest $50,5
RSI shows room for more downward pressure ahead w/ the close below the Bull Market Support Band
If $50,5 doesn’t hold, it will be a 20% dump to retest $45k
Or 30% to $38,5
As mentioned prior,
CRYPTOCAP:BTC will range these levels til September.
NOW is the time to allocate accordingly.
Seasonality

A new Crypto Bullmarket HAS already started.... When talking about Bitcoin or Crypto in general you usually will hear something like this from Traders/Investors that are bullish on Bitcoin: The Bitcoin halving every 4 years initiates a new bull market. By that logic a new Crypto bullmarket should start in late April of 2024, when the next halving is due, right? However, if I look at the price behaviour of Bitcoin prior to its last 2 halvings (2016 and 2020) I can clearly see that the actual bull market started 18 months prior to those halvings. Projecting this to the 2024 Bitcoin halving it would mean that a new bull market HAS already started as the markets bottom should have been end of October 2022 at around 18-20k... yes, we went still lower than that thanks to FTX, but up to now this theory still passes the test of time.
Another thing that, in my opinion, is aligning up perfectly: The FED interest rate cycle.... after now having higher interest rates (5.25 %) than the YoY US inflation (4.9 %) we should see interest rates staying stable (maybe there is 1 more hike coming in June 2023).... looking back in history after about 8-15 months the FED usually started lowering the interest rates again, which then initiated a shift from risk off assets to risk on assets (stocks & crypto). The shift back to a cycle of lowering interest rates will fall nicely together with the Bitcoin halving of 2024 and will probably fuel the bull market additionally.

Update plan gold nonfarm and in JulyIt is forecasted that there will soon be a bullish phase when all signals break for the uptrend. In my opinion, that is a bullish trap.
Please stick to the sell-off scenarios according to the price arrow I draw, every scenario has a stop loss level, don't expect too much from forcing and letting loose stop loss orders in this non-agricultural news for orders. buy. According to my experience, today or before news of gold release, there will be a strong sale, good luck to traders.
Please see updates for other ideas as well.

Bitcoin establishes new support level around previous ATH closeMany people have been losing sleep over the Bitcoin price action so I wanted to provide some technical analysis to show where we're possibly headed. I have a theory with data to back it up. If history repeats itself I believe Bitcoin has established a new baseline support level around $55k.
If you take a look at the Bitcoin chart on an 8-week time interval going all the way back to 2015, you can see every new all time high has a similar period of around 3 years of retracing back to the same level, before breaking through it again. Then after breaking the previous all time high, a new support level is established and price doesn't drop below the newly established support level. On this 8-week chart the previous all time high candle didn't close above $55k in August 2021. So, we have had almost 3 years of retracing back to this level and finally broke through it in Feb 2024. If my theory is true and history repeats itself, I don't believe we will see Bitcoin fall below $55k as this has become the new baseline support level.
*Of course, I could be wrong. Just a theory, not financial advice.

BITCOIN targets, rally, bottom and top perdition for 2024Every July 4th I put out price predictions of BTC, where we are, where we will go, rallies we will have along with bottoms and tops. I use fib levels + order books + Political agenda + social response with human behavior that is way too easy to predict. For you who follow me, you have seen my accuracy and as I said 50k was always in play, I now move that to 40k-45k for a bottom and a Jan-Feb top of 85K-90K and I do think that's the bull run top. Something big must happen to change my mind on that, so far all the big 100k+ numbers are just dreams, Nothing backs it up. Market and interest in crypto are still not where they need to be for me to justify over 100K, but as I said, something big would and could happen to make that come true. I'm just not willing to put my money on it yet. I'm not paid or influenced by corporations or anyone to say all that pump talk you see on social media platforms including Trading View. Yes, we are in a bull market, yes we are finishing the 1st of 2 waves for the bull run, and yes we will go back up and top in 1st Qrt 2025, yes that will be the start of the bear market. And yes We can go lower than 40k and yes I could be wrong, but I bet I'm not. Do your homework and research. I don't trust others with my wealth and neither should you. Happy Independence Day USA.

BTC: New Short-term bullish channelLong-term Fibo channel is clear here!
There might be a reversal
Regarding the mid-term channel a bearish trendline is broken
A new short-term channel which is tradable could be formed.
Short-term traders could take profit around the zone. But I think we should hold out cryptos till January.
read the related ideas see my reasons for that

XRP/USD Main trendMain trend. Logarithmic chart. Timeframe 1 month. Channel. Triangle.
This time frame to understand the direction of the trend and where the area to trade is now.
Found the chart with the longest trading history, which displays the main trend.
Coinmarketcap: XRP
Same parameters, but on a line chart.

CONY - Buy/Hold/DCA through Crypto Bull Cycle - 100%+ dividendI continue to load up on shares whenever we get into the buy zones. I also hold COIN. Both are holds for me through the BULL Crypto Cycle. IMO CONY reaches and exceeds all time high during this period. Dividends of 100%+ paid monthly are crazy good. As long as you keep your cost basis to prices down in these buy zones you shouldn't see any NAV erosion. (IMO).

The Duration of the Current Bitcoin Bull CycleHow Much Longer Will the Good Times Last?
In this chart, I highlighted 3 different cyclic frameworks.
The dynamic time cycle which is shown as "grey/blue zigzag" extended into the future. It is a 186 day cycle pattern which was observed at any past parabolic move since 2010 in Bitcoin. It needs 5 repetitions in order to complete a parabolic up move. Count 5 is to be expected to arrive summer next year. I also marked the "static" view for that cycle with blue circle arcs at the bottom. The red is the nominal (average) 200days cycle.
I added the seasonality cycles for Bitcoin at the top of the chart, highlighted with colored areas. The simple seasonality is always a bullish yearly start into May/June, follows by a flat June and bearish July-September pattern. Then bullish from October into end of the year.
The bitcoin halving cycle impact is also shown with the pinkish vertical lines. The last one happened April 2024. During the first 100days period after the halving, there is no impact to be expected. But analyzing past halving cycles, there has always been a big-up-excess around 400days after the halving.
Interestingly, all these 3 cyclic pattern are in alignment for the period October 2024 into May 2025 with a common bullish outlook. So we might get a flat to challenging summer 2024. But afterwards the cycle seem to vote for a continuation of the current bull cycle.
At the bottom, I added my preferred cyclic-tuned dynamic cyclic RSI indicator. Which I have made public for everyone. ("cRSI")
I presented more details on this analysis in my personal blog.

BTC long-term viewExpecting BTC to hit the green circle area before fully taking off into the current bullrun

Bitcoin Hidden Bullish Divergence Post Halving: Hold or BuyThe Bitcoin halvening puts the price action of bitcoin on a four year cycle that so far has resulted in a higher high each cycle. Until that changes the best money to be made is by incorporation that periodicity into your trading plan and figuring out when to buy, sell, and hold.
In a bull market you are suppose to "buy the dip, and sell the rip." But not all dips are equal, a nd one thing that sets dips apart is divergence.
Divergence Primer
Normal Divergence (Trend Reversal)
Bearish: Higher highs on price action but lower highs on the indicator
Bullish: Lower lows on price action but higher lows on the indicator
Hidden (Trend Continuation)
Bearish: Lower high on the price action and higher highs on the indicator
Bullish: Higher low on the price action and a lower low on the indicator
We clearly see that we have some hidden bullish divergence. We can also clearly see that the RSI is "oversold" just 65 days after the bitcoin halvening. Historically this is a great time to buy.
A look at the 2016-2017 bull market shows buying hidden bullish divergence and/or when the RSI got to over-sold on the daily chart was a outstandingly simple but profitable time to put in some buys. Those price levels were NEVER reached again on a retrace.
Without exaggeration and irony after this pull back bitcoin may never return to this price again, give or take a day or so for a base to be put in. At this point, the only reason I can see to sell bitcoin is to buy alts that look good or because you have some bills that you must needs pay to remain solvent. But of course, I am not a financial advisor and even if I was, I am not your financial advisor.
My best call in a long time has been my FTM trade. FTMBTC recently itself just had the RSI go to over-sold and it looks like price action is turning previous wedge resistance into support. I have currently moved up the risk curve and am in a small cap coin that is out of the top 100 in market cap. So far its been painful but in the long run I think the rotation will pay off.

Elliot Wave 3-4 : FINAL Correction before NEW ATHI've been watching this bearish M-Pattern for some time, and I still believe this is a multi-month playout towards a new ATH:
This lines up with my initial correction target using Elliot Wave Theory:
We see a very clear Double Top play out in the Total Chart, also indicating that it's time for a correction:
HOWEVER - I expect the bulls to be ready and sweep in lower prices when the right support zone is reach (whale zone), which seems likely to be in the 40k zone. It won't be a straight line down - again, a multi-month playout is likely.
_______________________________
CRYPTOCAP:TOTAL BINANCE:BTCUSDT

Solana - TREND Indicators BEARISHUsing a Technical Indicator here which I use mainly to determine trend swings from a macro perspective. At least for the short term, SOL is bearish.
We've lost a long standing trendline that has held since October 2023, which is around the time that the bullseason started.
This will all largely depend on what BITCOIN does in the short term - more info on that HERE:
___________________________
COINBASE:SOLUSD

Sasol EnergyReason for execution
1)PML & PWL LIQUIDATED
2)+BOS & ChoCH
3)0.236 Fibonacci Retracement
4) positive OF
5)1.618 Fib Expansion
Should we buy PYR dip?PYR is at the best buying levels.
●Pyr is trading inside the Weekly FVG/BISI.
●We are in the Bull market so buying the dip make sense here.
●I know altscoins are down too much but remember these same altcoins will give 20×, 30× even 50× return in the peak bull market.
●Buy PYR here will give easy money.
●Pyr should never lose this fvg.
●In daily timeframe PYR created the Bullish divergence so its getting ready to pump.

NOTCOIN📊Analysis by AhmadArz: notcoin
In this technical analysis chart for the new token NOT/USDT, the price movement is clearly outlined. Currently, the token is priced around $0.007919 📉 and is trending upwards within the blue channel 🔵📈.
Key resistance levels are identified at $0.008822, $0.009911, and $0.011448 🔒. The analyst suggests waiting for the price to break above the $0.0114 level to anticipate another potential pump 🚀.
Additionally, a crucial support zone is marked between approximately $0.004800 and $0.005100 🛡️. If the price reaches this area, it could be considered a good buying opportunity 📈💰.
Overall, if the price can break through the mentioned resistance levels, there is potential for further increases. However, if it falls below the ascending channel and enters the lower support zone, caution is advised ⚠️.
🔗"Uncover new opportunities in the world of cryptocurrencies with AhmadArz.
💡Join us on TradingView and expand your investment knowledge with our five years of experience in financial markets."
🚀Please boost and💬 comment to share your thoughts with us!

*SMC* AUDUSD Top-Down Analysis ICT
Firstly, on the weekly TF , since April, the market showed a willing to climb to the FVG made in December 2023. We currently are in a premium relative to the low made in April to the high made in May. The Market could come all the way down to equilibrium and in a discount level but I would favor not going bellow the Breaker (which is the green box), in other words, staying above 0.65160. I would favor this option at the moment because the body of the weekly candle respected respected the body of the Breaker.
-----------------
Now let's go down to the Daily TF
As we can see, there is sellside liquidity at 0.65580 which I suspect we could see it being swept next week however, with my expectation of the DXY dropping eventually, I do not intend to take any short next week. ''Oh but I need to take a trade now!'' Okay, I understand completely, but sometimes we need to sit back and wait, and if I missed a trade so what? Most trader are unprofitable because of overtrading. Just bellow this level we have the Weekly FVG which overlay perfectly with a Daily FVG. Now, something I noticed is how the body of the OrderBlock made the April 12 correspond with the Equilibrium, which could become a strong PDArrays if the aussie dollar ever come to go lower than my expectation. Also, we can see that the MeanThreshold of the Daily OrderBlock of April 30, overlay perfectly with the low of the Weekly Breaker, adding confluence on why the price shouldn't go bellow the Breaker.
To sum up, The 0.67141 Level is very where my focus is rn, the price could (and most likely will) go bellow last week low taking out Sellside Liquidity, but I do not intend to take any short this week, if I do, I will probably split my risk in two. Tuesday we have ''Retail Sales m/m'' in the morning and later ''RBA Rate Statement'' which should bring a lot of volatility.
-------------------------------------------------------------------
Now let's take a look of the Fundamental of the Aussie, which is mostly relevent for the Weekly chart:
Fundamentally, the Australian dollars remains strong , with higher inflation than expected since April:
--------------------------------------
May 28, 2024 3.6% 3.4% 3.5%
Apr 23, 2024 3.5% 3.4% 3.4%
Mar 26, 2024 3.4% 3.5% 3.4%
Feb 27, 2024 3.4% 3.6% 3.4%
Jan 30, 2024 3.4% 3.7% 4.3%
--------------------------------------
Also, Australia is a commodity pair , meaning that the Futures Chart is correlated with commodities such as Gold, Silver.
Furthermore, with China demands for metals increasing it helps the AUD to gain value, as it exports lot of metals.
In addition, Seasonal tendency of the Australian Dollar is showing a bit of weakness during June before gaining strength in July.
As some of you saw my previous expectation for the DXY, the AUDUSD should respect the same idea in the direction of the market.
Here is the seasonality chart of the Australian Dollar Futures Seasonality:
www.google.com
----------------------------------------------
17. Provide a guarantee.
You warrant that the information created and published by you on TradingView is not prohibited, doesn't constitute investment advice, and isn't created solely for qualified investors.


You Must Watch Semiconductors vs. Nasdaq-100The chart below shows a simple equation: NASDAQ:SMH / NASDAQ:QQQ to gauge the relative performance of the Semiconductors (SMH) vs. the Nasdaq-100 index (QQQ).
The SMH ETF includes companies like NVIDIA and other leading chip manufacturers, which are critical to powering AI advancements.
On the other hand, the QQQ ETF comprises 100 major tech-related companies, including giants like Apple and Amazon, along with some semiconductor companies.
Although there is some overlap between the two ETFs, this comparison serves as a general gauge of the semiconductors' performance relative to the broader tech sector represented by the Nasdaq-100.
Observations on the importance of this comparison:
Sector Strength Insight: By analyzing the performance of semiconductors relative to the Nasdaq-100, investors can gauge the strength and potential of the semiconductor sector within the tech industry.
Investment Decisions: Understanding these dynamics can inform investment strategies, helping to identify whether to allocate more resources to semiconductor stocks or maintain a broader tech investment.
Market Sentiment: The performance ratio can also reflect market sentiment towards different tech subsectors, providing insights into which areas might be overvalued or undervalued.
Risk Management: Recognizing extreme levels in the performance ratio can help in risk management, indicating when semiconductor stocks might be overheating relative to the broader tech sector.
By keeping an eye on this ratio, investors can better navigate the tech landscape, making more informed decisions about where to focus their investments.

Momentum Trading In Agricultural CommoditiesMomentum trading, a strategy as old as the markets themselves, has found fertile ground in the sprawling fields of agricultural commodities.
As the seasons change, so do the prices of wheat, corn, soybeans, and other staples, tracing patterns as predictable as the migration of birds or the spring blossom.
This paper delves into these seasonal trends, uncovering how they can serve as reliable signals for astute investors looking to harness the power of momentum trading.
SEASONAL TRENDS IN AGRICULTURAL COMMODITIES
Mint Finance has previously highlighted some of these seasonal trends in Corn and Soybean in detail previously
In short, seasonal cycles in crop performance are linked to crop harvest cycles. Pre-harvest, inventory drawdowns tend to drive price higher while post-harvest, a glut of inventory tends to drive prices lower.
Corn
Corn prices start declining in June following the harvest in China (second largest corn producer) and Brazil (third largest corn producer). Prices reach their lowest in October, coinciding with the harvest in the US.
Over the past five years, corn prices have increased in the first half of the year before declining sharply in late June. In 2024, indexed price performance shows prices sharply lagging the seasonal trend as we approach the date on which prices generally declined the last five years.
Wheat
Wheat seasonality is less pronounced than other agri-commodities due to its relatively global distribution. Still, wheat prices generally rise during the first part of the year before declining in late June as all the major producers - China, Indian, EU, Russia, and US harvest crops during this period.
This year, wheat prices started the year off on a bearish note. After bottoming in early-March, prices started to rise sharply peaking in late-May. Mint Finance covered some of the factors behind this rally in a previous paper (Extreme Weather Sends Wheat Prices Surging). Prices have started to normalize in June, a few weeks before the seasonal price decline generally begins.
Soybean
Soybean prices generally rise during the first part of the year. In late-June, as the Brazil harvest reaches its peak, prices decline sharply. Prices remain subdued until September when the US crop is harvested.
This year, prices have sharply lagged their seasonal performance. Despite the rally in early-May driven by flooding in Brazil, prices remain lower than their level at the start of 2024. Moreover, the rally following the flood-driven rally has retraced a few weeks before the seasonal price decline generally takes place.
MOMENTUM TRADING IN AGRICULUTAL COMMODITIES
Investors can execute momentum trading strategies by leveraging these seasonal trends. In this context, momentum trading strategy refers to a relatively simple trading strategy where investors either buy or sell a futures contract at the start of the month based on the seasonal price performance during that month.
For instance, if seasonal trends show that June generally results in a price decline, the strategy would consist of going short on the commodity at the start of June and closing the position at the end of the month.
Although, at face value, this strategy may seem overly simplistic, its return and accuracy are surprisingly high.
The simulations are based on a position in the front-month futures, consisting of one contract of the agricultural commodity, opened at the beginning of the month and closed at the end.
Corn
For Corn, running the momentum trading strategy would have yielded average annual returns of USD 8,500 per year over the past five years (2019-2023). Crucially, performance of this strategy in 2024 is sharply lower as it would yield total PnL of just USD 63 this year.
Wheat
Similarly, for wheat, this strategy returned an average PnL of 4,650 per year during 2019-2023. So far in 2024, this strategy would have yielded USD 6,600 in wheat futures in 2024.
Soybean
In Soybean futures, momentum trading would have been the most successful over the past five years. This strategy would have yielded an average of USD 13,600 per year between 2019 and 2023. However, in 2024, this strategy would not have been successful as it would have resulted in a loss of USD 8,700 so far.
SUMMARY AND 2024 PERFORMANCE
It is clear that although this strategy is successful on a long timeframe, it is not necessarily profitable each month. For instance, the Soybean momentum trading strategy would have resulted in a loss in 2024 while Corn momentum trading strategy would have resulted in flat returns.
The reason behind this divergence from seasonal trend is clear when comparing the seasonal price performance charts at the start of the paper. Fundamental factors can result in broad-based trends throughout the year which can skew returns. For instance, as Soybean prices have been declining for most of 2024, a long position would have resulted in a loss regardless of seasonal trends.
As such, it is crucial to supplement this strategy using fundamental inputs on what the long-term price trend for the crop is. For a crop which is in a down-cycle, a long position would not make sense and vice versa.
In the near-term, all three crop’s prices tend to decline during July based on seasonal trends. However, the outlook for corn is most bearish. The latest WASDE report , suggested that USDA expects global corn production in marketing year 2024-2025 to reach 1,220.5 million metric tons compared to a forecast of 1,219.93 million MT last month. The increase in production comes from forecast for higher output from Ukraine and Zambia more than offsetting the decline in Russia.
Moreover, USDA forecasts a season average price of USD 4.4 per bushel which is lower than the current futures price of USD 4.57. Asset managers are also shifting their view on corn prices bearish once again as COT report showed asset managers increasing net short positioning last week.
Both fundamental and seasonal factors support a price decline in corn over the next month. However, seasonal trends are not exact. Particularly in 2024, seasonal trends have underperformed their usual returns from the last five years.
Investors can opt to use options instead of futures to express the same view of weakening prices. Options provide fixed downside risk and require only an upfront premium, avoiding the need to manage margins as futures prices fluctuate.
A long put position in CME corn options expiring on August 23 (ZCU24) can be used to gain downside exposure.
CME Corn puts are relatively cheaper compared to calls. Moreover, options IV (measured by the CVOL index) is lower compared to the peaks seen during the same time last year. An options position would benefit from both falling prices and rising IV.
Source: CVOL
A long put options position on corn futures presents fixed downside of USD 464 (USc 9.29 x 5000/100) and unlimited upside. A strike price of USc 430/bushel represents delta of -0.29. This position would break-even at USc 420/bushel.
MARKET DATA
CME Real-time Market Data helps identify trading set-ups and express market views better. If you have futures in your trading portfolio, you can check out on CME Group data plans available that suit your trading needs www.tradingview.com
DISCLAIMER
This case study is for educational purposes only and does not constitute investment recommendations or advice. Nor are they used to promote any specific products, or services.
Trading or investment ideas cited here are for illustration only, as an integral part of a case study to demonstrate the fundamental concepts in risk management or trading under the market scenarios being discussed. Please read the FULL DISCLAIMER the link to which is provided in our profile description.

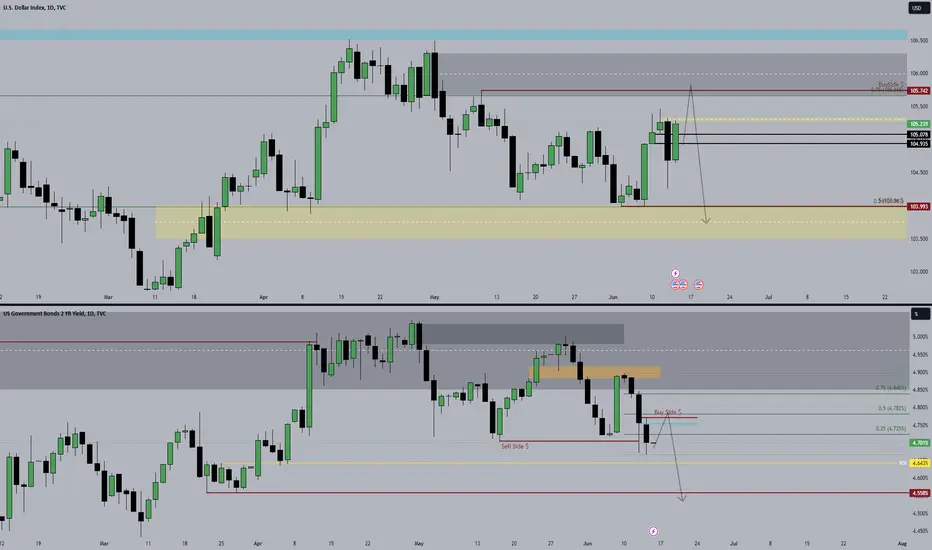
*SMC* DXY correlated with US02Y Bonds As we can see on the daily tf, DXY has created Relative Equal High at 105.459 which translate to this level being a liquidity pool. We are likely to see 105.459 being taken out put where can it go? As we can see, above 105.459, the closer PDArray is the OrderBlock (made the 30 Apr) which confluate with the 75% of the Dealing Range and another buyside liquidity pool at 105.742. I dont expect DXY to trade above the mean threshold of the OrderBlock and if it touched I expect a strong reaction to the downside.
Concerning the 02 year Bonds , the body has respected the OrderBlock (30 Apr) creating relative equal low which has been taken out (june 12). There is a ''crack'' in correlation right now between the DXY and the major Bonds of the US which leads me to think that there is a higher probability for the DXY to follow the Bound and drop lower.
Fundamentally, Powell has been pointing out the progress that has been made (which could eventually lead to a cut of rates) However, the ''Dot Plot' ' surprised the market of a likely to only 1 cut this year instead of 2-3 rate cut priced-in, which could be the reason why DXY has been going higher the last couple of days.
Downtrend in STRK getting weak!STRK downtrend is weakening.
●Strk creating another Bull Div.
●soon Bull will be in power.
●Never ignore this project.
●Took SSL and creating the Bullish Div on Daily timeframe.
Above we have weekly FVG/SIBI.
●In future that SIBI will act ad support once it is flipped.

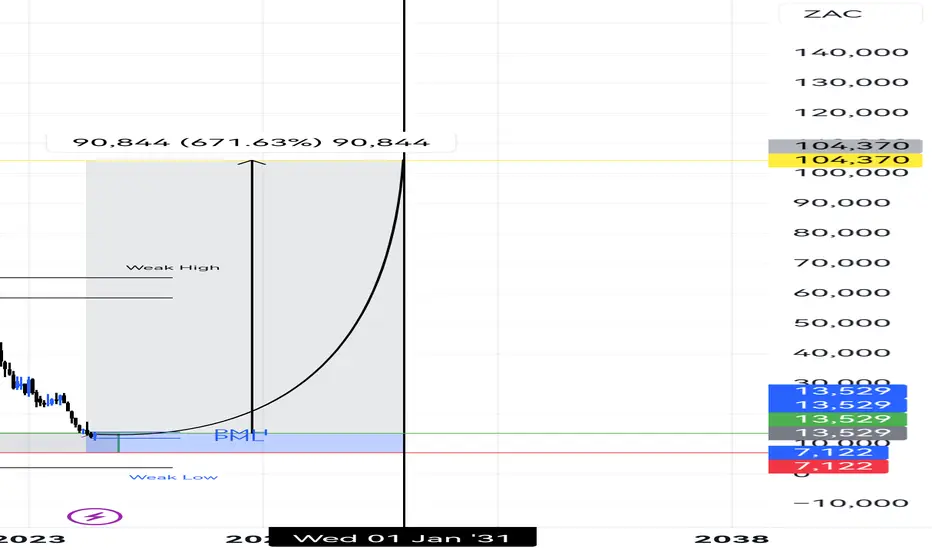
Bitcoin and the end of the bull cycle!At this moment, many might start reading this article thinking that the bull cycle is over, but that’s not the reason I’m writing. My intention here is to provide you with advance notice of the temporal zones where you should seriously consider realizing profits from your hold portfolios and even be prepared to look at selling in the market.
In the last cycles, this pattern has repeated, allowing us to replicate the projections.
In the first cycle back in 2012, after marking the bottom and the Halving, the price moved parabolically in two structures: the first, marked in aqua green, represents the post-Halving effect; the second, in red, represents the full euphoria effect.
This behavior repeated in the 2016 cycle and also in the 2019 cycle:
What’s most interesting is that, in all cases, the time between the market bottom and the Halving is exactly the same as the time between the Halving and the market top.
This is what I want to share with you: the points where the temporal zone suggests a possible inflection of movement or phase change.
This shows us that until mid-March 2025, we will be experiencing the post-Halving phase, and after this phase, we will enter the euphoria zone. The possible inflection point of the cycle should occur around mid-September 2025.
This study is based on analyzing the Fibonacci temporal zone and projecting the cycle based on symmetrical time behaviors from the past. This is not a guarantee that we will follow the exact same trajectory, but rather an additional basis for you to measure your exposure time to the cycle.
