BTC on going to 150k after halvingI'am waiting for BTC halving around at the end of April 2024 and then will bullish run going to 150k as a target.
Seasonality

When to Buy Crypto and Sell Assets (Vice Versa)This chart should illustrate a general idea of when you should be looking to offload your crypto investments in exchange for assets like real estate and luxury assets. And when to buy crypto and sell assets. I found an inverse correlation between DXY and BTC. Imagine DXY as an Asset Line Chart (orange) because DXY measure the strength of an asset against the US dollar.
Hopefully this helps!

expecting more drop Us30 will drop for more confirmation to the up slide that is price action from what my analysis is saying I will be expecting this pair to drop. so sorry i forgot to drop this setup yesterday but it is still playing out.

AAL recovery timeWith holidays approaching, the demand for travel could increase. This one has been sold off heavily until recent earning.
As you see on the chart, after latest earning reported, the down trend has ended.
This one could reverse to the way up.
Target 19.
This is not a financial advise but just an idea.

Natural Gas: Over storage due to recency bias?So far we’ve covered Natural Gas twice, once in October 2022 , followed by another in May 2023 .
As highlighted in both pieces we are generally longer-term bullish on natural gas but we do see some opportunities for a short-term tactical position now.
As winter approaches, the harrowing memories of natural gas price movements during the previous winter seasons keep us vigilant. Some key points we find interesting now include the natural gas storage levels in the EU and US, unseasonal weather, price seasonality, and natural gas price action.
Natural gas storage
Natural Gas storage typically follows two clear seasonal trends: the winter withdrawal season and the summer injection season, with the summer months being April to October and winter from November to March.
The chart below shows the storage level across time in the US. Current US Storage levels are close to the previous high in 2020.
While in the EU, current gas storage levels are the highest they've been over the last five years.
These high storage levels come off the back of a massive rally in natural gas prices in the 2021-2022 period. Which leads us to question, could this be attributed to recency bias? Have markets become over-prepared, with storage levels so high?
Unseasonal weather
One rationale for high storage levels is preparation for a harsh winter. The build-up of gas storage in the EU, particularly, was spurred by a warmer-than-expected start to the winter, resulting in less gas usage for heating.
Forecasts also predict the 2023 winter in the EU & US to be warmer than average. A recent Bloomberg article on Natural Gas states:
“Data generated by the Copernicus Climate Change Service signals a minimum 50% probability that most of Europe will experience well-above average temperatures between December and February. The Balkans, Italy and the Iberian peninsula have a 60% to 70% chance of exceeding median historical temperatures over the past three decades.”
The EIA adds:
“We estimate that U.S. natural gas inventories totaled 3,835 billion cubic (Bcf) feet at the end of October, 6% more than the five-year (2018–2022) average. We forecast U.S. natural gas inventories will end the winter heating season (November–March) 21% above the five-year average with almost 2,000 Bcf in storage. Inventories are full because of high natural gas production and warmer-than-average winter weather, which reduces demand for space heating in the commercial and residential sectors.”
High storage levels, coupled with lower-than-expected demand due to warm weather, could signal further weakness for Natural Gas…
Price Seasonality
Adding to this is the general price seasonality of Natural Gas. Over the past six years, the August to end-of-October period generally sees a gradual rise, followed by a decline from December to January. With this year’s price behavior aligning with past trends, we could very likely see a downturn in prices heading towards the end of the year and into January.
Price Action
On a longer-term time frame, the 3.610 level has repeatedly served as both support and resistance.
On a shorter timeframe, natural gas has been trading in a defined broadening formation, likely indicating increased price volatility.
To express our short-term bearish view, we can take a short position on the CME Henry Hub Natural Gas Futures at the current level of 3.089, setting the stop at the resistance above at 3.26 and take profit of 2.62. Each 0.001 point move in the Henry Hub Natural Gas Futures is for 10 USD.
The charts above were generated using CME’s Real-Time data available on TradingView. Inspirante Trading Solutions is subscribed to both TradingView Premium and CME Real-time Market Data which allows us to identify trading set-ups in real-time and express our market opinions. If you have futures in your trading portfolio, you can check out on CME Group data plans available that suit your trading needs www.tradingview.com
Disclaimer:
The contents in this Idea are intended for information purpose only and do not constitute investment recommendation or advice. Nor are they used to promote any specific products or services. They serve as an integral part of a case study to demonstrate fundamental concepts in risk management under given market scenarios. A full version of the disclaimer is available in our profile description.
Reference:
www.eia.gov
www.bloomberg.com
www.eia.gov
www.bloomberg.com
www.bloomberg.com
www.cmegroup.com

Short in CL, if 4h close below 80The COT Index provided a Sell Signal in the last weeks and bearish seasonality in 6 years and 9 years average. Bearish trend reversal confirmed with close of candle below support level (now resistane) on 3.11.2023:
1d and 4h show strong bearish reversal areas according to marketstructure. A 4h close will give a great oppertunity for short trade w take profit just above next strong suppot key level.
RR 1:1.5
Make your own decisions.

Just wait!After analyzing almost all the major pairs, I have just a few that follow my method.
One of these pairs is this. Not difficult, just wait for the price to come to your delimited zone in the proper schedule and enter, now just wait. As you can see, the entrance follows the structure. We will see if this is working.

Primer on Crude Oil Crack SpreadEver dreamt of being an oil refiner? Fret not. You can operate a virtual refinery using a combination of energy derivatives that replicates oil refiner returns.
Crude oil is the world’s most traded commodity. Oil consumption fuels the global economy. Crude is refined into gasoline and distillates.
Refining is the process of cracking crude into its usable by-products. Gross Processing Margin (GPM) guides refineries to modulate their output. Crack spread defines GPM in oil refining.
This primer provides an overview of factors affecting the crack spread. It delves into the mechanics of harnessing refining spread gains using CME suite of energy products.
UNPACKING THE CRACK SPREAD
Crack spread is the difference between price of outputs (gasoline & distillate prices) and the inputs (crude oil price). Cracking is an industry term pointing to breaking apart crude oil into its component products.
Portfolio managers can use CME energy futures to gain exposure to the GPM for US refiners. CME offers contracts that provide exposure to WTI Crude Oil ( CL ) as well as the most liquid refined product contracts namely NY Harbor ULSD ( HO ) and RBOB Gasoline ( RB ).
Crude Prices
Crude oil prices play a significant role in determining the crack spread. Refining profitability is directly impacted by crude oil price volatility which is influenced by geopolitics, supply-demand dynamics, and macroeconomic conditions.
Higher oil prices lead to a narrowing crack spread. Lower crude prices result in wider margins.
Expectedly, one leg of the crack spread comprises of crude oil.
Gasoline Prices
Gasoline is arguably the most important refined product of crude oil. Gasoline is not a direct byproduct of the distillation process. It is a blend of distilled products that provides the most consistent motor fuel.
Gasoline prices at the pump in the US vary by region. Price differs due to differences in state taxes, distance from supply sources, competition among gasoline retailers, operating costs in the region, and state-specific regulations.
CME’s RBOB Gasoline contract provides exposure to Reformulated Blendstock for Oxygenate Blending (RBOB). It is procured by local retailers, who blend in their own additives and sell the final product at pumps.
RBOB is blended with ethanol to create reformulated gasoline. It produces less smog than other blends. Consequently, it is mandated by about 30% of the US market. RBOB price is thus representative of US gasoline demand.
Each CME RBOB Gasoline contract provides exposure to 42,000 gallons. It is quoted in gallons instead of barrels. The contract size is equivalent to one thousand barrels like the crude oil contract.
Distillate Prices
Distillate or Heating Oil is another important refined product of crude oil. Distillate is used to make jet fuel and diesel. Demand for distillate products is distinct from gasoline demand.
A substantial portion of the North-East US lack adequate connection to natural gas. Hence, the region depends on HO for energy during winters making HO sensitive to weather.
CME NY Harbor ULSD contract ("ULSD”) provides exposure to 42,000 gallons of Ultra-low sulphur diesel which is a type of HO. ULSD contract is also equivalent to one thousand barrels.
Chart: ULSD Price Performance Over the Last Twenty Years.
TRADING THE CRACK SPREAD
The crack spread can be expressed using the above contracts in three distinct ways:
1) 1:1 SPREAD
This spread consists of a single contract of CL on one leg and a single contract of one of the refined products on the other. This spread helps traders to express their view on the relationship between single type of refined product against crude oil. It is useful when price of one of the refined products diverges from crude oil prices.
1:1 spread is also useful when there are distinct conditions affecting each of the refined products.
2) 3:2:1 SPREAD
This spread consists of (3 contracts of CL) on one leg and (2 contracts RBOB + 1 contract of ULSD) on the other leg. The entire position thus consists of six contracts. It assumes that three barrels of crude can be used to create two barrels of RBOB and one barrel of HO.
This trade is better at capturing the actual refining margin. It is commonly used by refiners to hedge their market exposure to crude and refined products.
3:2:1 spread is used by investors to express views on conditions affecting refineries.
3) 5:3:2 SPREAD
Spread consists of (5 contracts of CL) on one leg and (3 contracts of RBOB + 2 contracts of heating oil) on the other leg. This spread captures the actual proportions from the refining process. However, it is much more capital-intensive.
FACTORS IMPACTING CRACK SPREAD
Seasonality, supply-demand dynamics, and inventory levels collectively impact crack spreads.
Seasonality
Mint Finance covered seasonal factors affecting crude oil prices in a previous paper . In that paper, we described that crude seasonality is influenced by variation in refined products demand.
In summer, gasoline demand is higher, and, in the winter, distillate demand is higher.
Seasonal price performance of the three contracts is distinct leading to a unique seasonal variation in various crack spreads. Summary performance of the three spreads is provided below.
Chart: Seasonal price performance of Crude, its refined products, and their spread (excluding years 2008, 2009 and 2020 in which extreme price moves were observed)
Refiners strategically time their operations based on seasonal trends, ramping up refinery capacity ahead of peak demand in summer and winter. This involves building up inventories to meet anticipated high demand.
However, this preparation often results in a narrowed spread just before peak utilization. As the spread reaches its lowest point, refiners take capacity offline for maintenance.
Subsequently, crack margins begin to expand as refined product supplies dwindle, aligning with decreased crude oil consumption. This results in a gradually increasing spread through high consumption periods.
Supply/Inventories
Supply and inventories of crude oil and refined products influence crack spreads. When inventories of refined products remain elevated, their prices decline narrowing the spread.
When the production and inventory of crude oil is elevated, its price declines leading to a widening spread.
On the contrary, low inventories of refined products can lead to a wider crack spread and low inventories of crude oil leads to a narrower crack spread.
Demand
Refinery demand has a self-balancing effect as higher refining requires higher consumption of crude which acts to increase crude oil prices.
Demand for crude oil and refined products is broadly correlated. However, there are often periods when demand diverges on a short-term scale.
Economic activity and available supplies drive demand for refined products. During periods of high economic growth, refined product consumption is robust pushing their price higher.
Demand for refined products can precede or lag demand for crude oil from seasonal as well as trend-based factors. This lag can be identified using the crack spread. Sharp moves in crack spread pre-empt moves in the underlying which act to normalize the spread.
CURRENT CONDITIONS
There are two trends defining the crack spread currently:
1) Divergence in demand & inventories of gasoline and distillates: Low demand for gasoline is evident due to expectations of an economic slowdown while gasoline inventories remain elevated. Though, distillate consumption remains high as inventories are declining and lower than the 5-year average range.
Chart: Divergence in inventories of distillate and gasoline (Source – EIA 1 , 2 ).
Moreover, inventories of gasoline and distillates are higher than usual. Both factors together have led to a gloomy outlook for refined product demand. Gasoline stocks have started to increase while distillate stocks are still declining.
When refined product inventories are elevated investors can position short on the crack spread in anticipation of ample supply. Conversely, if refined product inventories are low, investors can position long on the crack spread.
Chart: Divergence in refined product inventories in US (gasoline rising and distillate declining).
2) Declining crude price and tight supplies: In September, Saudi Arabia and Russia announced supply cuts extending into January. Globally, this led to a supply deficit of crude oil. Supplies of crude in the US was particularly stressed as refiners increased utilization to build up inventories while margins were high and exacerbated by a pipeline outage.
Chart: Crude Oil inventories in US have stabilized in September and October.
Following increase in oil prices, refining activity has slowed, and supplies have become more stable.
When inventories of crude are stable or elevated, it indicates less demand from refiners. Investors can opt to position long on the crack spread anticipating ample crude supply.
Chart: US Refinery Utilization and Crude Inputs have slowed in October.
Although, crude oil supply cuts from Saudi are going to continue until January 2024, there is no longer a deficit as consumption has slowed down.
Together, both trends have caused a sharp collapse in the crack spread. Value of the 3:2:1 crack spread has declined by 50% over the past month.
Prices of refined products have been affected more negatively by low demand than crude oil. Inventories and supply situation for refined products is more secure than crude oil. Still, seasonal trends suggest an expansion in crack spread once refined product inventories start to be depleted.
HARNESSING GAINS FROM CHANGES IN CRACK SPREAD
Two hypothetical trade setups are described below which can be used to take positions on the crack spread based on assessment of current conditions.
LONG 3:2:1 SPREAD
Based on (a) sharp decline in crack spread which is likely to revert, and (b) seasonal trend pointing to increase in the crack spread, investors can take a long position in the crack spread. This consists of:
• Long position in 2 x RBF2024 and 1 x HOF2024
• Short position in 3 x CLF2024
The position profits when:
1) Price of RBOB and ULSD rise faster than Crude.
2) Price of Crude declines faster than RBOB and ULSD.
The position looses when:
1) Price of Crude rises faster than RBOB and ULSD.
2) Price of RBOB and ULSD declines faster than Crude.
• Entry: 63.81
• Target: 79.12
• Stop Loss: 55.73
• Profit at Target: USD 45,930 ((Target-Entry) x 1000 x 3)
• Loss at Stop: USD 24,240 ((Stop-Entry) x 1000 x 3)
• Reward/Risk: 1.89x
LONG 1:1 HEATING OIL SPREAD
Based on relative bullishness in distillate inventories plus stronger seasonal demand for distillates during winter, margins for refining heating oil will likely rise faster than gasoline refining margins. Focusing the expanding crack margin on a 1:1 heating oil margin spread can lead to a stronger payoff.
This position consists of Long 1 x HOF2024 and Short 1 x CLF2024 .
The position profits when:
1) Price of ULSD rises faster than Crude.
2) Price of Crude declines faster than ULSD.
The position will endure losses when:
1) Price of Crude rises faster than ULSD.
2) Price of ULSD declines faster than Crude.
• Entry: 36.15
• Target: 42.79
• Stop Loss: 32.3
• Profit at Target: USD 6,640 ((Target-Entry) x 1000)
• Loss at Stop: USD 3,850 ((Stop-Entry) x 1000)
• Reward/Risk: 1.72x
KEY TAKEAWAYS
Crack spread refers to the gross processing margin of refining (“cracking”) crude oil into its by-products.
Refined products RBOB and ULSD can be traded on the CME as separate commodities. Both are representative of demand for crude oil from distinct sources.
There are three types of crack spread: 1:1, 3:2:1, and 5:3:2.
a. 1:1 can be used to express views on the relationship between one of the refined products and crude.
b. 3:2:1 can be used to express views on the refining margin of refineries.
c. 5:4:3 can give a more granular view of proportions of refined products produced at refineries but is far more capital-intensive.
Crack spreads are affected by seasonality, supply, and inventory levels of crude and refined products, as well as demand for each refined product.
A low-demand outlook for refined products of crude is prevalent due to expectations of an economic slowdown.
MARKET DATA
CME Real-time Market Data helps identify trading set-ups and express market views better. If you have futures in your trading portfolio, you can check out on CME Group data plans available that suit your trading needs www.tradingview.com
DISCLAIMER
This case study is for educational purposes only and does not constitute investment recommendations or advice. Nor are they used to promote any specific products, or services.
Trading or investment ideas cited here are for illustration only, as an integral part of a case study to demonstrate the fundamental concepts in risk management or trading under the market scenarios being discussed. Please read the FULL DISCLAIMER the link to which is provided in our profile description.

$PUBM ceilings and drop zonesFrom earnings to earnings, PUBM is dropping to new drop zones.
Charts show, between each drop zone, it sheds about 23-33% share price.
Even though their fundamental value come closer to 11.8$ / share, their Net Income is dropping massively.
On top of a headwind against overall Tech stocks, and Ad Tech industry, perhaps only reason why PUBM is still holding most of it's value is because of less debt.
Although, not sure how the stock is set to respond to first ever anticipated negative eps in 2023, which goes shoulder to shoulder with decade's high interest rates for the last quarter between 3.5% - 4.5%
Additionally, between their gross margins having dropped significantly, a decade high inflation, continued rise of interest rates - potentially up to 5.25%, we can expect next few quarters of negative growth.
This clearly calls for further downside of at least 50% (just by assuming 2 quarters of negative growth) - the book value from there isn't as far, which would still continue to drop.
Hence, setting 7.54$ as next 6 month's price target for PUBM!!!

Ethereum moment like never before 👀ETH does not have such a long history as Bitcoin, so cycle analysis is limited to the past cycle only. And we have a problem, last time there was a black swan.
In order to compare with the previous cycle, I corrected the situation as it would have looked, if no unlikely events had happened. 🪄
💡What can be seen is that after the end of the accumulation phase, the CRYPTOCAP:ETH comes out from under the baseline, the Keltner channel, and consolidates for some time above it, knocking out the last impatient passengers before the bull run.
Rather, something similar awaits us.

🚀 LINK: Altseason Cheat Sheet🚀Hope: The Beginning of the Journey
LINK's recent movements align with the 'Hope' phase. During this stage, the asset typically experiences a modest increase, fueling optimism among traders. LINK's price action, coupled with positive sentiment, lays the foundation for what might unfold as a remarkable altseason journey.
Optimism to Belief: LINK's Ascension
As LINK transcends the initial hope, it inches toward the 'Optimism to Belief' stage. Here, we witness a more substantial rise in price, solidifying the confidence of early investors. This phase often attracts more attention, drawing in traders who transition from hopeful observers to active participants.
Thrill: A Rally of Excitement
The 'Thrill' stage, characterized by a rapid ascent in price, is where LINK is heading next. This phase brings a surge of excitement and enthusiasm, propelling the asset to new heights. Social media platforms buzz with discussions, and the community celebrates LINK's impressive performance.
Euphoria: The Pinnacle of Excitement
The final destination, 'Euphoria,' awaits LINK at the peak of altseason. This phase witnesses an exponential price increase, reaching levels that captivate the broader market's attention. During euphoria, FOMO (Fear of Missing Out) kicks in, attracting both retail and institutional interest.
Trading Strategy: Navigating LINK's Altseason
For traders, understanding the psychological phases of altseason can be a valuable tool. Strategic entries and exits, risk management, and staying informed about market sentiment are crucial elements for navigating LINK's journey through the altseason cheat sheet.
Conclusion: Altseason's Tale Unfolds
As LINK progresses through these phases, the broader crypto community watches with anticipation. Each move on the altseason cheat sheet brings unique opportunities and challenges. Traders and investors alike must stay vigilant, adapting their strategies to the evolving narrative of LINK's altseason journey.
🔗 LINK Analysis | 🚀 Altseason Strategies | 💡 Investor Insights
❗See related ideas below❗
Are you riding the altseason wave with LINK? Share your thoughts, experiences, and strategies in the comments!💚📈💚

Update Gold 9/11Update Gold 9/11
Gold is currently confirmed to be down, but when it reaches 1905, it will meet the red daily line. There is a possibility that this month there will be a significant correction so we can collect the goods we bought at 1909 and take profits in 2006 according to two ideas. thought below

What's up with Altcoins 👀Let's look at the TOTAL3, as you can see from Fibonacci, this cycle of altcoins sold off much stronger, they did not test the 0.5 zone.
Even if we take into account the growth of stablecoins, altcoins still look oversold and I would expect an exit from the 0.23 zone.↗️
🧐Many alt-season skeptics say that #bitcoin dominance still has room to grow, here I can say that stablecoins and a larger alt-season in 2021 should be taken into account, this has not happened before. Therefore, if these factors are taken into account, the dominance of Bitcoin is now at quite high levels. This is also a possible positive for altcoins.

DIS Consolidation/ PullbackI am looking for a pullback to the middle of this channel. I don't think this move will hold and break out this downward channel yet.

QQQ False BreakoutBuying PUTs on the QQQs
QQQ DEC 22
370 PUT LIMIT $7.55
Thesis:
Sesonality, stocks tend to pull back mid-October in pre-Election Years.
RSI tuned negative even though reaching a higher high on the QQQs.
Big tech names like TSLA, NFLX tightening after big moves up.
False breakout of the lower channel matches today's pivot at the top of the channel. (Purple boxes.) False breakouts happen at both channels' ends by the same measured moves.
374 area was firmly rejected previously. Strong resistance.

XAU Weekly - BearishThis Week we Say OANDA:XAUUSD was Super Bullish, But is It?
gold has Engineered Liquidity up and Down, I believe its going up to Hit Retail Stop loss and then Revert to go Down .
I have noted Levels that I am interested in Chart
Another Confirmation : If you Check #Gold Seasonality, Normally OANDA:XAUUSD is Bearish in October and November !
Disclaimer : this is Just Technical Analysis, You Should never use this information for real Trading, Do your own Research.
Sincerely,
Sobhan JTN

Nasdaq is about to tank 10% or more
13088 -- shorted 2 micros. Should be able to make nearly $10,000 on this trade.
The Nasdaq falling to this level is nearly an inevitability at this point. There is no other logical move. There is no other possible scenario. This is happening. Period.
CME_MINI:NQ1!

UNG ACCUMULATION?Seems to be a Darvas box being formed. With wars being fought overseas it's very possible commodities could begin a bull run. This is a good range to slowly accumulate as macro plays out.

BTC Dominance to 60%I'm seeing BTC.D break to the upside, consolidate, repeat. I'm following this until it reaches 60% dominance, then altcoins become worth the risk.

USDJPY longprice have shown a huge drop on friday before market close, market opened and saw this trade after TOKYO sesh open, price made a nice FVG zone on 15min TF and thats a great enter for long to fill out the imbalance im expecting the price to fly this monday, if you dont like limits you can wait for a great confirmation on a lower TF like 5min or 1min chart

Bitcoin oversold by RSI 👀Are we now headed for correction or continued growth?
In the moments between the bottom and the halving, this period also often coincides with the accumulating phase, where CRYPTOCAP:BTC enters the oversold rsi, which is accompanied by a local peak or midcycle peak as in 2019.
💡From the point of view of RSI, our situation is more similar to the period before the halving in 2016. Also, at this moment, the price breaks through the baseline on the Kaltner channel and for some time consolidates above it.
Closer to the halving, it goes to the next zone, in our case, such a zone can be 40k+↗️

VNINDEX long term plan (2024-Q4 to 2025-Q2)This is my idea about VNINDEX long term plan.
Time range: 2024-Q4 to 2025-Q2.
- Expected to continue its upward trend in Q4 2024, reaching a new record high of 2,000 points by the end of the year, driven by strong earnings growth, low interest rates, and positive market sentiment.
- In Q1 2025, the VN-Index may face some correction and consolidation, as investors take profits and adjust their portfolios for the new year. The index may fluctuate between 1,800 and 2,100 points, depending on the macroeconomic situation and global events.
- In Q2 2025, the VN-Index may resume its rally, supported by the recovery of the tourism sector, the acceleration of the vaccination program, and the implementation of new infrastructure projects. The index may surpass 2,200 points by the end of the quarter, setting a new historical milestone.
The Information is not an finance advice.

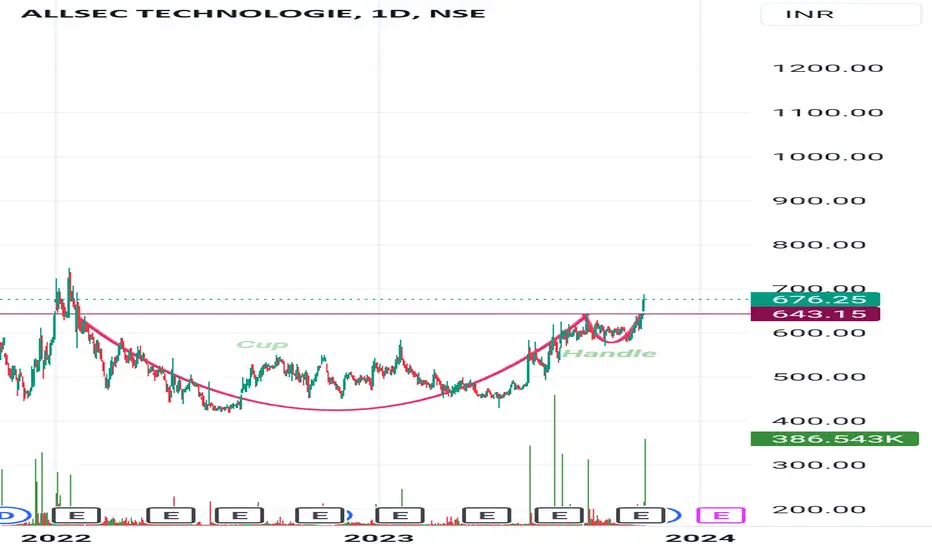
Cup with handle
Incorporated in 1998, Allsec Tech is a global leader in outsourcing solutions offering future-ready, resilient business transformation services to industry heavy-weights, Fortune 100 companies, and growth-focused organizations. The services provided by the Company include data verification, processing of orders received through telephone calls, telemarketing, monitoring quality of calls of other call centers, customer services and HR and payroll processing. The Company has delivery centers at Chennai, Bengaluru and NCR.
With 4,000+ FTEs spread across 5 contact centers in the US, Philippines, and India, the company manages over 1 Million customer contacts per day, via multiple touchpoints.