EURAUD, Bullish Bias, Fundamental and Technical AnalysisFundamental Analysis
1. Seasonality shows bullish momentum in EURAUD from 10 Apr to Mid of May
2. COT data shows net positions reduction in AUD while Increasing in EUR
3. Overall score of EUR is bullish and AUD is bearish
Technical Analysis
1. EURAUD broke 2 year Rectangular consolidation box
2. strong breakout appear
3. Bulls are in charge
4. Waiting for retest of breakout for entry
5. 1st buy 1.74 with Sl 1.704,
2nd buy if SL hit of 1st buy, entry @ 1.68 with SL 1.634 increase risk to 2%
Seasonality

ADOBE buy BiasWith the current bearish move on the NASDAQ - we can expect Adobe to move towards that weekly/daily Demand zone and fill a Long position to the upside.
Vaulation and seasonality align with stocks and indices - we should find a bottom to this drop on all indices Mid-End of April 2025.
Trade safe!

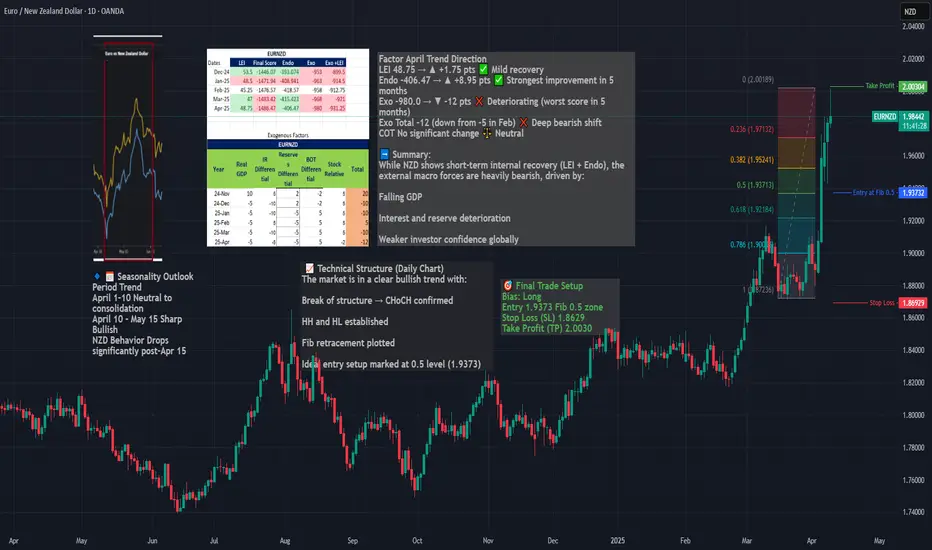
Long EURNZD – Seasonal, Fundamentals & Technical ConfluenceWe are entering a long position on EURNZD, capitalizing on a powerful confluence of:
Seasonal EUR strength + NZD weakness (April 10 – May 15)
A clear bullish market structure (CHoCH, HH/HL)
A clean Fibonacci retracement entry at 0.5
Strong macro divergence, with NZD exogenous conditions deteriorating
Macro & Seasonal Context
EUR enters a strong seasonal uptrend from April 10 to end of month
NZD shows seasonal weakness from April 15 onward
NZD’s exogenous model score worsened to -12 in April
While NZD LEI and endo improved, it remains structurally weak
Timing
Best execution: on pullback to 1.9373 zone, ideally between April 10–15, aligned with seasonal entry window.
a breakdown of the 6 month channel
"On the yearly chart, gold is near its trading high, and on the 6-month chart, it's near a support floor. There's a high probability of the support breaking."
Here's a slightly more formal way to phrase it, which might be used in a trading context:
"On the annual timeframe, gold is trading close to its resistance peak, while the 6-month chart shows it nearing a support level. The likelihood of this support being breached is quite high."

Tweet and idea (you can use it for prediction)Tweet and idea (you can use it for prediction)
💡 This trading idea is based on analyzing market reactions to news and tweets from influential figures — especially in the context of cryptocurrencies and stocks prone to speculative spikes.
📊 Core Strategy:
The model tracks sudden price movements triggered by public statements (e.g., tweets from Elon Musk, breaking news, etc.). After the initial reaction, a retracement or continuation pattern often forms, which can be used to enter a trade.
🧠 How to use it:
1. Monitor the news flow or social media activity related to the asset.
2. Identify the initial impulse on the chart (high volume, sharp movement).
3. Wait for consolidation or a minor pullback.
4. Enter on breakout or bounce, using a tight stop-loss.
📌 Best suited for high-volatility assets with frequent hype triggers (e.g., DOGE, TSLA, BTC).

EURUSD, Bullish Bias, Fundamental and Technical AnalysisFundamental Analysis
1. Endogenous factors of EURO is getting better while USD is down
2. Seasonality shows EURO bullish in April while USD bearish
3. increased pressure of interest rate cut in USD in also leading towards DXY bearish
4. COT data shows net increase in EUR and decrease in USD
5. Sentiments shows bullish in EUR 11/8, while USD is 4/5.
6. LEI, Endogenous and Exogenous factors all in favor of Bullish momentum in EURUSD.
Technical Analysis
1. Cup and Handle Formation
2. Breakout appeared
3. Breakout Retest
4. Buy in parts
i. Long 1% at current price
ii. Long 1% @ 1.09017
5. Stop loss below Handle
6. Projection Target 1.165
7. Take profit on Major resistance levels

$QQQ Has Officially Entered a Bear Market $SPX is CloseNASDAQ HAS OFFICIALLY ENTERED A BEAR MARKET, DOWN ~22%
NASDAQ:QQQ 2022 Bear Market bottomed ~37%
just below the 200WMA
S&P 500 is not quite there yet, down only ~17.5%
SP:SPX 2022 Bear Market bottomed ~27% a tick below the 200WMA

Short Idea On GBPCADBased On :
- Cycles and quantitative analysis
- supply zone
- Small speculators buying at extremes so we do the opposite

ETH Is Oversold Like Never Before !Hello Traders 🐺
In the recent week, we saw a massive long position wipeout, especially in the stock market.
However, despite all the rumors, BTC held itself at these levels and is still inside a falling wedge pattern.
If you don't know what I’m talking about, you can check my last idea about it.
But ETH!
In my opinion, this is a huge discounted price for ETH.
You know why?
1_ Monthly RSI is currently at 25, which means we’re in an extremely oversold situation, and this usually means bulls are about to come back.
Yes — we have all the signs of a reversal from here:
(A): BTC.D RSI is at an all-time high and forming a bearish divergence, meanwhile:
(B): ETH/BTC is extremely oversold right now.
(C): BTC itself has formed a falling wedge pattern right above the weekly Cup & Handle neckline support!
Guess what?
If you zoom in a little bit on the daily chart, you can see there’s a pattern to break, and price is currently too close to the edge of it —
which means time is ticking for ETH, and we are about to see an explosive move.
Probably to the upside, because of all the signs we’ve talked about above.
I hope you enjoyed this idea — and as always, don’t forget our goal:
🐺 Discipline is rarely enjoyable, But almost always profitable 🐺
🐺 KIU_COIN 🐺

why Robinhood’s stock ($HOOD) could be considered bullish:Analyst Upgrades : Robinhood has received positive upgrades from analysts, with a target price suggesting a significant upside. The company's growth in digital wealth management, AI-powered investing, and new banking features contributes to these bullish forecasts.
Strategic Investments : High-profile investors, such as Cathie Wood’s ARK Invest, have increased their stake in Robinhood, signaling strong confidence in its future growth potential.
Product Diversification: The company continues to expand its services, with new offerings like Robinhood Strategies, an affordable robo-advisor, which is expected to attract a broader customer base seeking wealth management solutions.
Positive Analyst Sentiment: Robinhood has an average "Buy" recommendation from analysts, reflecting general market optimism and the stock's positive outlook over the next 12 months.
Strong Earnings Growth: Robinhood's robust revenue growth rate (over 58% in the last 12 months) reflects its expanding market share and the potential for continued financial success.
Analyst Price Targets: Multiple analysts have set a price target for Robinhood with significant upside potential, indicating that there is room for further price appreciation in the coming year.
Market Positioning: Following political shifts, Robinhood's stock has benefited from increased interest in cryptocurrency trading and favorable market conditions, showing how external factors can favor its performance.
Technological Advancements: Robinhood’s investment in AI tools like Robinhood Cortex enhances its platform’s value proposition, improving user experience and engagement, which could lead to increased retention and growth.
Diversified Revenue Streams: Robinhood’s move into banking, offering high-yield savings accounts, allows the company to tap into new revenue streams, reducing its reliance on traditional brokerage commissions.
Favorable Market Sentiment: Robinhood is seen as part of a broader trend of stocks benefiting from shifts in market sentiment, particularly around the "Trump trade," showing how political and economic cycles can impact stock performance positively.
These factors together suggest a promising outlook for Robinhood’s stock, positioning it for continued growth and potential upside.

AAVEUSDTAAVE in buying area, blue demand, time to buy this asset.
lending& borrowing i think good project.
hold this asset till Q4

DXY | Major Cycle Peak – Is the Dollar Losing Its Grip?The U.S. Dollar Index (DXY) appears to be following a well-defined historical cycle, marking major peaks approximately every 15–20 years. If history repeats, the 2022 peak near 114 could signal the beginning of a multi-year dollar decline, impacting global markets, commodities, and currency pairs like EUR/USD.
Historical Peaks & Reversals
Examining past DXY cycles, we see:
969 Peak (~120): Followed by a prolonged decline into the 1970s.
1985 Peak (~165): Marked by the Plaza Accord, triggering a sharp dollar downtrend.
2001 Peak (~120): Led to a multi-year decline as the Fed shifted policies.
2022 Peak (~114): The most recent high—could it mark the next major reversal?
Each peak historically aligns with aggressive Fed tightening cycles, followed by a shift towards easing policies, leading to a weaker dollar. With U.S. interest rates expected to plateau or decline, this pattern suggests a potential long-term bearish trend for the dollar.
Implications of a Weaker Dollar
Bullish for EUR/USD – A declining DXY typically strengthens the euro.
Boost for Commodities – Gold, oil, and other dollar-denominated assets could rally.
Stronger Emerging Markets – A softer dollar eases financial conditions globally.
With DXY showing signs of a historical cycle peak, investors and traders should watch for confirmation of a multi-year downtrend, potentially reshaping global markets.

EUR/HUF: Positioning for a Probable Bullish Trend ShiftBig Picture Context
Currencies, like any market, move in cycles driven by macroeconomic forces, capital flows, and investor psychology. The EUR/HUF exchange rate has been in an uptrend since mid-2023, reflecting a broader structural shift. The key question now is whether this trend continues or if we see a meaningful reversal.
Looking at the data, we see that price has pulled back to a critical support zone (396-402 HUF). This is where buyers previously stepped in, making it a high-probability area for renewed strength. Meanwhile, resistance levels exist at 409.5 HUF, 411.75 HUF, and 420.53 HUF, with an ultimate target near 434.45 HUF.
What the Market Is Telling Us
Liquidity & Positioning: A volume spike signals increased market activity. This is often a sign that larger players are repositioning.
Momentum & Trend: Higher lows and price support at moving averages indicate that bullish sentiment remains intact.
Sentiment & Reflexivity: If buyers step in at support, it could reinforce the uptrend, drawing in more participants and accelerating price movement.
Game Plan: Managing Risk & Reward
Entry Zone: 396-402 HUF (buy into strength if support holds).
Profit Targets:
First milestone: 409.5 HUF (short-term test of resistance).
Second milestone: 420.5 HUF (trend continuation).
Final milestone: 434.5 HUF (full breakout scenario).
Stop-Loss: Below 382 HUF, where the bullish thesis breaks down.
Principles Applied
Markets are a function of supply and demand, shaped by human behavior. We’re looking at probabilities, not certainties. The key is risk-adjusted decision-making—placing asymmetric bets where upside outweighs downside. If the support holds, the next move up is likely. If it fails, we step aside and reassess.

AAVE Longterm pickNot going to dive too deep, but I genuinely believe DEFI is set to explode in the future! AAVE is definitely one of my favorites, along with UNI and a couple of others that are on my radar. Anyway,
Looking at the long-term Fibonacci targets, they suggest (850-1300-1750) will happen eventually. I’m not sure how long it will take, but I’m all about keeping my eyes on the prize!
What are your thoughts? Let’s get a discussion going! Don’t forget to like and share! 🚀💥

LULU / Lululemon Buy ScenarioMy guts and the seasonality over 10 years of past data suggest that it is a good idea to long LULU. Today is a strong up-day after an inside bar that gives you good calculation for risk management.
let s soo how this goes!
This is not a trade call.... all on your own risk. Trade what you know, understand and see not what people tell you...
leave a like or comment!
Cheers!

DELL Buy Scenario with helping 0.618 retracement - price moved up recently
- now retraced to the 0.618 fib
- my calendar says: 31th or march is a strong starting point for a high properbility upmove
maybe you wanna find your entry soon on some criteria you know, understand and learnt to trade?
let ' s discuss and feel free to hit that rocket symbol and leave a comment. this way it is more fun.
cheers!

Here's Why I'm Bullish on TSLA: Smart Money is Buying...Here's Why I'm Bullish on NASDAQ:TSLA Multi-Timeframe Analysis Using Larry Williams' Methods
After a significant downtrend, NASDAQ:TSLA is presenting multiple bullish signals based on Larry Williams' methodology. The weekly and daily timeframes are aligning for a potential reversal opportunity with clearly defined risk parameters.
Weekly Timeframe Analysis
The weekly chart reveals several key bullish indicators:
- The COT Proxy Index shows commercials are buying at significantly higher levels compared to 6 months ago, 1 year ago, and 3 years ago.
- Seasonality patterns have reached a turning point, now indicating the beginning of an uptrend phase
- The WillVal indicator shows NASDAQ:TSLA is currently undervalued at multiple securities (DXY, QCCH, ZBLU all showing "Under")
- ADX reading above 60 (currently at 62.42) signals the existing downtrend is likely exhausting and nearing completion
Daily Timeframe Analysis
On the daily chart, we're seeing initial confirmation signals but still waiting for the optimal entry setup:
- The general market has created a Rally Day, and we're now watching for a Follow Through Day to confirm the new uptrend
- Price structure requires further confirmation through a change of character before entry
- The ProGo indicator has already turned positive, providing an early bullish signal
- Williams %R is showing oversold conditions, suggesting a potential bounce
- We need the Large Traders index to turn its slope upward for additional confirmation
Entry Strategy
I'm looking for one of these entry triggers:
- Primary : First pullback after change of character , using Williams %R for precise timing
- Alternative : Entry on first pullback after price moves above the WillTrend line
- Aggressive option : Entry if price breaks above the $245 resistance level
Profit Targets & Risk Management
Targets:
- First target: $327 (1.27 Fibonacci level)
- Second target: $390 (Larry Williams Target Shooter -> 2.00 Fibonacci level )
Risk Management:
- Initial stop loss: $228 or 120% of ATR(3) from entry point
- Once in profit, trailing stop based on price closes at WillTrend levels
The confluence of indicators across timeframes suggests a significant reversal potential in NASDAQ:TSLA , but waiting for daily chart confirmation will provide a higher probability setup with clearly defined risk parameters.
DISCLAIMER
This analysis is provided for informational and educational purposes only. The ideas and strategies presented should never be used without first assessing your own personal and financial situation. This content is not financial advice and should not be construed as a recommendation to buy, sell, or hold any securities or to engage in any specific investment strategy. All investment carries risk, including the possibility of losing some or all of your initial investment. Past performance of securities, including the patterns, signals, and indicators discussed, is not indicative of future results. The author does not guarantee the accuracy, completeness, or usefulness of any information presented. Each investor should conduct their own research and consult with qualified financial professionals before making investment decisions. Trading Tesla ( NASDAQ:TSLA ) stock involves significant risks that may not be appropriate for all investors. You should only invest funds that you can afford to lose.

The XRP Bull Run Starts Today (XRP to 3 Digits)XRP is following it's 2017 pattern very closely and it looks like it's about to turn around.
The resemblances between March 2017 and March 2025 are numerous. Should the 2017 pattern hold, we might expect XRP to reach double-digit levels in April, approach triple digits in late May or June, and peak in late 2025 or very early 2026.
Both macro and micro factors indicate that a significant bull run is around the corner.
P.S. I view the November surge as merely the release of regulatory pressure that had been suppressing XRP, allowing it to return to the level it might have achieved without such constraints.

BTC will history repeat?Pointing out the possible repeating pattern which might more or less copy the moves from 2024. Deeper correction obvious due to general market sentiment which may led to stronger uptrend at the end.

SPX - Where Rebound?Possible reversal level is at the lower boundary of the channel in wave 4 of the upper order

MSTU Long term retiring ideaThe MSTU ETF offers double exposition to the ticker IG:NASDAQ MSTR, now called Strategy, and this year many call a greater bull run on Crypto assets. I have done myself a mathematical model which gave me the conclusion similar to what Michael Saylor thinks:
I think I'm going to retire on the MSTU ETF, considering it 0.35 of my Portfolio and adding into it.
For the short term, consider buying on a strong support using an ATR (Average True Range) Indicator which tells you where to buy, and considering the support on a high historical trading activity with Market Profile terminology. Not bad for doing DCA at the swing lows formed.
Not financial advice!

Why Going Long on SoFi Stock SoFi Technologies (SOFI) is at a pivotal moment, presenting a strong long opportunity as it enters the 5th wave of an Elliott Wave cycle. This final leg typically brings explosive upside momentum, signaling a potential breakout.
While a brief dip below $10 is possible, this could act as a springboard for a powerful rally toward $20 and beyond. The stock's bullish structure, combined with SoFi's growing financial services business, makes it an attractive bet for long-term investors.
With momentum building, now may be the perfect time to go long on SoFi before the next surge begins.
🚨 This is not financial advice. Do your own due diligence (DD) before making any investment decisions. 🚨

"Bitcoin's Bullish Reversal: Projected Pullback Before Surging TBitcoin has begun a downward trend from March 24th that could last 49 days, with a projected low near $75,000. This area may offer a strong entry point for swing traders aiming for the next leg up. If support holds, BTC could rally over the following 149 days toward a profit target of $154,000 — a potential 100%+ gain. Traders considering this move should watch for signs of reversal near $75K and manage risk with a stop loss just below $70,000 to protect against deeper downside.
