XRP IF SEC WASNT EXISTEDnext steps for us are:
0.56$
0.84
acording with Rdi there is a 30% posibility to bounce the 50% level and next 0.56$ will be reached
1$ something in August if there was no Sec.
If Ripple wins, trow this analysis, we will need another
SEC

October 13 BTCUSD BingX Chart Analysis and Today's HeadlineBingX’s Bitcoin Chart
According to the Crypto Losses Q3 2022 Report released by Immunefi, the crypto industry lost $2,328,917,230 so far in 2022. Bitcoin is up 0.63% over the last 24 hours and rose to an intraday high of $19,239.86. The producer price index increased 0.4% for September, compared with the Dow Jones estimate for a 0.2% gain. This suggests that inflation is yet to respond to the Fed’s monetary tightening. Investors will be focusing on Thursday's CPI report, which is expected to show annual inflation increasing 8.1%. If the CPI is worse than expected, the BTC/USDT pair could drop into the $18,125 to $17,622 support zone.
Today’s Cryptocurrency Headline
Yuga Labs Faces Investigation From the SEC
Yuga Labs, creators of Bored Ape Yacht Club NFTs, is facing a probe by the U.S. Securities and Exchange Commission into whether sales of some of its offerings violate federal law. The regulator is investigating whether certain assets released by Yuga Labs could be treated more like stocks and therefore should follow the same rules as stocks. Yuga Labs said in an email that it is committed to fully cooperating with any investigation. The opening of the probe is not a foregone conclusion; Yuga Labs has not been accused of wrongdoing and the probe may not result in a legal battle. It sits within the concept of wider scrutiny by the regulator over crypto-related activities.
Disclaimer: BingX does not endorse and is not responsible for or liable for any content, accuracy, quality, advertising, products, or other materials on this page. Readers should do their own research before taking any actions related to the company. BingX is not responsible, directly or indirectly, for any damage or loss caused or alleged to be caused by or in connection with the use of or reliance on any content, goods, or services mentioned in the article.

XRR - RIPPLE / USDTXRP -RIPPLE seems to be doing a flat "ABC" correction as a rule that waves "A" and "B" must have 3 moves and wave "C" must have 5 moves to finish the correction, now RIPPLE is in a lawsuit against the Securities and Exchange Commission (SEC) since they want to classify RIPPLE (XRP) as a value but everything seems to be moving towards XRP being the winner, apart from the fact that it is having a very good adoption by banks and countries with large institutional capital behind. I think the XRP trial is going to end in their favor and with them a big rise will be seen, its CEO said that by July 2023 the case will be closed.
PS: You can finish before that date
Preferably wait for a 1-2 pattern when we believe that wave "C" is over to ride the next impulsive wave

#XRP is primed for a run to 60 cent plus!The most hated (/loved) #crypto
has formed a bullish formation
suggesting a positive settlement is incoming (probably)
is this insiders buying
or just us mere mortal speculators
regardless the setup remains sound.

The Case for XRP causing ripplesWhat's up Traders,
The Fundamentals of Ripple:
I'm not going to bore you with the business and use-case for 'Ripple' and their token (XRP) .
You can easily DYOR and form your own Opinions on the matter.
In short:
Ripple and XRP are currently being consulted with and used by a number of large United States and International Banks.
The Chart Technical's:
Ripple showing very BULLISH on the chart. If you know , you know. If you don't, just take my word for it. ;)
PS: Technical Analysis is not an exact science :D
The Alpha you're seeking:
Ripple token (XRP) was de-listed from US exchanges after the SEC filed suit, claiming that the token violated existing securities law.
-- Fast Forward to today --
SEC and XRP have concluded their arguments with the COURT and have asked the Judge to settle the case. By every account and my own interpretation of the proceedings Ripple is poised to win the case, which should enable the otken to be re-listed on exchanges in the US. The headline event itself will bear upside to the token price.
I also anticipate there is 'pent up' American demand. Those willing to 'dabble in crypto, but with less appetite for risk, have certainly shied away from the coin.
Taking on extra risk, you could see a large upside if the court rulings are favorable and I am correct in my analysis above.
My Strategy:
I am currently long XRP/USD targeting .55 as a short term milestone.
a buyer up until around 1.20 where i would re-analyze / TP / or / remain in the trade.
If the bullish scenario unfolds, i expect the coin to trade in excess of 1.50 within 2022.
Good Luck.

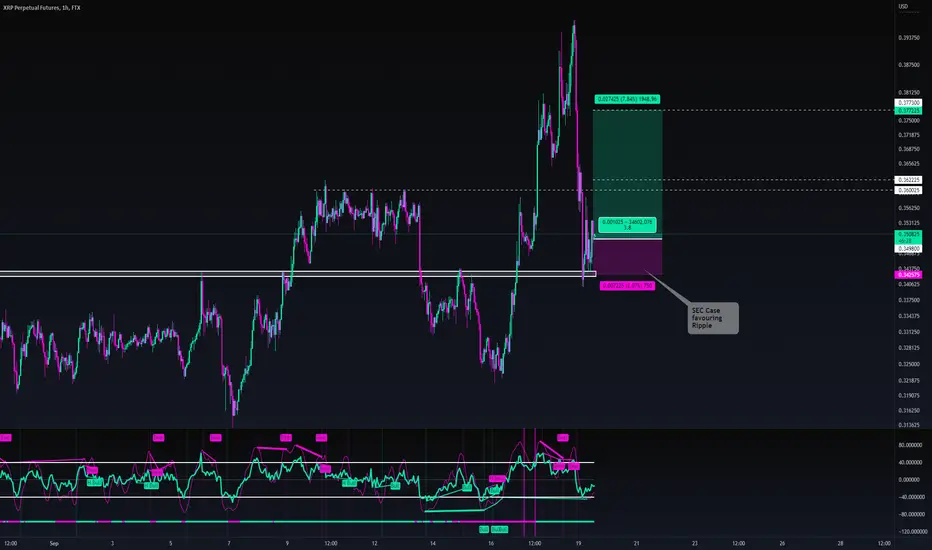
🎲 #XRPPERP #LONG #SCALP 🎲🎲 #XRPPERP #LONG #SCALP 🎲
"Roll The Dice"
Risk
- High
Entry Conditions:
- Found support
News Source:
- SEC case favouring RIpple
ENTRY: 0.349800
TP1: 3.5%
0.362225
TP2: 7.84%
0.377225
SL: 2.02%
0.342575
🤖 #BTCLIVE - 4.10 🤖🤖 #BTCLIVE - 04.10 🤖
TLDR:
Short-Term (-1 Day)
40:60- Bullish:Bearish
Mid-Term (1 Week+)
40:60
Bullish:Bearish
Long-Term (1 Month+)
60:40 - Bullish:Bearish
OVERVIEW:
With no particularly crazy FED announcements this week and no BTC options expirations we should be in for a relatively low volatility week. $20k is looking particularly hard to break so I am expecting consolidation around this area to form a bit of a bullish pennant that is set up to fail unless it can start to trade and consolidate above $20k comfortably ie. at least a daily close above $20k.
The DXY has dropped alittle bit to allow this run up for BTC although is finding dupport on the 20DEMA there now so that might bounce and take BTC down with it. For general targets - breaking above $20.3k in order to see $21k although any higher than that is going to be a stretch which will fill the weekly pivot.
Breaking below $19.7k will likely see BTC reenter the high value area for continued ranging between $19k/$18.8k to $19.8k. I am not hugely bullish atm.
TECHNICAL ANALYSIS:
BULLISH FACTORS:
+Broken out of 200EMA & 20DEMA
+ Broken up out of High Value Area
+ Lots of bullish news
+ Large unfilled weekly pivot area
+ Low value areas overhead
+ Broken Local Trendline resistance
+ Descending Wedge on the Weekly
BEARISH FACTORS:
- 50 DEMA Resistance Incoming
- Double Top
- Bearish Divergence
- High Volume Node Resistance
- Overbought on 1h RSI
- Key Overhead Resistance
NEWS:
Bull:
+ Russia allows international trade ing BTC and crypto for any industry
+ 🦄 Fashion brand Hugo Boss announces plans to launch its first-ever #NFT collection.
+ Argentina's state-owned oil & gas company is mining Bitcoin at one of the biggest oil fields in the co… t.co
+ New York FED President John Williams says inflation will likely come down to 3% by next year.
Bear:
- Reserve Bank of Australia raises interest rates by 25bps to 2.6%, highest since July 2013.
- SEC fines Kim Kardashian $1.3 million for illegal promotion of crypto token
cryptopanic.com
Volatility
* UN Warns Fed to Cool Rate Hikes
cryptopanic.com
* Financial Stability Oversight Council calls on Congress to create federal framework for #stablecoin issuers.
* Biden administration urges Congress to pass laws to clear up #cryptocurrency regulation.

XRP LEG2 ABC CORRECTIONhello guys i hope you are well
this time i think that the leg2 of elliot waves must do an ABC correction PATTERN.
instead of doing just a correction from 0.50 to 0.45
xrp is doing the ABC PATTERN.
why this happens? well because it didnt have to much power to convert the normal down trend in an upsidetrend inmediatly, and this happened 90% of times in al crypto market.
some times that 10% its just a big pump as we remember in july 2021 or the Bigest Bullrun in history in february march last year.

XRP - Long-Term View!Hello TradingView Family / Fellow Traders. This is Richard, also known as theSignalyst.
XRP has been overall bearish trading inside the falling brown channel.
We are currently retesting the upper brown trendline and 0.55-0.6 resistance zone.
For the bulls to take full control, and expect a long-term bullish movement, we need a weekly candle close above 0.6
Meanwhile, the bears can kick in for one more bearish movement inside the channel before the breakout upward.
Which scenario do you think is more probable and why?
Always follow your trading plan regarding entry, risk management, and trade management.
Good luck!
All Strategies Are Good; If Managed Properly!
~Rich

#XRP #ripple emerging from the rubble How to build when asset prices drag…to say the least 2022 has been one of the most brutal years for asset prices. The pervasive rhetoric on inflation has not created any positive momentum for any assets. Equity and Crypto markets have tumbled and much of the chaos is reminiscent of 2008.
If this becomes a win then will provide the boost that the crypto market has been missing

RIPPLE WN?hi guys i hope you are well.
Today the news are good for Ripple. As the judge ordered to show the *HITMAN* SPEACH.
he said: ETH WAS NOT A SECURITY AND XRP EITHER.
Judgment very soon.
Hold the door and fly to the Moon!
By the way we are in the support line.
Triangle marked the point where it woke up.

| XRPUSD | SET FOR BEARISH CONTINUATION IN THE SHORT RUN.Good day, I would like to speak about the price action on XRP in a smaller time frame in order to catch those smaller price movements. As you can see from my title I am leaning towards a bit more action to the downside around the $0.40 range before we have a pushback up to previous resistance levels seen in the $0.50 range.
On the 26th Sep, we broke out of a triangle pattern which, together with the critical resistance level supplied from prior action, resulted in pushing the price to the bears with the target of $0.42 which was met only 2 days later. From then on the price has been playing itself into an ascending triangle with strong resistance at the $0.45 level. Obviously, this pattern is still in early development and can reform itself into a double bottom on the $0.42 level which in turn breaks my prediction of levels closer to $0.40 but that's what the game is about in the end, using your expertise to push your position into a favorable trade.
If the price continues to fall before retracing off the $0.45 level at least once more, then the price action would be structuring itself for a double bottom, therefore this area is vital for securing a favorable position.
Don't forget to leave a like and comment. I am always open to discussions regarding the crypto market if you feel you have information to share.
Thanks @TradingView

| XRPUSD | OVEREXTENDED MOVE HAS REACHED ITS RESISTANCE!Good day all, This article is an extension of my previous article, which basically explains the direct correlation to the previous bear market structure. The first article is recommended to be read prior to this and therefore I am linking it below:
Now that you have scoped that article all of this will make sense. I have zoomed the time frame to the daily chart and have found even better results of correlation between the two time zones. As seen in yellow these levels of support and resistance are indicated as being the previous bear market's strong levels of support and resistance. Now the correlation between the 2 aren't exact but are almost exactly $0.025 apart from each other which is an astoundingly interesting finding as past price action does tend to rhyme.
If you read the last article you will see why I have placed month intervals from 17-19, if not they indicate the months following the beginning of the bear market in each respective time zone, which happen to be the same amount of months leading up to the most recent explosion in price. This fact alone would be a coincidence however after analyzing the daily chart correlation I have found key levels which are too similar to be a coincidence and therefore can be used as a good indicator of where the price could go.
Some would argue that XRP has finally detached itself from the BTC cyclical structure due to the most recent hike in price leaving BTC in the wake, however, what you must understand is there are always going to be idiosyncratic events that detach individual assets from a general cyclical market mover, which in this case in BTCs market structure. The idiosyncratic event as we all could guess is the current SEC VS Ripple summary judgment brief news.
Another bearish indicator based on this current news is that generally investors and retailer traders tend to buy the news and sell the release and this may be one of those cases, even though a win for Ripple would be revolutionary news it will most probably result in a healthy retracement back down to the cyclical average as the idiosyncratic phase as passed.
I will also add fuel to the fire by adding that we still have plenty of bear market left based on the halving cycle being far from sight and a potential continuation of the bears for BTC, which in terms is a catalyst for the continuation of the entire market to the downside.
Reference to 2019 May-June (17th month): In this time period the price experienced a move of above 60% growth within this month placing XRP above the previous resistance that it had consolidated below for around 171 days which made this resistance exceptionally strong, however, the price eventually converted this resistance into support for a period of 57 days before all hell broke lose and the price saw a steady decline leading to the 2020 bottom on the 13th March at the valuation of just under $0.11. I am not in turn coming out by saying the price is going to reach these levels again but that is what the historical data shows. The Image below expressed the price action of the 17th month which correlates well with the current 17th-month price action:
Reference to 2019 June-July (18th month): We have not entered the 18th month yet however, based on prior correlation at such an accurate degree we could see such price action occur. We saw a retracement at the beginning of the month in order to create the structure for the double top that followed near the end of the month. The price touched the key support level multiple times solidifying the $0.38 level as a strong support and resistance level for future prices. I have attached both the 17th and 18th-month price action to better understand the double top:
Reference to 2019 July onwards: The price did not hesitate to continue at a fast pace to the downside leading to the eventual bottom at $0.11 in march of 2020, 256 days later. If I had to use the exact amount of time between the 19th month and the bottom to call a bottom of the current market it would put us at the 25th May 2023. This is not by any means a legit statement however if the price action does follow the general action of the past we could see a bottom around that time, which analysts have predicted prior to my findings. So who knows, all we can do is speculate and use the past as an indicator at the end of the day. I have attached an image of the whole 2019 bearish period up to the current price:
I am thoroughly thanking you if you got this far in the article and if you did please comment your opinion and leave a like, would be much appreciated.

XRP Bearish Sentiment Friday the S&P reached its 52 week low, $3636. There is a strong correlation between the S&P and the crypto world. Many stock investors diversified their portfolio into cryptos, especially in BTC Bitcoin and ETH Ethereum.
With a bearish stock market in the worst month for stocks and cryptos, i expect most of the cryptocurrencies to trade lower this week.
XRP/USDT short
Entry Range: $0.48 - 0.50
Take Profit 1: $0.43
Take Profit 2: $0.36
Take Profit 3: $0.31
Stop Loss: $0.56
my last bullish chart with price targets reached

🎲 #ETHPERP #SHORT #SCALP 🎲🎲 #ETHPERP #SHORT #SCALP 🎲
"Roll The Dice"
Risk
- Med-High
Entry Conditions:
- Lost Multiple local supports
- Money flowing out of market heavily ahead of the Weds Inflation announcements
News Source:
- Fed Announcements on Weds will disrupt market
ENTRY: 1308
TP1: 4.7%
1248
TP2: 8.64%
1195
SL: 2.67%
1343

September 9 BTCUSD BingX Chart Analysis and Today's HeadlineBingX’s Bitcoin Chart
According to OKLink, the total number of ETH 2.0 pledged addresses has exceeded 430,000, reaching a record high of 430,308. Bitcoin is up 4.88% over the last 24 hours and rose to an intraday high of $20,320.00. The largest cryptocurrency managed to break the psychological level of $20,000, which indicates strong demand at the $20,000 price level. The relative strength index (RSI) is moving away from the oversold zone, suggesting the bears are losing control. If the price breaks above the 20-day EMA ($20,344), the BTC/USDT pair could rally toward the 50-day simple moving average (SMA) ($21,964).
Today’s Cryptocurrency Headline
SEC to Set Up New Cryptocurrency Disclosure Office
The U.S. Securities and Exchange Commission (SEC) will set up a new office for cryptocurrency filings. Cicely LaMothe, the associate director for disclosure operations, said the office would be part of the Division of Corporation Finance, which handles disclosures for publicly traded firms. The SEC believes the new office is necessary to address “unique and evolving” filings around crypto assets, the vast majority of which are considered securities by the SEC, LaMothe said at a legal conference in Washington on Thursday. According to LaMothe, the SEC is expected to have legal and accounting branches for crypto firms to consult and file with.
Disclaimer: BingX does not endorse and is not responsible for or liable for any content, accuracy, quality, advertising, products, or other materials on this page. Readers should do their own research before taking any actions related to the company. BingX is not responsible, directly or indirectly, for any damage or loss caused or alleged to be caused by or in connection with the use of or reliance on any content, goods, or services mentioned in the article.

| XRPUSD | HEADED FOR LOWER LOW!Today I will be diving into the short-term fluctuations XRP is currently enduring. On the 2 hourly charts, it is clear we have broken out of an ascending triangle formation. This formation may have a neutral probability however, the bearish probability in this instance was stronger due to this triangle being part of a series of smaller patterns influenced by a previously bigger ascending triangle breakout as expressed in the image below,
This screenshot is taken from the daily chart to express the bigger picture and potential target for the market to come:
Now that you see the bigger picture you can understand why the bearish break from the current pattern was almost inevitable…well at least statistically.
2-hour chart: The price had broken out of the pattern earlier this morning and what followed has strengthened my confidence in the continuation of the downtrend due to the pair sticking to a healthy decline by retracing to the previous support as a resistance. On top of this textbook example of an ascending triangle break, the price also sits right below a strong level of resistance in the short term which is expressed using the Fibonacci retracement indicator (38.2% fib, RED).
Major support: The next important area of support to watch out for is seen in the range of 0.31334 and 0.30998. This level has proven to be strong as it holds strong support for a double bottom seen in the confines of the previous ascending triangle (yellow lines, look at the image above). This level isn't just drawn from the sight of eye but is a Fibonacci level (78.6%) drawn between the low of the ascending triangle to the high. Therefore it is clear that we will spend some time consolidating in this area before potentially breaking to our target of 0.2869. However only time will tell.
Thank you for your much-valued time. I shall greatly appreciate your honest take on this article.
@TradingView

XRP SHORT?!?!?!Does this look bearish to anyone else??? What do you guys think? I'm definitely bullish as hell on XRP, more than any other crypto tbh lol.

🤖 #BTCLIVE - 15.08 - #IDEA 🤖🤖 #BTCLIVE - 15.08 - #IDEA 🤖
Snapshot:
Short-Term
30:70- Bullish:Bearish
Long-Term
50:50 - Bullish:Bearish
Technical Analysis:
Bullish Scenario:
Alot of bearish sentiment, mainly short term would suggest a move down to $23.6k especially with the 3rd rejection from $25k andsell orders coming in - there could be a strong rally at this position to fend off breaking down on the ascending wedge which would likely drive price for another test of $25k this would be incredibly bullish and somewhat of a make or break push. A break and hold above $25k puts $27k and $30k as realistic targets.
Bearish Scenario:
Short term movement down to $23.6k is likely for the local support although there could be a lot of defense at this position a breakdown and confirmed retest can see price sing quite quickly to $22.6k where the next strongest zone of support lies, max pain in the move can still push us down to $20k region which is where the bottom of this long term channel/range lies.
Bullish Factors:
+ Weekly Pivot already filled
+ 200EMA is supporting
+20 & 50 DEMA doming to support at the key trendline support
+ Transfer Volume turned positive
+ Active Addresses turned positive
Bearish Factors:
- Bearish Divergence on the 5min
- Bearish divergence on the 4hr
- Bearish Divergence on the 1hr
- Restesting resistance
- Strong Sell Orders
- Broken through 20 and 50 EMA
- Hard rejection from 25k for 3rd time
- Exchange Netflow Total turned negative
- Liquidation turned negative
Key News:
Bull:
+ ETH Merge causing bullish sentiment market wide
+ 💥Revolut gets approval to offer #Bitcoin and crypto in the European Economic Area.
+ Judge grants Ripple’s request to review videos of SEC officials (cryptopanic.com)
+#Crypto exchange Gate.io has been granted a virtual asset custodial services license in Hong Kong.
+ Europe’s largest independent tyre re-treader, Vaculug, will accept #Bitcoin for payment!
Bear:
- $ETH: The “Merge” Protocol Upgrade Will Not Lower Ethereum’s Gas Fees
- Hackers printed 1.2 billion $AUSD on the Acala Network through an exploit.
- Brazilian #crypto lending platform BlueBenx halts withdrawals following a $32 million hack.
Metrics:
Exchange
- Exchange Reserve - As the exchange reserve continues to rise, it indicates higher selling pressure.
- Exchange Netflow Total - Net deposits on exchanges are high compared to the 7-day average. Higher deposits can be interpreted as higher selling pressure.
Miners
/ Miners' Position Index ( MPI ) - Miners' are selling holdings in a moderate range compared to its one-year average.
/ Puell Multiple -Miner's revenue is in a moderate range, compared to its one-year average.
On-Chain
+ aSOPR - More investors are selling at a loss. In the middle of a bear market, it can indicate a market bottom.
+ Binary CDD - Long term holders' movement in the last 7days were lower than the average. They have a motive to hold their coins
+ Net Unrealized Profit and Loss (NUPL) -Investors are in a Fear phase where they are currently with unrealized profits that are slightly more than losses.
+ Transfer Volume - The total number of coins transferred has decreased by 31.00% compared to yesterday.
+ Active Addresses - The total number of active wallets used to send and receive coins has decreased by 13 .00% compared to yesterday.
+ Transactions - The total number of transactions has increased by 26.00% compared to yesterday.
Sentiment
+ Coinbase Premium - US investors' buying pressure is relatively strong in Coinbase.
- Korea Premium -Korean retail investors' buying pressure is relatively strong.
- Fund Premium - Investors in funds and trusts including Grayscale have relatively weak buying sentiment.
Derivatives
+ Funding Rate - Long position traders are dominant and are willing to pay to short traders.
+ Taker Buy Sell Ratio - Selling sentiment is dominent in the derivatives market. More sell orders are filled by takers.
/ Open Interest - As OI increases, it indicates more liquidity, volatility , and attention are coming into the derivative market. The increasing trend in OI could support the current ongoing price trend - Last Value: 9,142,523,051.97 24H%: -8% 7D%: -9%
- Liquidation - 42921463.65 of short positions were liquidated in the last 24 hours.

🤖 #BTCLIVE - 11.08 - #IDEA 🤖🤖 #BTCLIVE - 11.08 - #IDEA 🤖
Snapshot:
Short-Term
50:50- Bullish:Bearish
Long-Term
70:30 - Bullish:Bearish
Technical Analysis:
The bullish scenario is to break $24.75k with strong volume to remove the above sell orders confidently and hold for the daily close - it will strongly confirm a push up to $27k since there is very little resistance on the way along with a bullish CME gap target and top of the macro range.
The Beraish scenario here is losing $24.2k again will push it down likely further to $23.5k where there should be some support there is a chance it can form an inverse head and shoulders pattern here and bounce quite nicely but short therm there could be blood to take out a lot of leveraged longs.
Bullish Factors:
+ Little overhead resistance
+ Broken Key Resistance with strong support
+ MFI is positive
+ Above all key EMA's
+ Above 20 & 50 DEMA
+ $250 billion inflows crypto market cap in last 30 days
+ ETH Merge causing bullish sentiment
+ Positive CPI Data
+ Transfer Volume turned positive
+ Funding Rates turned positive
+ Taker Buy Sell Ratio turned positive
+ Liquidations turned positive
Bearish Factors:
- SEC is still on a rampage
- RSI Pullback Signal
- Bearish RSI & Wave Divergence
- At Local Resistance
- Wave Reversal
- RSI and Wave Overbought
- Volume slowing down
- Large Sell Orders
- Trendline Resistance
- Exchange Reserve turned negative
- aSOPR turned negative
Key News:
+ ETH Merge causing bullish sentiment market wide
- U.S Treasury has blacklisted 'crypto mixer' Tornado Cash.
+ CPI Announcement - 8.5% - sub 8.7% was deemed bullish
- SEC Subpoenaed Coinbase
+ $250 billion inflows crypto market cap in last 30 days
Metrics:
Exchange
- Exchange Reserve - As the exchange reserve continues to rise, it indicates higher selling pressure.
- Exchange Netflow Total - Net deposits on exchanges are high compared to the 7-day average. Higher deposits can be interpreted as higher selling pressure.
Miners
/ Miners' Position Index ( MPI ) - Miners' are selling holdings in a moderate range compared to its one-year average.
/ Puell Multiple -Miner's revenue is in a moderate range, compared to its one-year average.
On-Chain
- aSOPR - More investors are selling at a profit. In the middle of a bull market, it can indicate a market top.
+ Binary CDD - Long term holders' movement in the last 7days were lower than the average. They have a motive to hold their coins
+ Net Unrealized Profit and Loss (NUPL) -Investors are in a Fear phase where they are currently with unrealized profits that are slightly more than losses.
+ Transfer Volume - The total number of coins transferred has increased by 5.00% compared to yesterday.
+ Active Addresses - The total number of active wallets used to send and receive coins has increased by 40.00% compared to yesterday.
+ Transactions - The total number of transactions has increased by 55.00% compared to yesterday.
Sentiment
+ Coinbase Premium - US investors' buying pressure is relatively strong in Coinbase.
- Korea Premium -Korean retail investors' buying pressure is relatively strong.
- Fund Premium - Investors in funds and trusts including Grayscale have relatively weak buying sentiment.
Derivatives
+ Funding Rate - Long position traders are dominant and are willing to pay to short traders.
+ Taker Buy Sell Ratio - Buying sentiment is dominent in the derivatives market. More buy orders are filled by takers.
/ Open Interest - As OI increases, it indicates more liquidity, volatility , and attention are coming into the derivative market. The increasing trend in OI could support the current ongoing price trend.
+ Liquidation - 101609383.99 of short positions were liquidated in the last 24 hours.

SPAC: Special Acquisition to "IPO private companies"Dipping your toes into the wild "reverse IPO" SPACs....
A SPAC, Special Purpose Acquisition Company, is a company that uses its funds to transform existing private companies to list them on the Stock Market. Read up on the SEC.GOV on these "special" financial instruments from Wall Street and friends before risking a penny on these things.
We'll use a special SPAC acquiring a company very close to home: D-Wave Systems of Vancouver (Burnaby), Canada regulated under Canadian and BC Laws.
For D-Wave's IPO via XPOA (the SPAC) to QBTS ("quantum bits") this will be done on the NYSE listed. D-Wave Systems is currently private and a leader in Quantum Computing with North American headquarters and control. A former Canadian star is graduating to the US. See the company web site for details www.dwavesys.com
AI (Artificial Intelligence) is the future and "Quantum Bits" D-Wave QBTS might do very well as it becomes fully vetted in the USA via it's "big board", the NYSE (New York Stock Exchange). Everything needs "servers" and quantum computers are the big players in serving processing speeds. Check the past and recent clients for D-Wave Systems.
In this Tutorial, we'll use TradingView Charts to explaining the possible price action on this chart based on the public information available both in the US (new D-Wave Regulatory home) and Canada (existing D-Wave Regulatory home).
As a way of a background: D-Wave a leading Canadian Quantum SuperComputing is on its way to "move" from being privately held in Vancouver, Canada to being American sharesholder owned via NYSE under the expected symbol QBTS..SPACs are one way to play the IPO but it's all speculative. These are listed as
The very interesting thing with the Markets is Canada operates under its own rules and Laws. So something that might be approved in Court last week for example, is "public" in Canada but may not be advertised in the US until regulatory requirements are met in both Canada and the US. The Charts on XPOA (DCPM Capital), shows the spike in February 2022 when the acquisition was announced.
"Update: D-Wave to Go Public via Merger with SPAC DPCM Capital; DPCM Shares Rise
Feb 8, 202208:47 Reuters
D-Wave Systems, a provider of quantum computing systems, software, and services, said Tuesday that it has agreed to merge with special purpose acquisition company DPCM Capital (XPOA) to become a publicly-traded entity."
In July, the charts shows the XPOA (and associated XPOA.U and XPOA.W) was repriced and the market respected sending the SPAC from the $10s to the $7s
This is a SPAC to watch since D-Wave Systems is a large company located in Greater Vancouver, Canada. It was a Canadian technology company and will become one of the few (or only?) pure play US company in the Quantum Computing space.
There is a customary US publication ban until proper regulatory approval is received. The "may not be distributed in the United States" allows the company to get past stockholders to understand the restructuring. Track the official Public filings available from the SEC in the US. The SEC (Securities and Exchange Commission) being the regular lists any public information as filed by the company at: www.sec.gov
The Latest public news is www.sec.gov
A Shareholder vote to be voted on TOMORROW August 2nd 2022 Price action shows it has very good changes of being approved especially given the Provincial/State Canadian BC Court Approval last week which was public with restrictions on the company relating to publication in the US prior to Shareholder approval.
Interesting times...
DISCLOSURE & Liability Waiver: The above could be all wrong. FACT CHECK everything anonymous posts! BR is part of a group of Researchers of the Markets and regulatory protocols. SPACs are truly "special" (read up at SEC.GOV) and not for the novice investors. These "high growth speculative plays" need to be viewed with either deep fundamental analysis. HTA (Hybrid Technical Analysts) using certain "conditions" to determine when to jump on and off. Volume and changes in volume is one of the key indicators and mapping these to Regulatory Disclosures is interesting. For "XPOA SPAC to QBTS IPO", since this is the Study at this point given the Events, we expect Bullish volume to possibly resume here with a massive short squeeze as the dark uncertainties get cleared up tomorrow DPCM Capital/D-Wave Systems Special Shareholder Vote August 2nd 2022. Only shareholders as of June 2022 get to participate and vote at the Shareholder Meeting. Contact the company or Regulators for more information or post as a Comment if you know something public that isn't widely known. Just think I'm just an "Elf on summer break", I have no freaking idea where that Rudolf is! That "red nose" is a concern for some but it's NOT because the poor is a drunk. That's vicious rumours by bad actors! He was just born that way! Seriously, this is just an early "heads up" from "Up North", friendly neighbours. Hey!
Peace on Earth and at Home.

Xrp short term targets 2022 Bear I have a couple of xrp targets if we break through this descending triangle which is a bearish continuation pattern. I have targets ranging between $0.22 and $0.25. We still have negative overall market news on recession and inflation fears along with insolvent cefi platforms that are plaguing the crypto markets. We will most likely find a bottom in crypto during this bear in 2022. I am using the 4 hourly chart with the MA and EMA 200 and 210. We have great current news with the Xrp vs Sec court case but equity and crypto market factors will affect Xrp in short term then a settlemnt will eventually move Xrp into a bull run.

Diamond in the roughThe Digital Asset XRP is in a unique position compared to the rest of the market, The SEC's Lawsuit against Ripple Labs promises Clarity for the token once litigation is completed. Regulatory Clarity For XRP Will Be a Catalyst for Bullish Price action. Any Price Point bellow the 200 EMA is a bargain.
