SEI The next big Move#SEI
The price is moving within a descending channel on the 1-hour frame and is expected to break and continue upward.
We have a trend to stabilize above the 100 moving average once again.
We have a downtrend on the RSI indicator that supports the upward break.
We have a support area at the lower boundary of the channel at 0.2750, acting as strong support from which the price can rebound.
We have a major support area in green that pushed the price upward at 0.2600.
Entry price: 0.2813
First target: 0.2879
Second target: 0.2970
Third target: 0.3080
To manage risk, don't forget stop loss and capital management.
When you reach the first target, save some profits and then change your stop order to an entry order.
For inquiries, please comment.
Thank you.
SEI

Is SEI PA rigged?The PA is not rigged but just the TPO's pull did it, ideally, if bTC goes up the same move to top shall be done in the way, or full retracement can be seen

SEI Just Broke Out - Massive Rally Incoming?SEIUSDT Technical analysis update
SEIUSDT is testing a long-term descending trendline, which has acted as strong resistance on multiple occasions. Price has now broken above this level with strong volume, signaling a potential trend reversal. And price trading above 100 and 200 EMA, in the coming trading days, we can see a strong bullish move in SEI
NYSE:SEI

SEIUSDT Forming Falling WedgeSEIUSDT has recently confirmed a falling wedge breakout, a strong bullish reversal pattern that often marks the end of a downtrend and the start of an impulsive move upward. The breakout has occurred with solid momentum, and volume is supportive—indicating that buyers are stepping in with conviction. This technical formation suggests a potential price surge ranging between 60% to 70%, aligning with historical projections from similar wedge breakouts.
As shown in the daily chart, SEIUSDT has broken above the wedge resistance and followed up with strong bullish candles. This surge confirms growing demand and positive sentiment in the market. Notably, the immediate targets are marked at $0.34 and $0.37, with upside potential of over 83% from the breakout point, offering attractive risk-reward for traders and swing investors.
Fundamentally, SEI is gaining traction within the decentralized ecosystem. Its focus on high-performance blockchain scalability and its growing developer community is drawing significant attention. Social media chatter and on-chain data also reflect increasing accumulation from retail and mid-tier wallets. Such organic traction often translates into sustainable price movements, especially when paired with strong technical setups like this.
Overall, SEIUSDT is shaping up as a high-potential altcoin play. With technical confirmation, investor interest, and bullish sentiment across the board, this breakout could be just the beginning of a larger trend. Traders should keep an eye on pullbacks for potential entries and watch for continuation above local resistance levels.
✅ Show your support by hitting the like button and
✅ Leaving a comment below! (What is You opinion about this Coin)
Your feedback and engagement keep me inspired to share more insightful market analysis with you!

#SEI/USDT#SEI
The price is moving within a descending channel on the 1-hour frame, adhering well to it, and is on its way to breaking it strongly upwards and retesting it.
We are seeing a rebound from the lower boundary of the descending channel, which is support at 0.2942.
We have a downtrend on the RSI indicator that is about to break and retest, which supports the upward trend.
We are looking for stability above the 100 moving average.
Entry price: 0.3062
First target: 0.3151
Second target: 0.3290
Third target: 0.3421

#SEI/USDT#SEI
The price is moving within a descending channel on the 1-hour frame and is expected to break and continue upward.
We have a trend to stabilize above the 100 moving average once again.
We have a downtrend on the RSI indicator, which supports the upward move by breaking it upward.
We have a support area at the lower limit of the channel at 0.2696, acting as strong support from which the price can rebound.
Entry price: 0.2790
First target: 0.2894
Second target: 0.3030
Third target: 0.3177

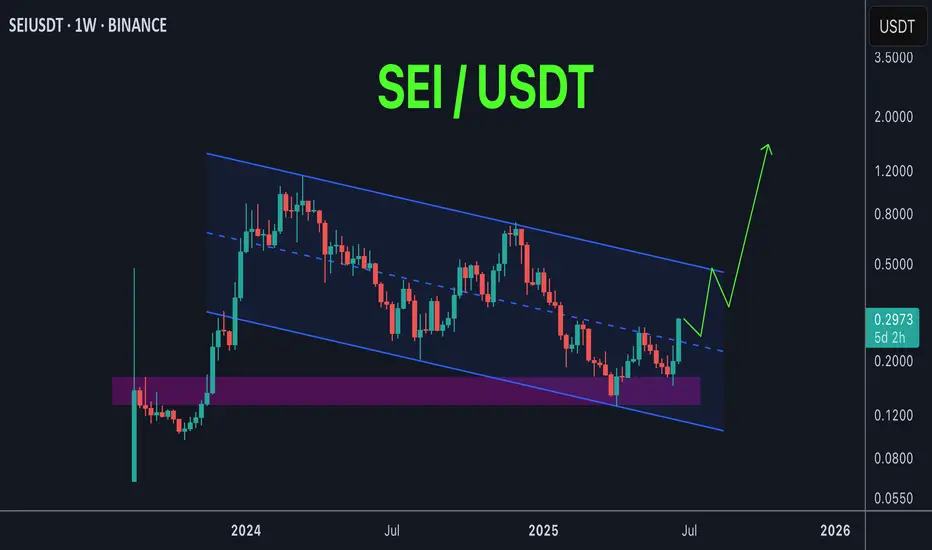
SEI possible playout SEI / USDT
Price is trading inside big descending channel
Next stop : price will hit the upper trendline of the channel and if managed to breakout this resistance it will skyrocket maybe to new ATH
Keep an eye on it …
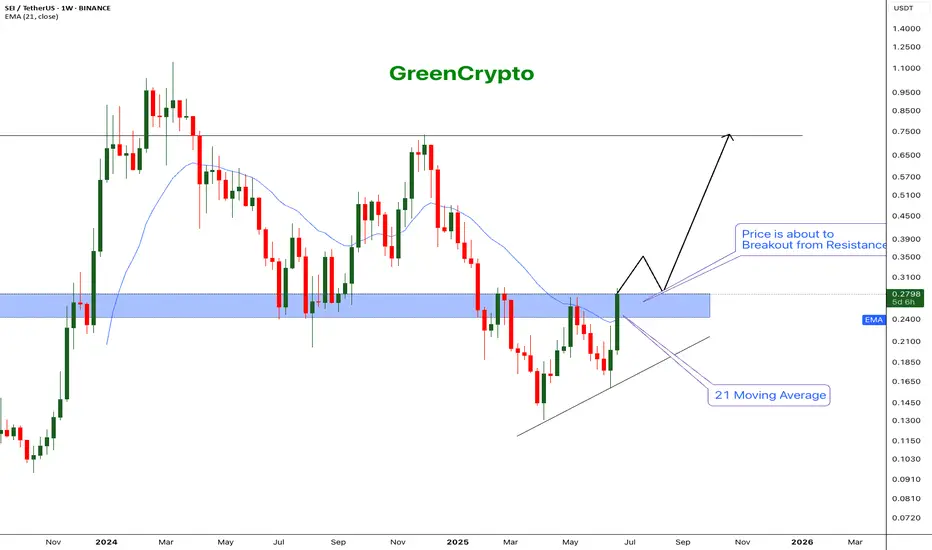
SEI - The next big runner$BINANCE:SEI/USDT (1W CHART) Technical Analysis Update
SEI is currently trading at $0.2785 and showing overall bullish sentiment
Price successfully breached the 21 EMA and now price is trading near one of the major resistance zone.
If the weekly candles closes above the resistance then we can expect further bullish momentum.
I'm expecting the price to easily break the resistance and hit the next major resistanc e around 0.75
Entry: After close above resistance (0.285)
StopLoss: 0.18
TakeProfit 1: 0.3506
TakeProfit 2: 0.4962
TakeProfit 3: 0.7367
Don't forget to keep stoploss!
Follow our TradingView account for more technical analysis updates. | Like, share, and comment your thoughts.
Cheers
GreenCrypto
$SEI Testing Critical Resistance After BreakoutNYSE:SEI has finally broken above the long-standing resistance trendline, a strong sign of bullish momentum building up.
Right now, it’s facing some pressure at the marked resistance zone. If bulls manage to flip this area into support, we could see the next leg up. But if it gets rejected here, a short pullback or retest isn’t off the table.
Let the level decide the next move — no need to chase.
DYOR, NFA

Phemex Analysis #92: Pro Tips for Trading Sei (SEI) Sei ( PHEMEX:SEIUSDT.P ) Network’s recent advancements underscore its commitment to extreme scalability, Ethereum Virtual Machine (EVM) compatibility, and streamlined user experience, all backed by strong institutional support and rapid adoption.
The recent launch of Sei V2 marks a major milestone, enhancing Sei’s performance dramatically. With this upgrade, the network now processes an impressive 5 gigagas per second, equating to approximately 200,000 transactions per second (TPS) with sub-400 millisecond finality. Such metrics position Sei among the fastest EVM-compatible blockchains globally, facilitating groundbreaking real-time applications in DeFi, AI, and trading. Improvements like the SeiDB storage layer further boost efficiency by accelerating node syncing and reducing state bloat.
Institutionally, Sei is experiencing remarkable momentum. Recently, Canary Capital filed with the US SEC for the first-ever SEI-based Exchange Traded Fund (ETF), offering regulated access to staked SEI and on-chain yields. Additionally, prominent investors like Circle Ventures, Multicoin Capital, and Delphi Digital strongly validate Sei’s potential as a high-performance Layer-1 blockchain.
These significant developments—technical excellence, streamlined ecosystem, and strong institutional backing—position Sei Network as a top-tier contender in the blockchain industry.
Possible Scenarios
1. Bullish Continuation (Further Uptrend)
Over the past two days, SEI’s price surged by more than 45%, indicating robust bullish momentum. The immediate resistance at $0.292 appears attainable if bullish strength persists.
However, traders should anticipate significant resistance at higher levels, notably at $0.43 and $0.50. Approaching these key levels, market volatility could increase substantially.
Pro Tips:
Profit-Taking: Strategically take partial profits as SEI approaches the critical resistance zones near $0.43 and subsequently $0.50.
Risk Management: Implement protective stop-loss orders just below recent support zones, such as $0.255, to manage unexpected reversals.
2. Rejection at $0.292 (Potential Retracement)
Considering the sharp recent gains in a relatively uncertain market environment, a rejection at the $0.292 resistance is plausible. Should this occur, SEI might seek support at lower levels, primarily around $0.19 and $0.158, before stabilizing.
Pro Tips:
Buy-the-Dip Strategy: Monitor the lower support levels ($0.19 and $0.158) closely. These areas might offer favorable opportunities for accumulating SEI at discounted valuations.
Volume Confirmation: Keep an eye on trading volume during pullbacks; lower volume would indicate a potentially healthy correction rather than a sustained bearish move.
3. Breakthrough $0.292 but Retrace to Accumulate Momentum (Consolidation Scenario)
Another scenario involves SEI initially breaking above $0.292, then experiencing mild pullbacks toward approximately $0.255 to consolidate momentum. In this pattern, price may gradually climb higher, with smaller upward moves interspersed by brief retracements.
Pro Tips:
Long Grid Bots: Leverage grid trading bots effectively to capture profits from the smaller price fluctuations typical in this scenario. Start long-grid bots around the support level at $0.255 and target modest incremental gains.
Patience and Adaptability: Maintain discipline, patiently letting positions unfold while continuously managing your exposure through proper stop-loss placements and profit-taking strategies.
Conclusion
Sei Network’s robust technical performance, institutional backing, and recent bullish price action provide traders with several actionable scenarios. By carefully observing the outlined resistance and support levels and employing disciplined trading strategies—including timely profit-taking, grid bot deployment, and vigilant risk management—traders can confidently navigate SEI’s volatility to optimize returns effectively.
🔥 Tips:
Armed Your Trading Arsenal with advanced tools like multiple watchlists, basket orders, and real-time strategy adjustments at Phemex. Our USDT-based scaled orders give you precise control over your risk, while iceberg orders provide stealthy execution.
Disclaimer: This is NOT financial or investment advice. Please conduct your own research (DYOR). Phemex is not responsible, directly or indirectly, for any damage or loss incurred or claimed to be caused by or in association with the use of or reliance on any content, goods, or services mentioned in this article.

#SEI/USDT#SEI
The price is moving within a descending channel on the 1-hour frame, adhering well to it, and is heading for a strong breakout and retest.
We are experiencing a rebound from the lower boundary of the descending channel. This support is at 0.1725.
We are experiencing a downtrend on the RSI indicator, which is about to break and retest, supporting the upward trend.
We are heading for stability above the 100 Moving Average.
Entry price: 0.1766
First target: 0.1794
Second target: 0.1834
Third target: 0.1890

Sei Goes Bullish, Same Pattern & SequenceIt is the same price pattern and sequence. A bullish wave ends December 2024 and leads to a correction. The correction ends with a bottom 7-April. This bottom marks the start of a new phase, the bullish cycle. Recently, SEIUSDT produced a higher low and this higher low marks the start of the next advance, a bullish continuation.
Makes sense?
Bullish action already confirmed —The bigger picture
Today we have three green candles and the most bullish since the end of the initial bullish breakout. If you take this chart together with my other recent publications: COIN, ETH, DOGS, NOT and BCH, you can start to decipher the bigger picture. It is already confirmed.
A great opportunity
I am here to alert you of the event before it happens. Taking action now can be life changing or simply put, taking action now can translate into huge profits; the best possible entry after the 7-April low.
Don't worry, even if this opportunity gets away from you, the market will continue to produce countless more; endless opportunities the Cryptocurrency market has to offer for sure.
Thanks a lot for your continued support.
Namaste.

SEI putting in work for a reversal SEI is working on its pivot. In the meantime, we accumulate at positions of strength. A proper higher low and a higher at this level would be a good sign.
Full TA: link in the BIO

One Problem - No Solution - SEISEII just moved up and it create problem for new longs or short, they be like what to do buy or sell? Technically the moves are precendted by two ocassions, orange is the one where the moves top is to be get loaded and the moves down would get wrecked, the move it says need a orange move to get up and red says a straight top move

SEI – Clear Invalidation, Going Long at 20cGoing long here on $SEI.
Invalidation is straightforward—shouldn’t see new lows from this point.
First target is 40c. If that breaks, we could see solid momentum follow through.
BINANCE:SEIUSDT 2x

SEI: Fully Locked#SEI showed a clean motive wave after its April low, followed by a corrective wave, forming a classic setup for a powerful third wave.
Holding above $0.130 keeps the idea valid, with $0.095 as final invalidation. Passing $0.275 confirms the pattern; $0.735 targets the ATH.

#SEI/USDT#SEI
The price is moving within a descending channel on the 1-hour frame, adhering well to it, and is heading for a strong breakout and retest.
We are experiencing a rebound from the lower boundary of the descending channel, which is support at 0.1840.
We are experiencing a downtrend on the RSI indicator, which is about to break and retest, supporting the upward trend.
We are in a trend of consolidation above the 100 Moving Average.
Entry price: 0.1927
First target: 0.1999
Second target: 0.2067
Third target: 0.2162

SEIHead and Shoulder Pattern is seen in the chart,
Breakout of Neckline will give a huge pump 🚀🚀🚀
Can grab some here 💰

SEIUSDT - MEH!Hello everyone. I'm closely monitoring SEIUSDT, and I've observed significant activity in this asset: buyers have entered the market. This is a situation that demands close attention, as it carries the potential to shift the market's trajectory.
Our current focus is the blue box I've marked on the chart. This area currently presents itself as a resistance level. However, if buyers continue to strengthen and decisively break this blue box upwards, that's when a real opportunity could emerge. In such a scenario, following the breakout, I'll be looking for a retest on a low timeframe (LTF). If the price confirms this broken level as support, that will be a strong long position signal for me. This is one of those moments where the market is telling you, "I'm here."
When evaluating this scenario, I won't, of course, rely solely on price action. I'll be closely examining the volume footprint; understanding the true strength and intent of buyers is crucial. At the same time, I won't overlook CDV (Cumulative Delta Volume) divergences, as these can reveal hidden shifts in momentum. Sudden increases in volume, as always, act as a magnet for me; because, as you know, I only trade coins that are showing a sudden spike in volume. This is one of the secrets the market whispers to you.
However, as always, the market is two-sided, and we must remain flexible. If buyers fail to break this blue box and we see decisive downward breakouts on the daily timeframe, this could also present a potential scenario for a short attempt. Remember, the market can act independently of our expectations, and as a trader with one of the highest win rates, I always move according to the direction the market shows us.
We must also be vigilant against potential liquidity hunts at these levels. Price briefly pushing above the blue box and then rapidly falling back, or dipping below and then recovering, could be manipulations designed to shake out weaker hands. Failed breakouts or the regaining of lost levels will also provide us with valuable information.
Don't be surprised to see significant movements in SEIUSDT in the coming days. You might regret missing this setup, as most traders overlook these nuances at this level. Stay tuned, and let's decipher what the market is whispering together. You can trust my perspective.
📌I keep my charts clean and simple because I believe clarity leads to better decisions.
📌My approach is built on years of experience and a solid track record. I don’t claim to know it all but I’m confident in my ability to spot high-probability setups.
📌If you would like to learn how to use the heatmap, cumulative volume delta and volume footprint techniques that I use below to determine very accurate demand regions, you can send me a private message. I help anyone who wants it completely free of charge.
🔑I have a long list of my proven technique below:
🎯 ZENUSDT.P: Patience & Profitability | %230 Reaction from the Sniper Entry
🐶 DOGEUSDT.P: Next Move
🎨 RENDERUSDT.P: Opportunity of the Month
💎 ETHUSDT.P: Where to Retrace
🟢 BNBUSDT.P: Potential Surge
📊 BTC Dominance: Reaction Zone
🌊 WAVESUSDT.P: Demand Zone Potential
🟣 UNIUSDT.P: Long-Term Trade
🔵 XRPUSDT.P: Entry Zones
🔗 LINKUSDT.P: Follow The River
📈 BTCUSDT.P: Two Key Demand Zones
🟩 POLUSDT: Bullish Momentum
🌟 PENDLEUSDT.P: Where Opportunity Meets Precision
🔥 BTCUSDT.P: Liquidation of Highly Leveraged Longs
🌊 SOLUSDT.P: SOL's Dip - Your Opportunity
🐸 1000PEPEUSDT.P: Prime Bounce Zone Unlocked
🚀 ETHUSDT.P: Set to Explode - Don't Miss This Game Changer
🤖 IQUSDT: Smart Plan
⚡️ PONDUSDT: A Trade Not Taken Is Better Than a Losing One
💼 STMXUSDT: 2 Buying Areas
🐢 TURBOUSDT: Buy Zones and Buyer Presence
🌍 ICPUSDT.P: Massive Upside Potential | Check the Trade Update For Seeing Results
🟠 IDEXUSDT: Spot Buy Area | %26 Profit if You Trade with MSB
📌 USUALUSDT: Buyers Are Active + %70 Profit in Total
🌟 FORTHUSDT: Sniper Entry +%26 Reaction
🐳 QKCUSDT: Sniper Entry +%57 Reaction
📊 BTC.D: Retest of Key Area Highly Likely
📊 XNOUSDT %80 Reaction with a Simple Blue Box!
📊 BELUSDT Amazing %120 Reaction!
📊 Simple Red Box, Extraordinary Results
📊 TIAUSDT | Still No Buyers—Maintaining a Bearish Outlook
📊 OGNUSDT | One of Today’s Highest Volume Gainers – +32.44%
I stopped adding to the list because it's kinda tiring to add 5-10 charts in every move but you can check my profile and see that it goes on..
#SEI/USDT#SEI
The price is moving within a descending channel on the 1-hour frame, adhering well to it, and is heading for a strong breakout and retest.
We are seeing a bounce from the lower boundary of the descending channel, which is support at 0.2095.
We have a downtrend on the RSI indicator that is about to break and retest, supporting the upward trend.
We are looking for stability above the 100 Moving Average.
Entry price: 0.2249
First target: 0.2423
Second target: 0.2423
Third target: 0.2538

#SEI/USDT#SEI
The price is moving within a descending channel on the 1-hour frame, adhering well to it, and is on its way to breaking it strongly upwards and retesting it.
We are seeing a bounce from the lower boundary of the descending channel, which is support at 0.2170.
We have a downtrend on the RSI indicator that is about to break and retest, supporting the upward trend.
We are looking for stability above the 100 moving average.
Entry price: 0.2310
First target: 0.2372
Second target: 0.2446
Third target: 0.2563

SEI Turns Bullish After A Zig-Zag CorrectionSEI Turns Bullish After A Zig-Zag Correction, as we see it sharply bouncing from projected support that can send the price higher by Elliott wave theory.
SEI with ticker SEIUSD is waking up exactly from the channel support line and equality measurement of waves A=C, which is perfect textbook support for subwave (5) of an impulse into wave C of an ABC zig-zag correction. It's actually nicely and impulsively rising for wave 1, so after current wave 2 pullback, be aware of a bullish continuation within wave 3 of a five-wave bullish cycle, especially if breaks above 0.30 first bullish evidence level.
Sei (SEI) is a high-performance Layer 1 blockchain designed specifically for decentralized finance (DeFi) and decentralized exchanges (DEXs). Launched in August 2023 by Sei Labs, it features innovations like Twin-Turbo Consensus for fast block finality, Optimistic Parallelization for high throughput, and SeiDB for efficient transaction handling. It supports EVM compatibility, enabling seamless deployment of Ethereum-based apps. The SEI token is used for transaction fees, staking, governance, and liquidity.

SEI LIVE TRADEHello friends
Given the decline we had, we expect to experience another decline and we can open a trade in the direction of the trend with capital and risk management.
*Trade safely with us*
