SEI BUY LIMITHello friends🙌
📉According to the downward trend we had, you can see that a reversal pattern was formed at the specified support and buyers entered and raised the price, which caused the formation of an ascending channel.
👀Now that we are at the ceiling of the ascending channel, because there is a possibility of price correction, we will place two more buying steps down and buy with risk and capital management and move with it to the specified targets.
🔥Follow us for more signals🔥
*Trade safely with us*
SEIUSD

SEI LIVE TRADEHello friends🙌
🔊As you can see, the upward trend has started, and the power is in the hands of buyers, and here we have an opportunity to enter a buy trade with risk and capital management to move towards the specified target.
🔥Follow us for more signals🔥
*Trade safely with us*

SEIUSDT Rebounds from Key Support - Pump Loading?BINANCE:SEIUSDT Rebounds from Key Support - Pump Loading?
BINANCE:SEIUSDT just touched a major support level on the 4H chart and is now showing signs of a bullish reversal after breaking above the descending trendline. This setup looks similar to previous price actions where NYSE:SEI delivered sudden explosive moves post-breakout. If history repeats, we could be looking at another strong rally ahead.
Entry looks promising, but as always, manage your risk wisely and set a proper stop loss to protect your capital.
BINANCE:SEIUSDT Currently trading at 0.265
Buy level : Above $0.263
Stop loss : Below $0.243
Target : $0.337
Max leverage 5x
Always keep stop loss
Follow Our Tradingview Account for More Technical Analysis Updates, | Like, Share and Comment Your thoughts

#SEI/USDT#SEI
The price is moving within a descending channel on the 1-hour frame, adhering well to it, and is on its way to breaking strongly upwards and retesting it.
We have support from the lower boundary of the descending channel at 0.3450.
We have a downtrend on the RSI indicator that is about to break and retest, supporting the upside.
There is a major support area in green at 0.3380, which represents a strong basis for the upside.
Don't forget a simple thing: ease and capital.
When you reach the first target, save some money and then change your stop-loss order to an entry order.
For inquiries, please leave a comment.
We have a trend to hold above the 100 Moving Average.
Entry price: 0.3580
First target: 0.3684
Second target: 0.3850
Third target: 0.4016
Don't forget a simple thing: ease and capital.
When you reach your first target, save some money and then change your stop-loss order to an entry order.
For inquiries, please leave a comment.
Thank you.

SEI Bulls Target 38% Gains — Are You In?📈 SEI/USDT – 4-Hour Chart Technical Analysis
SEI has developed a constructive bullish pattern on the 4-hour chart. After a prolonged sideways phase, price broke out of the consolidation range and climbed above the prior swing high around $0.3359, now sitting just under the critical resistance near $0.3435.
This region has been tested multiple times historically, with clear rejection wicks and prior sell pressure, marking it as an important threshold. The recent breakout momentum suggests buyers are gaining confidence, especially after the sharp impulse from the $0.3120 support zone.
If the market holds this level on a closing basis and confirms with some follow-through volume, the setup remains primed for further upside.
Even if a retracement occurs back toward $0.3120, the overall structure stays bullish while price trades above $0.2750, which has been the broader accumulation range for several weeks.
________________________________________
🟢 Trade Setup Summary
Entry Zone: $0.3359–$0.3435 (on breakout confirmation)
Stop Loss: Just below $0.3120 support
Target 1 (TP1): $0.3553 – Initial reaction zone
Target 2 (TP2): $0.4247 – Mid-term resistance
Target 3 (TP3): $0.4769 – Extended target
Risk: Approx. 9.17% downside if invalidated
Reward Potential: Up to 38.84% upside if the extended target is reached
Risk-Reward Ratio: ~4.23
________________________________________
From a broader perspective, this is a well-balanced setup with a tight invalidation point and clear upside roadmap. As long as the price continues to respect the $0.3120 floor, any short-term pullbacks can also be considered for spot reaccumulation or DCA entries.
Should the market push through $0.3435 with strong momentum, SEI will likely test the $0.3553 area quickly, followed by attempts to reclaim the higher ranges near $0.42–$0.47 over the coming sessions.
Let me know if you’d like to refine this further or prepare a version for publication or sharing with your community. 🚀

#SEI/USDT Ready to Fly? Breakout #SEI
The price is moving within a descending channel on the 1-hour frame, adhering well to it, and is on its way to breaking it strongly upwards and retesting it.
We have a bounce from the lower boundary of the descending channel. This support is at 0.3140.
We have a downtrend on the RSI indicator that is about to be broken and retested, supporting the upside.
There is a major support area (in green) at 0.3050, which represents a strong basis for the upside.
Don't forget a simple thing: ease and capital.
When you reach the first target, save some money and then change your stop-loss order to an entry order.
For inquiries, please leave a comment.
We have a trend to hold above the 100 Moving Average.
Entry price: 0.3246
First target: 0.3381
Second target: 0.3521
Third target: 0.3673
Don't forget a simple thing: ease and capital.
When you reach the first target, save some money and then change your stop-loss order to an entry order.
For inquiries, please leave a comment.
Thank you.

SEI/USDT Ready to Fly? Breakout from Accumulation Zone Signals🧠 Market Overview:
SEI/USDT has just delivered a powerful technical signal — a clean breakout from a major accumulation zone that has been holding price action for several months. With increasing volume and bullish price structure, this breakout could mark the beginning of a sustained upward trend.
The $0.24–$0.27 zone acted as a strong accumulation base. Now flipped into support, this area could serve as the launchpad for the next leg higher if price continues to hold above it.
📌 Pattern Breakdown:
🔸 Pattern: Accumulation Base Breakout
SEI traded sideways for nearly 6 months within a tight consolidation range.
This behavior is typical of institutional accumulation (smart money phase).
A strong bullish breakout above $0.27 has occurred.
Price has successfully retested the breakout level, confirming it as new support.
📈 Bullish Scenario (Primary Bias):
As long as SEI holds above the breakout zone ($0.26–$0.27), bullish continuation is likely.
🎯 Upside Targets:
$0.3521 → Minor resistance and key breakout validation.
$0.4715 → First major historical resistance.
$0.5900 → Strong price memory zone.
$0.5936 – $0.7025 → Key supply zone from previous market cycle.
$0.9407 up to $1.1450 → Long-term extension targets if bullish trend accelerates.
💡 Potential ROI from support to top target: Over 300%
📉 Bearish Scenario (Alternative View):
If price falls back below the breakout zone:
It could signal a false breakout (bull trap).
Price may re-enter the previous range and lose bullish momentum.
Downside levels to watch:
$0.21 (mid-range)
$0.17 (range low)
Failed breakout retest = bearish warning for long positions.
⚖️ Validation & Risk Strategy:
Breakout occurred with strong bullish volume → confirmation signal.
Ideal stop-loss: just below $0.25 to protect against invalidation.
Strategy: Buy on successful retest → Add if price breaks and holds above $0.35.
🧠 Pro Tip for Traders:
This setup is ideal for swing traders and mid-term investors.
The current breakout pattern is consistent with the Markup Phase in the Wyckoff Cycle.
Monitor market sentiment and volume to validate trend continuation.
If Bitcoin remains stable or bullish, altcoins like SEI may strongly outperform.
#SEI #SEIUSDT #BreakoutTrade #CryptoSignals #AltcoinAnalysis #ChartPattern #VolumeBreakout #TechnicalAnalysis #PriceAction #CryptoTraders

SEIUSDT on the Brink of a Major Explosion… or Total Breakdown?Yello Paradisers! Are you prepared to act with precision—or will you get trapped like the rest before the real move begins? #SEI has entered a highly reactive price zone where one wrong candle could invalidate the entire bullish structure. The market is whispering its next move, but only those who understand structure and timing will be ready to capitalize.
💎#SEIUSDT has completed a significant transition from a bearish trend structure to a more bullish one. Earlier, the price formed consecutive Lower Lows (LL) and Lower Highs (LH), confirming bearish momentum. However, that trend shifted once the market printed a Market Structure Break (MSB) around the 0.2121–0.2253 range. This area—previously acting as resistance—has now flipped into a confirmed support zone, marking a critical bullish development.
💎The structure strengthened further when SEI broke above the prior Higher High (HH) and created a Break of Structure (BOS). That move catapulted price into the red resistance zone between 0.2929 and 0.3152, just beneath the last major swing high at 0.3471. This zone is now acting as a ceiling, containing bullish pressure—but the underlying structure remains intact unless we see an invalidation close below key levels.
💎High probability, SEI i retracing back into the 0.618 Fibonacci level at 0.2269, which aligns precisely with the flipped support zone. This is a textbook bullish retest, and as long as the price holds above 0.2121, the probability for continuation remains high. The coming candles will be decisive: they will either confirm strength and fuel continuation—or fail and lead to a complete structure breakdown.
💎If buyers manage to hold the key support zone between 0.2269 and 0.2121, the probability of a bullish continuation increases significantly. The first major target on the upside is 0.3471, which marks the previous swing high and is likely to act as the initial area of resistance. A clean break above that level could open the path toward 0.3812, followed by 0.4086, both of which align with higher timeframe supply zones and represent strong historical resistance. These levels are expected to attract profit-taking and short-term volatility, making them critical decision points for continuation or rejection in the next phase of SEI’s move.
💎However, traders must be alert: any candle close below 0.1554 will serve as a hard invalidation level for this bullish thesis. If that happens, the structure flips bearish, and we would anticipate a deeper correction toward 0.1361 or even lower. That’s the line we are not willing to ignore—structure and discipline come first.
This is not the time to trade emotionally, Paradisers . Retail traders will act impulsively—either FOMOing at the highs or panic-selling at the lows. The smart move here is to observe how price reacts and only execute if there’s clear confirmation and structure support. No guessing. No gambling.
MyCryptoParadise
iFeel the success🌴

#SEI/USDT#SEI
The price is moving within a descending channel on the 1-hour frame, adhering well to it, and is heading for a strong breakout and retest.
We have a bounce from the lower boundary of the descending channel. This support is at 0.2745.
We have a downtrend on the RSI indicator that is about to be broken and retested, supporting the upside.
There is a major support area (in green) at 0.2710, which represents a strong basis for the upside.
Don't forget a simple thing: ease and capital.
When you reach the first target, save some money and then change your stop-loss order to an entry order.
For inquiries, please leave a comment.
We have a trend to hold above the 100 Moving Average.
Entry price: 0.2813
First target: 0.2887
Second target: 0.2983
Third target: 0.3112
Don't forget a simple thing: ease and capital.
When you reach the first target, save some money and then change your stop-loss order to an entry order.
For inquiries, please leave a comment.
Thank you.

#SEI/USDT#SEI
The price is moving within a descending channel on the 1-hour frame, adhering well to it, and is on its way to breaking it strongly upwards and retesting it.
We have a bounce from the lower boundary of the descending channel. This support is at 0.2470.
We have a downtrend on the RSI indicator that is about to be broken and retested, supporting the upside.
There is a major support area in green at 0.2440, which represents a strong basis for the upside.
Don't forget a simple thing: ease and capital.
When you reach the first target, save some money and then change your stop-loss order to an entry order.
For inquiries, please leave a comment.
We have a trend to hold above the 100 Moving Average.
Entry price: 0.2494
First target: 0.2545
Second target: 0.2600
Third target: 0.2690
Don't forget a simple thing: ease and capital.
When you reach the first target, save some money and then change your stop-loss order to an entry order.
For inquiries, please leave a comment.
Thank you.

Live trade hello friends✋️
Considering the price drop, you can now see that we are in important support and now we can take advantage of this situation and enter into a transaction with risk and capital management.
🔥Follow us for more signals🔥
*Trade safely with us*

SEI LIMIT FOR BUYHello friends
Due to the price drop, we can buy on the drop within the specified limits and move with it to the specified targets, of course with capital and risk management.
*Trade safely with us*

SEI/USDT Poised for a Major Breakout – Will It Surge Toward $0.7📊 Full Technical Analysis:
The SEI/USDT daily chart reveals a compelling setup with strong breakout potential. Here's a detailed breakdown:
🔍 Pattern & Key Structure:
Descending Trendline Breakout: SEI has successfully broken out of a long-term descending trendline that has suppressed price action since December 2024 — a strong early signal of a bullish reversal.
Bullish Retest in Progress: The price is currently retesting the breakout area, aligning with a historical demand zone and Fibonacci retracement levels of 0.5 ($0.2468) and 0.618 ($0.2259).
Previous Consolidation Zone: SEI previously moved sideways within a yellow box between $0.18 – $0.25. The breakout from this zone adds bullish confirmation.
🟢 Bullish Scenario:
If SEI holds above the key demand zone ($0.2259 – $0.2468), a strong rally could follow, targeting these Fibonacci resistance levels:
🔸 $0.3068
🔸 $0.3367
🔸 $0.4696
🔸 $0.5438
🔸 $0.6086
🔸 $0.6500
🔸 Final target: $0.7013 (major resistance)
This scenario is validated by a higher low formation and a continuation of the current uptrend, especially if backed by strong volume.
🔴 Bearish Scenario:
If the price breaks below the demand zone ($0.2259 – $0.2468), further downside may be expected, with potential support levels at:
🔻 0.786 Fibonacci at $0.1961
🔻 Historical support zones at $0.18 and $0.13
A bearish breakdown would invalidate the bullish structure and suggest sellers remain in control.
📐 Pattern Summary:
Pattern Type: Descending Trendline Breakout + Bullish Retest
Validation: Retest aligned with Fibonacci & prior consolidation
Bias: Bullish, as long as the price holds above $0.2259
📝 Conclusion:
SEI/USDT is showing early signs of a bullish reversal after a breakout from its long-term downtrend. A continuation toward higher Fibonacci levels is likely if the price holds the key demand zone. Traders should watch for bullish confirmation signals near support before entering.
#SEI #SEIUSDT #CryptoBreakout #BullishSetup #TechnicalAnalysis #FibonacciTrading #CryptoSignals #AltcoinSeason #ChartPattern #CryptoTA

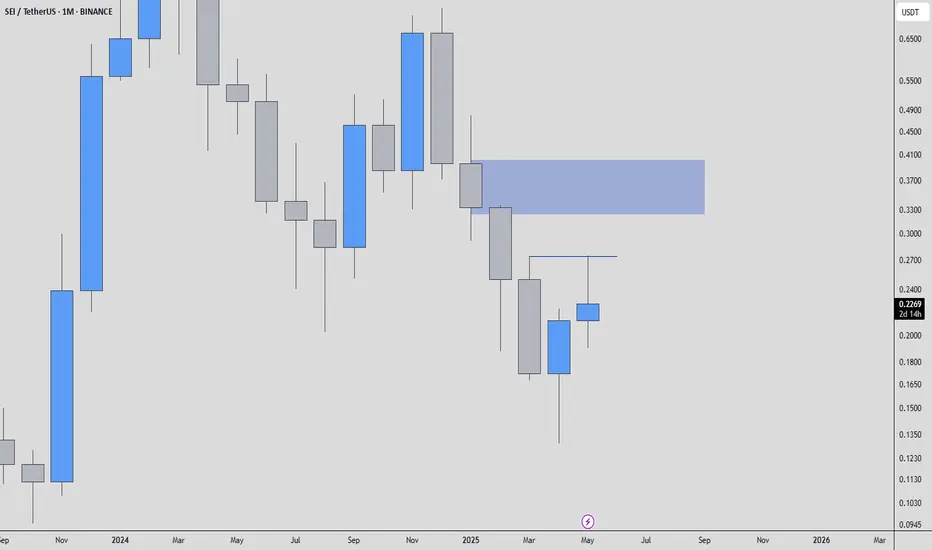
Important volume profile area: 0.2392
Hello, traders.
If you "follow", you can always get the latest information quickly.
Have a nice day today.
-------------------------------------
(SEIUSDT.P 1M chart)
I wonder what the 1M chart means on the futures chart, but if you know the current big picture trend, I think you can trade according to your main and secondary positions.
Currently, the volume profile section is formed at 0.2392 on the 1M chart, so it is expected that the major trend will be determined based on this point.
In other words, if the price is maintained above 0.2392, I think it is highly likely to turn into an uptrend.
-
(1W chart)
Currently, on the 1W chart, we are checking for support near the 0.2750 point, which is the StochRSI 80 indicator point.
The StochRSI 80 indicator is one of the indicators that indicates the high point section.
Therefore, if it is supported near the StochRSI 80 indicator, it is highly likely to rise.
On the other hand, if it is not supported, it is important to check for support because it corresponds to the resistance point.
Once the rise begins, it is basically likely to rise until it meets the HA-High indicator.
The HA-High indicator is currently formed at 0.7406.
However, when rising, there is a possibility of receiving resistance near the area where the arrow is pointing, so you should think about a countermeasure.
-
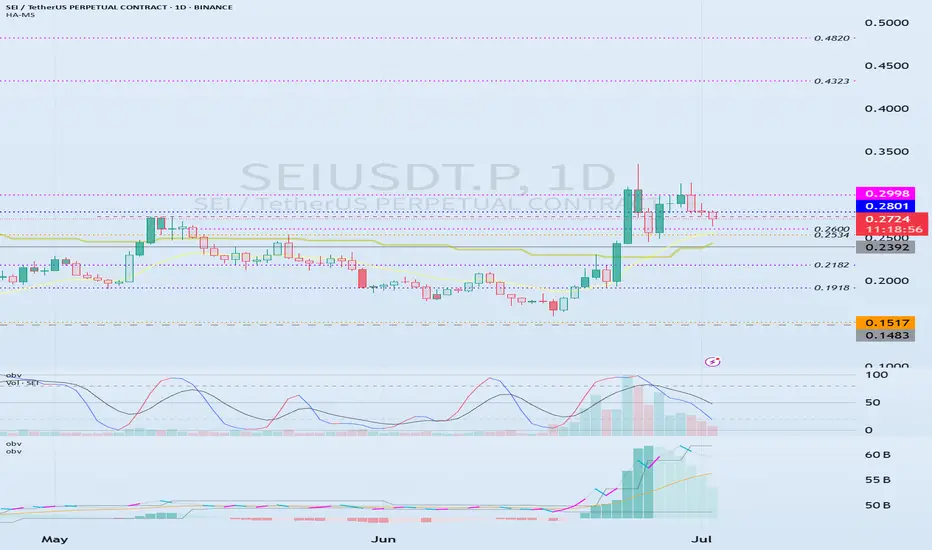
(1D chart)
In order to rise, the price must rise above the 0.2801-0.2998 range and maintain it.
If not, there is a possibility of falling until the HA-Low indicator is met.
However, since an important volume profile range is formed at the 0.2392 range, whether there is support near this area is an important issue.
Therefore, if it falls below 0.2392, it is recommended to stop trading and check the situation if possible.
If it rises above 0.2998, it seems likely to surge to the 0.4323-0.4820 range because the resistance range is weak.
-
Thank you for reading to the end.
I hope you have a successful trade.
--------------------------------------------------
- Here is an explanation of the big picture.
(3-year bull market, 1-year bear market pattern)
I will explain more details when the bear market starts.
------------------------------------------------------
SEI The next big Move#SEI
The price is moving within a descending channel on the 1-hour frame and is expected to break and continue upward.
We have a trend to stabilize above the 100 moving average once again.
We have a downtrend on the RSI indicator that supports the upward break.
We have a support area at the lower boundary of the channel at 0.2750, acting as strong support from which the price can rebound.
We have a major support area in green that pushed the price upward at 0.2600.
Entry price: 0.2813
First target: 0.2879
Second target: 0.2970
Third target: 0.3080
To manage risk, don't forget stop loss and capital management.
When you reach the first target, save some profits and then change your stop order to an entry order.
For inquiries, please comment.
Thank you.

SEI Just Broke Out - Massive Rally Incoming?SEIUSDT Technical analysis update
SEIUSDT is testing a long-term descending trendline, which has acted as strong resistance on multiple occasions. Price has now broken above this level with strong volume, signaling a potential trend reversal. And price trading above 100 and 200 EMA, in the coming trading days, we can see a strong bullish move in SEI
NYSE:SEI

#SEI/USDT#SEI
The price is moving within a descending channel on the 1-hour frame, adhering well to it, and is on its way to breaking it strongly upwards and retesting it.
We are seeing a rebound from the lower boundary of the descending channel, which is support at 0.2942.
We have a downtrend on the RSI indicator that is about to break and retest, which supports the upward trend.
We are looking for stability above the 100 moving average.
Entry price: 0.3062
First target: 0.3151
Second target: 0.3290
Third target: 0.3421

#SEI/USDT#SEI
The price is moving within a descending channel on the 1-hour frame and is expected to break and continue upward.
We have a trend to stabilize above the 100 moving average once again.
We have a downtrend on the RSI indicator, which supports the upward move by breaking it upward.
We have a support area at the lower limit of the channel at 0.2696, acting as strong support from which the price can rebound.
Entry price: 0.2790
First target: 0.2894
Second target: 0.3030
Third target: 0.3177

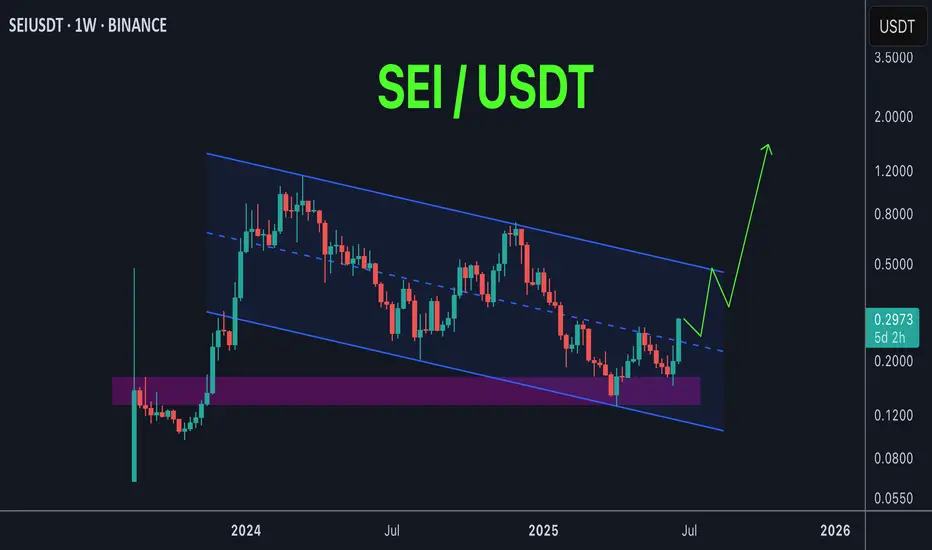
SEI possible playout SEI / USDT
Price is trading inside big descending channel
Next stop : price will hit the upper trendline of the channel and if managed to breakout this resistance it will skyrocket maybe to new ATH
Keep an eye on it …
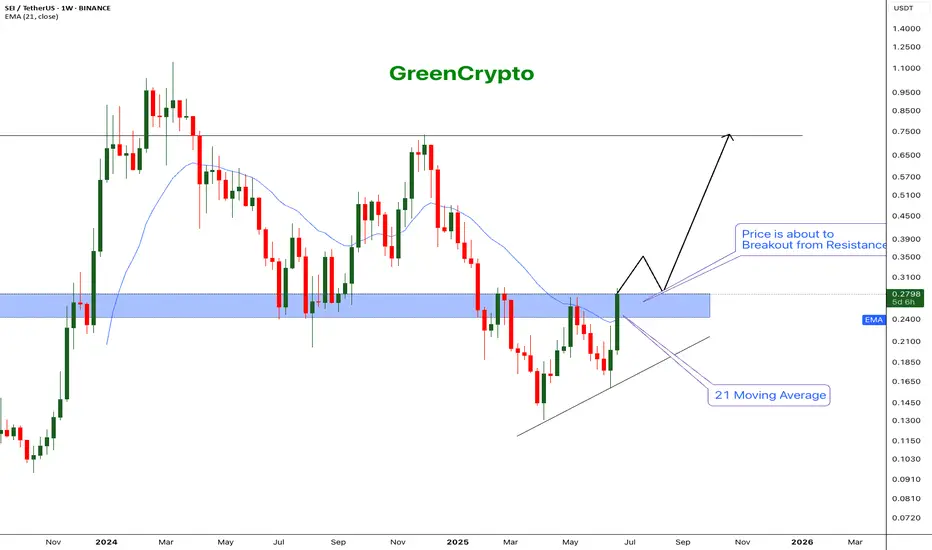
SEI - The next big runner$BINANCE:SEI/USDT (1W CHART) Technical Analysis Update
SEI is currently trading at $0.2785 and showing overall bullish sentiment
Price successfully breached the 21 EMA and now price is trading near one of the major resistance zone.
If the weekly candles closes above the resistance then we can expect further bullish momentum.
I'm expecting the price to easily break the resistance and hit the next major resistanc e around 0.75
Entry: After close above resistance (0.285)
StopLoss: 0.18
TakeProfit 1: 0.3506
TakeProfit 2: 0.4962
TakeProfit 3: 0.7367
Don't forget to keep stoploss!
Follow our TradingView account for more technical analysis updates. | Like, share, and comment your thoughts.
Cheers
GreenCrypto
#SEI/USDT#SEI
The price is moving within a descending channel on the 1-hour frame, adhering well to it, and is heading for a strong breakout and retest.
We are experiencing a rebound from the lower boundary of the descending channel. This support is at 0.1725.
We are experiencing a downtrend on the RSI indicator, which is about to break and retest, supporting the upward trend.
We are heading for stability above the 100 Moving Average.
Entry price: 0.1766
First target: 0.1794
Second target: 0.1834
Third target: 0.1890

#SEI/USDT#SEI
The price is moving within a descending channel on the 1-hour frame, adhering well to it, and is heading for a strong breakout and retest.
We are experiencing a rebound from the lower boundary of the descending channel, which is support at 0.1840.
We are experiencing a downtrend on the RSI indicator, which is about to break and retest, supporting the upward trend.
We are in a trend of consolidation above the 100 Moving Average.
Entry price: 0.1927
First target: 0.1999
Second target: 0.2067
Third target: 0.2162

SEIUSDT - MEH!Hello everyone. I'm closely monitoring SEIUSDT, and I've observed significant activity in this asset: buyers have entered the market. This is a situation that demands close attention, as it carries the potential to shift the market's trajectory.
Our current focus is the blue box I've marked on the chart. This area currently presents itself as a resistance level. However, if buyers continue to strengthen and decisively break this blue box upwards, that's when a real opportunity could emerge. In such a scenario, following the breakout, I'll be looking for a retest on a low timeframe (LTF). If the price confirms this broken level as support, that will be a strong long position signal for me. This is one of those moments where the market is telling you, "I'm here."
When evaluating this scenario, I won't, of course, rely solely on price action. I'll be closely examining the volume footprint; understanding the true strength and intent of buyers is crucial. At the same time, I won't overlook CDV (Cumulative Delta Volume) divergences, as these can reveal hidden shifts in momentum. Sudden increases in volume, as always, act as a magnet for me; because, as you know, I only trade coins that are showing a sudden spike in volume. This is one of the secrets the market whispers to you.
However, as always, the market is two-sided, and we must remain flexible. If buyers fail to break this blue box and we see decisive downward breakouts on the daily timeframe, this could also present a potential scenario for a short attempt. Remember, the market can act independently of our expectations, and as a trader with one of the highest win rates, I always move according to the direction the market shows us.
We must also be vigilant against potential liquidity hunts at these levels. Price briefly pushing above the blue box and then rapidly falling back, or dipping below and then recovering, could be manipulations designed to shake out weaker hands. Failed breakouts or the regaining of lost levels will also provide us with valuable information.
Don't be surprised to see significant movements in SEIUSDT in the coming days. You might regret missing this setup, as most traders overlook these nuances at this level. Stay tuned, and let's decipher what the market is whispering together. You can trust my perspective.
📌I keep my charts clean and simple because I believe clarity leads to better decisions.
📌My approach is built on years of experience and a solid track record. I don’t claim to know it all but I’m confident in my ability to spot high-probability setups.
📌If you would like to learn how to use the heatmap, cumulative volume delta and volume footprint techniques that I use below to determine very accurate demand regions, you can send me a private message. I help anyone who wants it completely free of charge.
🔑I have a long list of my proven technique below:
🎯 ZENUSDT.P: Patience & Profitability | %230 Reaction from the Sniper Entry
🐶 DOGEUSDT.P: Next Move
🎨 RENDERUSDT.P: Opportunity of the Month
💎 ETHUSDT.P: Where to Retrace
🟢 BNBUSDT.P: Potential Surge
📊 BTC Dominance: Reaction Zone
🌊 WAVESUSDT.P: Demand Zone Potential
🟣 UNIUSDT.P: Long-Term Trade
🔵 XRPUSDT.P: Entry Zones
🔗 LINKUSDT.P: Follow The River
📈 BTCUSDT.P: Two Key Demand Zones
🟩 POLUSDT: Bullish Momentum
🌟 PENDLEUSDT.P: Where Opportunity Meets Precision
🔥 BTCUSDT.P: Liquidation of Highly Leveraged Longs
🌊 SOLUSDT.P: SOL's Dip - Your Opportunity
🐸 1000PEPEUSDT.P: Prime Bounce Zone Unlocked
🚀 ETHUSDT.P: Set to Explode - Don't Miss This Game Changer
🤖 IQUSDT: Smart Plan
⚡️ PONDUSDT: A Trade Not Taken Is Better Than a Losing One
💼 STMXUSDT: 2 Buying Areas
🐢 TURBOUSDT: Buy Zones and Buyer Presence
🌍 ICPUSDT.P: Massive Upside Potential | Check the Trade Update For Seeing Results
🟠 IDEXUSDT: Spot Buy Area | %26 Profit if You Trade with MSB
📌 USUALUSDT: Buyers Are Active + %70 Profit in Total
🌟 FORTHUSDT: Sniper Entry +%26 Reaction
🐳 QKCUSDT: Sniper Entry +%57 Reaction
📊 BTC.D: Retest of Key Area Highly Likely
📊 XNOUSDT %80 Reaction with a Simple Blue Box!
📊 BELUSDT Amazing %120 Reaction!
📊 Simple Red Box, Extraordinary Results
📊 TIAUSDT | Still No Buyers—Maintaining a Bearish Outlook
📊 OGNUSDT | One of Today’s Highest Volume Gainers – +32.44%
I stopped adding to the list because it's kinda tiring to add 5-10 charts in every move but you can check my profile and see that it goes on..