#SEI/USDT#SEI
The price is moving within a descending channel on the 1-hour frame, adhering well to it, and is on its way to breaking it strongly upwards and retesting it.
We are seeing a bounce from the lower boundary of the descending channel, which is support at 0.2170.
We have a downtrend on the RSI indicator that is about to break and retest, supporting the upward trend.
We are looking for stability above the 100 moving average.
Entry price: 0.2310
First target: 0.2372
Second target: 0.2446
Third target: 0.2563
SEIUSD

SEI Turns Bullish After A Zig-Zag CorrectionSEI Turns Bullish After A Zig-Zag Correction, as we see it sharply bouncing from projected support that can send the price higher by Elliott wave theory.
SEI with ticker SEIUSD is waking up exactly from the channel support line and equality measurement of waves A=C, which is perfect textbook support for subwave (5) of an impulse into wave C of an ABC zig-zag correction. It's actually nicely and impulsively rising for wave 1, so after current wave 2 pullback, be aware of a bullish continuation within wave 3 of a five-wave bullish cycle, especially if breaks above 0.30 first bullish evidence level.
Sei (SEI) is a high-performance Layer 1 blockchain designed specifically for decentralized finance (DeFi) and decentralized exchanges (DEXs). Launched in August 2023 by Sei Labs, it features innovations like Twin-Turbo Consensus for fast block finality, Optimistic Parallelization for high throughput, and SeiDB for efficient transaction handling. It supports EVM compatibility, enabling seamless deployment of Ethereum-based apps. The SEI token is used for transaction fees, staking, governance, and liquidity.

SEI LIVE TRADEHello friends
Given the decline we had, we expect to experience another decline and we can open a trade in the direction of the trend with capital and risk management.
*Trade safely with us*

Sei long term.I expect it to reach 0.18 levels in the coming period, but before that, prices may approach 0.26 again. I expect the 3rd elliot wave to start between approximately 0.18 0.16 region.
* The purpose of my graphic drawings is purely educational.
* What i write here is not an investment advice. Please do your own research before investing in any asset.
* Never take my personal opinions as investment advice, you may lose your money.

SEIUSDT 1D AnalysisSEI ~ 1D Analysis
#SEI Buy gradually after retesting this support block with a short term target of at least 15%+ from here.

SEI breaks the downtrend targets 30cThe SEI network is currently displaying positive price movement after recently breaking out of a downward trend channel that had been in place since the peak on December 5th. On the daily chart, it has been trading sideways within the upper channel, indicating a potential retest of that breakout. However, the momentum isn't particularly strong, especially since Ethereum, the frontrunner in the altcoin resurgence, isn't exhibiting explosive upward movement either.
Should the situation shift and Ethereum regain its leading position, I believe that many struggling smart contract platforms, which have seen their prices plummet by over 80%, could also experience a robust recovery.
If Ethereum manages to climb back into the $2,000+ range, I anticipate that SEI will reach its target on the chart, which is approximately 30 cents.

#SEI/USDT#SEI
The price is moving within a descending channel on the 1-hour frame, adhering well to it, and is heading towards a strong breakout and retest.
We are seeing a bounce from the lower boundary of the descending channel, which is support at 0.2550.
We have a downtrend on the RSI indicator that is about to be broken and retested, which supports the upward trend.
We are looking for stability above the 100 Moving Average.
Entry price: 0.2579
First target: 0.2626
Second target: 0.2681
Third target: 0.2750

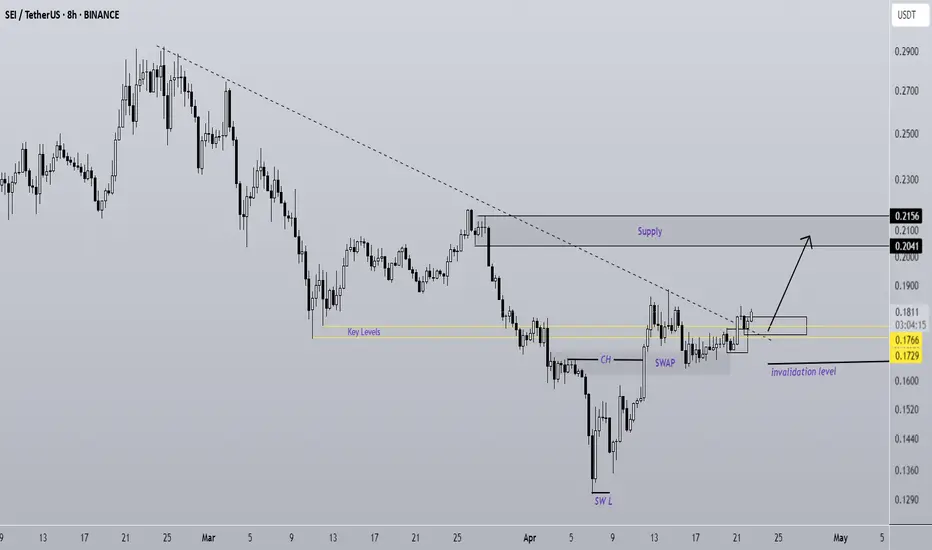
SEI Is A Rocket (8H)SEI has started a strong move from the bottom.
After breaking through a resistance zone with little to no reaction, it has now formed a SWAP zone.
Buy orders have been effectively transferred from the SWAP area into the candles, and the price shows strong momentum to push toward higher levels.
As long as the demand zone holds, SEI has the potential to reach the marked target area | or even go beyond it.
However, a daily candle closing below the invalidation level would invalidate this analysis.
Do not enter the position without capital management and stop setting
Comment if you have any questions
thank you
#SEI/USDT#SEI
The price is moving within a descending channel on the 1-hour frame and is expected to break and continue upward.
We have a trend to stabilize above the 100 moving average once again.
We have a downtrend on the RSI indicator that supports the upward move with a breakout.
We have a support area at the lower limit of the channel at 0.2000, which acts as strong support from which the price can rebound.
Entry price: 0.2032
First target: 0.2074
Second target: 0.2119
Third target: 0.2164

#SEI/USDT#SEI
The price is moving within a descending channel on the 1-hour frame and is expected to break and continue upward.
We have a trend to stabilize above the 100 moving average once again.
We have a downtrend on the RSI indicator, which supports the upward move by breaking it upward.
We have a support area at the lower limit of the channel at 0.1880, acting as strong support from which the price can rebound.
Entry price: 0.1916
First target: 0.1954
Second target: 0.1998
Third target: 0.2052

#SEI/USDT#SEI
The price is moving within a descending channel on the 1-hour frame, adhering well to it, and is heading for a strong breakout and retest.
We are seeing a bounce from the lower boundary of the descending channel, which is support at 0.1693.
We have a downtrend on the RSI indicator that is about to be broken and retested, supporting the upward trend.
We are looking for stability above the 100 moving average.
Entry price: 0.1700
First target: 0.1724
Second target: 0.1743
Third target: 0.1766

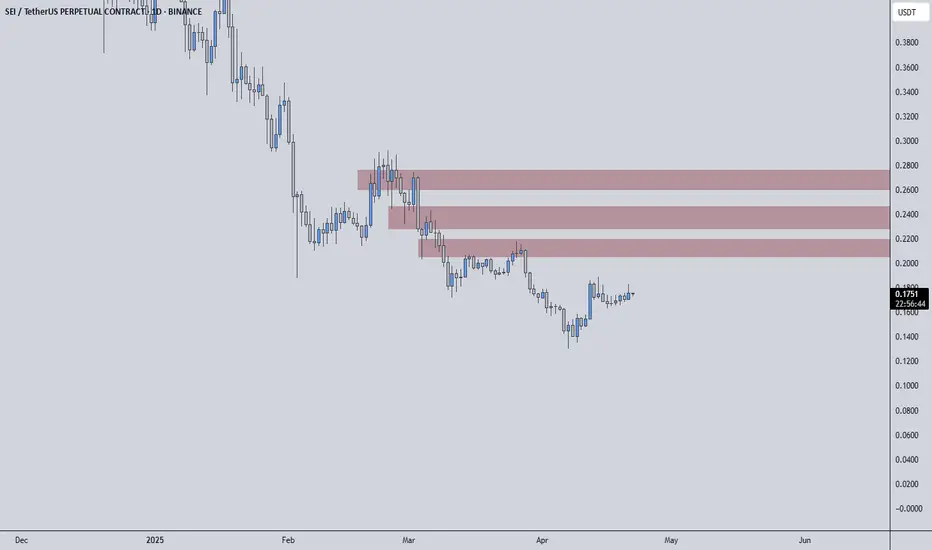
SEIUSDT | Weak Structure Persists, Eyes on Red Box ResistanceSEIUSDT continues to reflect weakness in its structure, and until proven otherwise, the red boxes remain key resistance zones. Buyers are still not stepping in with meaningful strength, and the overall market context doesn’t support a bullish shift yet.
🔴 Resistance Zones Are Still Dominant
The red boxes align with former support levels that now act as barriers. This type of flip often traps late buyers and offers great setups for short opportunities — but only with confirmation.
🔍 What to Watch For
Lower-Time-Frame Breakdown Patterns: Inside these red boxes, look for signs like bearish engulfing candles or lower highs on the 5-15 min charts.
CDV & Orderflow Weakness: If cumulative delta volume and tape show absorption or hidden selling, the likelihood of rejection increases.
Risk Management First: Use these zones not just for direction, but for well-defined invalidation points. If price pushes through and retests from above, then it's time to pivot your bias.
🚨 If Buyers Show Up…
I won’t stick to my short bias blindly. If SEIUSDT can break through the red resistance with strength, and more importantly hold above it, I will reassess and look for long setups — especially on the retest with bullish confirmations.
Markets can shift quickly, and we trade based on what the chart shows, not what we hope. For now, SEI remains under pressure. Be patient, act on signals, and never force a trade just because the price is near a key level.
📌I keep my charts clean and simple because I believe clarity leads to better decisions.
📌My approach is built on years of experience and a solid track record. I don’t claim to know it all but I’m confident in my ability to spot high-probability setups.
📌If you would like to learn how to use the heatmap, cumulative volume delta and volume footprint techniques that I use below to determine very accurate demand regions, you can send me a private message. I help anyone who wants it completely free of charge.
🔑I have a long list of my proven technique below:
🎯 ZENUSDT.P: Patience & Profitability | %230 Reaction from the Sniper Entry
🐶 DOGEUSDT.P: Next Move
🎨 RENDERUSDT.P: Opportunity of the Month
💎 ETHUSDT.P: Where to Retrace
🟢 BNBUSDT.P: Potential Surge
📊 BTC Dominance: Reaction Zone
🌊 WAVESUSDT.P: Demand Zone Potential
🟣 UNIUSDT.P: Long-Term Trade
🔵 XRPUSDT.P: Entry Zones
🔗 LINKUSDT.P: Follow The River
📈 BTCUSDT.P: Two Key Demand Zones
🟩 POLUSDT: Bullish Momentum
🌟 PENDLEUSDT.P: Where Opportunity Meets Precision
🔥 BTCUSDT.P: Liquidation of Highly Leveraged Longs
🌊 SOLUSDT.P: SOL's Dip - Your Opportunity
🐸 1000PEPEUSDT.P: Prime Bounce Zone Unlocked
🚀 ETHUSDT.P: Set to Explode - Don't Miss This Game Changer
🤖 IQUSDT: Smart Plan
⚡️ PONDUSDT: A Trade Not Taken Is Better Than a Losing One
💼 STMXUSDT: 2 Buying Areas
🐢 TURBOUSDT: Buy Zones and Buyer Presence
🌍 ICPUSDT.P: Massive Upside Potential | Check the Trade Update For Seeing Results
🟠 IDEXUSDT: Spot Buy Area | %26 Profit if You Trade with MSB
📌 USUALUSDT: Buyers Are Active + %70 Profit in Total
🌟 FORTHUSDT: Sniper Entry +%26 Reaction
🐳 QKCUSDT: Sniper Entry +%57 Reaction
📊 BTC.D: Retest of Key Area Highly Likely
📊 XNOUSDT %80 Reaction with a Simple Blue Box!
📊 BELUSDT Amazing %120 Reaction!
I stopped adding to the list because it's kinda tiring to add 5-10 charts in every move but you can check my profile and see that it goes on..
#SEI/USDT#SEI
The price is moving within a descending channel on the 1-hour frame, adhering well to it, and is heading for a strong breakout and retest.
We are seeing a bounce from the lower boundary of the descending channel, which is support at 0.1754.
We have a downtrend on the RSI indicator that is about to be broken and retested, supporting the upward trend.
We are looking for stability above the 100 moving average.
Entry price: 0.1823
First target: 0.1847
Second target: 0.1884
Third target: 0.1942

#SEI/USDT#SEI
The price is moving within a descending channel on the 1-hour frame, adhering well to it, and is heading for a strong breakout and retest.
We are experiencing a rebound from the lower boundary of the descending channel, which is support at 0.1600.
We are experiencing a downtrend on the RSI indicator, which is about to break and retest, supporting the upward trend.
We are looking for stability above the 100 Moving Average.
Entry price: 0.1614
First target: 0.1625
Second target: 0.1642
Third target: 0.1665

#SEI/USDT#SEI
The price is moving within a descending channel on the 1-hour frame and is expected to continue upward.
We have a trend to stabilize above the 100 moving average once again.
We have a downtrend on the RSI indicator that supports the upward move with a breakout.
We have a support area at the lower boundary of the channel at 0.1700.
Entry price: 0.1730
First target: 0.1764
Second target: 0.1808
Third target: 0.1850

SEIUSDT 1DSEI ~ 1D Analysis
#SEI Buy gradually after successfully penetrating this resistant line with a short -term target of at least 10%+.

SEIUSDT 3DSEI ~ 3D Analysis
#SEI Buy back while visiting this support with a short -term target of at least 20%+.

SEI/USDT:BUY LIMITHello dear friends
Given the price drop we had in the specified support range, the price has been able to create higher ceilings and floors.
Now, given the good support of buyers for the price, we can buy in steps with capital and risk management and move towards the specified goals.
*Trade safely with us*

#SEI/USDT#SEI
The price is moving within a descending channel on the 1-hour frame and is expected to continue lower.
We have a trend to stabilize below the 100 moving average once again.
We have a downtrend on the RSI indicator, supporting the upward move with a break above it.
We have a resistance area at the upper limit of the channel at 0.1920.
Entry price: 0.1915
First target: 0.1851
Second target: 0.1813
Third target: 0.1770

SEI New Update (1D)This analysis is an update of the analysis you see in the "Related publications" section
Considering the strength of the wave and the status of Bitcoin and other key indices, we have slightly lowered the support zone, as this coin may form a deeper correction for wave C.
We have also updated the targets.
Let’s see what happens.
For risk management, please don't forget stop loss and capital management
When we reach the first target, save some profit and then change the stop to entry
Comment if you have any questions
Thank You

SEI Poised for a Breakout After Bold 23andMe Acquisition Bid !Sei (SEI), the innovative layer-1 blockchain designed for high-speed trading and decentralized finance (DeFi), is flashing strong bullish signals both fundamentally and technically. The recent news that the Sei Foundation is exploring the acquisition of 23andMe, the leading personal genomics company, has sparked excitement in the market. If successful, this strategic move could position Sei at the forefront of the multi-billion-dollar genomic data industry — combining blockchain’s security and transparency with the rapidly growing demand for data privacy.
Why This Is Huge
23andMe recently filed for Chapter 11 bankruptcy protection, opening the door for a potential buyout. The Sei Foundation’s plan to migrate genetic data onto the blockchain would give individuals direct control over their data, allowing them to decide how it’s used and even monetize it. This taps into a massive and underserved market where data security and privacy are becoming critical issues.
Bullish Chart Setup
From a technical perspective, Sei’s chart is showing signs of a major breakout:
✅ Double Bottom: SEI has recently formed a clear double bottom pattern, signaling a strong reversal from recent lows. This is a classic bullish pattern that suggests the selling pressure has been exhausted and buyers are stepping in.
✅ Falling Wedge: SEI is also breaking out of a falling wedge, a high-probability bullish formation. Falling wedges typically lead to strong upside moves as downward momentum fades and buying pressure builds up.
✅ Volume Increasing: Recent spikes in volume confirm that smart money could be accumulating in anticipation of a breakout.
Perfect Storm for a Rally
With a bullish technical setup aligning with a game-changing fundamental catalyst, Sei could be on the verge of a major breakout. A successful acquisition of 23andMe would not only give Sei real-world utility in the health data sector but also drive increased adoption and network activity. If SEI clears key resistance levels, this combination of technical strength and strategic growth could send the token to new highs.
Sei isn’t just another DeFi project — it's positioning itself to be a leader at the intersection of blockchain, health data, and privacy.
This could be the beginning of a powerful new trend for SEI. 🚀

#SEI/USDT#SEI
The price is moving within a descending channel on the 1-hour frame, adhering well to it, and is heading for a strong breakout and retest.
We are seeing a bounce from the lower boundary of the descending channel, which is support at 0.1880.
We have a downtrend on the RSI indicator that is about to be broken and retested, supporting the upward trend.
We are looking for stability above the 100 Moving Average.
Entry price: 0.1944
First target: 0.1979
Second target: 0.2017
Third target: 0.2059

SEI ANALYSIS (1D)SEI appears to be in the C leg of a corrective structure. The correction for this coin is not yet complete in terms of time and price. Wave C is a time-consuming wave, and it is expected to push the price down to the green zone. After reaching this area and accumulating orders, the price is likely to start its move in the form of Wave D.
The targets for the next wave are marked on the chart.
A daily candle closing below the invalidation level will invalidate this analysis
For risk management, please don't forget stop loss and capital management
Comment if you have any questions
Thank You
