SEI/USDT Ready to Fly? Breakout from Accumulation Zone Signals🧠 Market Overview:
SEI/USDT has just delivered a powerful technical signal — a clean breakout from a major accumulation zone that has been holding price action for several months. With increasing volume and bullish price structure, this breakout could mark the beginning of a sustained upward trend.
The $0.24–$0.27 zone acted as a strong accumulation base. Now flipped into support, this area could serve as the launchpad for the next leg higher if price continues to hold above it.
📌 Pattern Breakdown:
🔸 Pattern: Accumulation Base Breakout
SEI traded sideways for nearly 6 months within a tight consolidation range.
This behavior is typical of institutional accumulation (smart money phase).
A strong bullish breakout above $0.27 has occurred.
Price has successfully retested the breakout level, confirming it as new support.
📈 Bullish Scenario (Primary Bias):
As long as SEI holds above the breakout zone ($0.26–$0.27), bullish continuation is likely.
🎯 Upside Targets:
$0.3521 → Minor resistance and key breakout validation.
$0.4715 → First major historical resistance.
$0.5900 → Strong price memory zone.
$0.5936 – $0.7025 → Key supply zone from previous market cycle.
$0.9407 up to $1.1450 → Long-term extension targets if bullish trend accelerates.
💡 Potential ROI from support to top target: Over 300%
📉 Bearish Scenario (Alternative View):
If price falls back below the breakout zone:
It could signal a false breakout (bull trap).
Price may re-enter the previous range and lose bullish momentum.
Downside levels to watch:
$0.21 (mid-range)
$0.17 (range low)
Failed breakout retest = bearish warning for long positions.
⚖️ Validation & Risk Strategy:
Breakout occurred with strong bullish volume → confirmation signal.
Ideal stop-loss: just below $0.25 to protect against invalidation.
Strategy: Buy on successful retest → Add if price breaks and holds above $0.35.
🧠 Pro Tip for Traders:
This setup is ideal for swing traders and mid-term investors.
The current breakout pattern is consistent with the Markup Phase in the Wyckoff Cycle.
Monitor market sentiment and volume to validate trend continuation.
If Bitcoin remains stable or bullish, altcoins like SEI may strongly outperform.
#SEI #SEIUSDT #BreakoutTrade #CryptoSignals #AltcoinAnalysis #ChartPattern #VolumeBreakout #TechnicalAnalysis #PriceAction #CryptoTraders
Seiusdtanalysis

SEI/USDT Poised for a Major Breakout – Will It Surge Toward $0.7📊 Full Technical Analysis:
The SEI/USDT daily chart reveals a compelling setup with strong breakout potential. Here's a detailed breakdown:
🔍 Pattern & Key Structure:
Descending Trendline Breakout: SEI has successfully broken out of a long-term descending trendline that has suppressed price action since December 2024 — a strong early signal of a bullish reversal.
Bullish Retest in Progress: The price is currently retesting the breakout area, aligning with a historical demand zone and Fibonacci retracement levels of 0.5 ($0.2468) and 0.618 ($0.2259).
Previous Consolidation Zone: SEI previously moved sideways within a yellow box between $0.18 – $0.25. The breakout from this zone adds bullish confirmation.
🟢 Bullish Scenario:
If SEI holds above the key demand zone ($0.2259 – $0.2468), a strong rally could follow, targeting these Fibonacci resistance levels:
🔸 $0.3068
🔸 $0.3367
🔸 $0.4696
🔸 $0.5438
🔸 $0.6086
🔸 $0.6500
🔸 Final target: $0.7013 (major resistance)
This scenario is validated by a higher low formation and a continuation of the current uptrend, especially if backed by strong volume.
🔴 Bearish Scenario:
If the price breaks below the demand zone ($0.2259 – $0.2468), further downside may be expected, with potential support levels at:
🔻 0.786 Fibonacci at $0.1961
🔻 Historical support zones at $0.18 and $0.13
A bearish breakdown would invalidate the bullish structure and suggest sellers remain in control.
📐 Pattern Summary:
Pattern Type: Descending Trendline Breakout + Bullish Retest
Validation: Retest aligned with Fibonacci & prior consolidation
Bias: Bullish, as long as the price holds above $0.2259
📝 Conclusion:
SEI/USDT is showing early signs of a bullish reversal after a breakout from its long-term downtrend. A continuation toward higher Fibonacci levels is likely if the price holds the key demand zone. Traders should watch for bullish confirmation signals near support before entering.
#SEI #SEIUSDT #CryptoBreakout #BullishSetup #TechnicalAnalysis #FibonacciTrading #CryptoSignals #AltcoinSeason #ChartPattern #CryptoTA

$SEI Testing Critical Resistance After BreakoutNYSE:SEI has finally broken above the long-standing resistance trendline, a strong sign of bullish momentum building up.
Right now, it’s facing some pressure at the marked resistance zone. If bulls manage to flip this area into support, we could see the next leg up. But if it gets rejected here, a short pullback or retest isn’t off the table.
Let the level decide the next move — no need to chase.
DYOR, NFA

SEIUSDT 1D AnalysisSEI ~ 1D Analysis
#SEI Buy gradually after retesting this support block with a short term target of at least 15%+ from here.

#SEIUSDT remains in bullish continuation mode📉 LONG BYBIT:SEIUSDT.P from $0.2747
🛡 Stop loss: $0.2640
🕒 Timeframe: 4H
✅ Market Overview:
➡️ Falling Wedge pattern has played out — confirmed breakout to the upside.
➡️ A strong Inverse Head and Shoulders pattern is visible — neckline broken with momentum.
➡️ Volume increases on upward impulse — bullish confirmation.
➡️ Current price is consolidating slightly — likely preparing for the next leg up.
➡️ POC at $0.1697 is far below — market structure flipped bullish.
➡️ Clear upward projection toward the $0.2810–$0.2910 range.
🎯 TP Targets:
💎 TP 1: $0.2810
💎 TP 2: $0.2870
💎 TP 3: $0.2910
📢 Holding above $0.2740 confirms bullish structure.
📢 Watch for minor resistance near TP1, then potential continuation to TP2 and TP3.
📢 Secure partial profits at TP1, and let the rest ride toward higher targets.
📢 It’s advisable to partially take profits near the specified resistance levels.
📢 A retest of the breakout zone (around $0.22) is possible — this can be used for adding to the position.
🚀 BYBIT:SEIUSDT.P remains in bullish continuation mode — targets still active!

SEIUSDT 1DSEI ~ 1D Analysis
#SEI Buy gradually after successfully penetrating this resistant line with a short -term target of at least 10%+.

SEIUSDT 3DSEI ~ 3D Analysis
#SEI Buy back while visiting this support with a short -term target of at least 20%+.

#SEIUSDT maintains bullish momentum📈 LONG BYBIT:SEIUSDT.P from $0.2922
🛡 Stop Loss: $0.2867
⏱ 1H Timeframe
✅ Overview:
➡️ BYBIT:SEIUSDT.P is in an uptrend after consolidating in the support zone, confirming buyer dominance.
➡️ Volume Profile indicates that the main liquidity ( POC ) is positioned at $0.274, confirming volume redistribution towards buying.
➡️ A breakout above $0.2922 and consolidation will trigger further upside movement.
➡️ The nearest targets are in the $0.2980 – $0.3030 range, where profit-taking may occur.
⚡ Plan:
➡️ Long entry upon breaking $0.2922, confirming bullish momentum.
➡️ Stop-Loss at $0.2867—placed below the nearest liquidity zone to minimize risk.
➡️ Main targets: $0.2980 and $0.3030, where partial profit-taking may be considered.
🎯 TP Targets:
💎 TP 1: $0.2980
🔥 TP 2: $0.3030
🚀 BYBIT:SEIUSDT.P maintains bullish momentum — expecting further upside!
📢 BYBIT:SEIUSDT.P is forming a bullish trend, and consolidation above $0.2922 may accelerate the uptrend.
📢 Monitor price reactions around $0.3030, as this could act as a resistance zone for potential corrections.

SEIUSDT 3DSEI ~ 3D Analysis
#SEI Buy from here if you still have a Conviction on this coin with a minimum target of 20%++.
SEIUSDT 4DSEI ~ 4D Analysis
#SEI If you still have a Conviction on this Coin, buy gradually from here with a minimum target of 20%++

SEIUSDT 3DSEI ~ 3D
#SEI If you still have Conviction on the coin,. Buy gradually within this support block. with a short term target of at least 20%++

SEIUSDT 3DSEI ~ 3D
#SEI still has good bullish momentum for now. if you still have Conviction on this coin,. This support block would be a very good buying place for now,. with a minimum target of 15%++

SEIUSDT - UniverseMetta - Analysis#SEIUSDT - UniverseMetta - Analysis
You can see the formation of a 3-wave structure with a retest of the lower trend line. Also, if you look at the senior timeframe, you can see that this movement is possible the beginning of the impulse of the 5th wave. From these levels, you can try to increase the asset in the portfolio. Global levels can be considered for updating ATH.
Target: 0.5799 - 1.1450

SEIUSDT - UniverseMetta - Analysis#SEIUSDT - UniverseMetta - Analysis
You can observe fixation behind the trend line and the formation of a 3-wave structure with an inverted head and shoulders pattern. Also, if you look at the senior timeframe, you can see that this movement is corrective from the impulse of the 1st wave and you can see a slowdown after reaching a correction of more than 70%. From these levels, you can try to add this asset to your portfolio. Global levels can be considered for updating ATH.
Target: 0.4329 - 1.1450

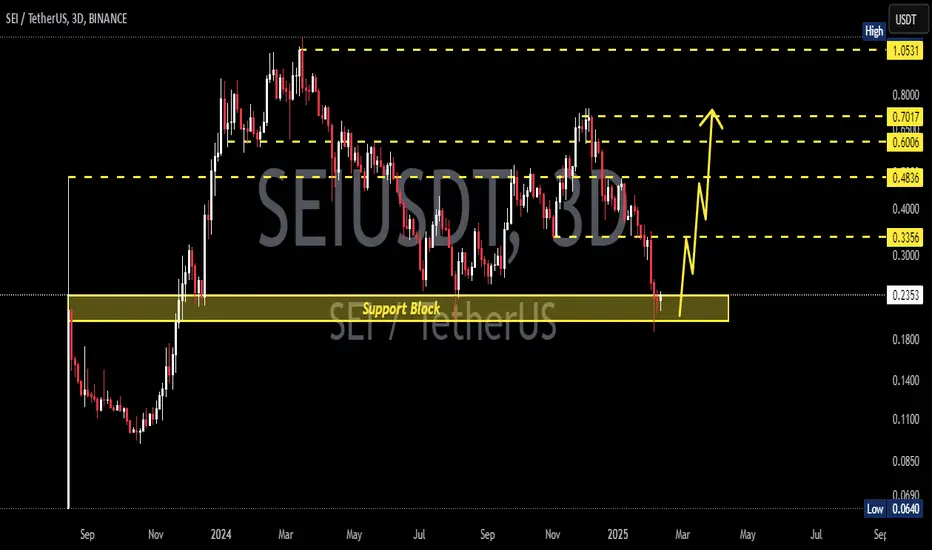
SEIUSDTSEI ~ 3D
#SEI If you have Conviction on this coin,. At this time the price is able to maintain this Support Block. 20%+ gains in the short term are more likely from here.
