SEI/USDT at a Critical Level Golden Pocket Reaction Will Define?🔍 Technical Analysis:
1. Market Structure:
SEI/USDT is in a recovery phase after a significant downtrend.
Price is currently testing a crucial area between the Fibonacci retracement levels of 0.5 (0.2778) and 0.618 (0.2515) — known as the Golden Pocket Zone.
2. Key Support & Resistance Levels:
Strong support lies within the highlighted yellow zone (0.2515 – 0.2778), a historical support-resistance flip level.
Key resistance levels to watch:
🔸 0.3521
🔸 0.4715
🔸 0.5936
🔸 0.7025
🔸 0.9407
🔸 1.1361
---
📈 Bullish Scenario:
If price holds above the golden pocket:
A strong rebound is likely, forming a higher low structure.
Bullish confirmation occurs if price breaks and closes above 0.3521 with strong volume.
Upside targets: 0.4715 → 0.5936 → 0.7025 in sequence.
🔹 Additional Confirmation: Bullish reversal patterns (e.g., bullish engulfing or pinbar) around 0.25–0.28 would strengthen the bullish outlook.
---
📉 Bearish Scenario:
If the price breaks below the 0.2515 level:
It could trigger a deeper move toward 0.22 – 0.18 support area.
Further breakdown may bring price below the psychological level of 0.15.
🔻 Bearish confirmation if the price gets rejected from the 0.30–0.35 region with strong bearish candles.
---
📊 Pattern Insight:
Potential Double Bottom formation near the golden pocket zone.
A break above the 0.3521 neckline would validate this bullish reversal pattern.
---
🔖 Conclusion:
This zone (0.25–0.28) is a make-or-break area for SEI. A strong reaction from this golden pocket will determine whether SEI is ready to rally further or fall to new lows.
#SEI #SEIUSDT #CryptoAnalysis #AltcoinUpdate #TechnicalAnalysis #Fibonacci #SupportResistance #GoldenPocket #CryptoTrading #SEIpriceprediction
Seiusdtbuy

#SEI/USDT The best future belongs to this coin.#SEI
The price is moving within an ascending channel on the 1-hour frame, adhering well to it, and is on track to break it strongly upwards and retest it.
We have support from the lower boundary of the ascending channel, at 0.2967.
We have a downtrend on the RSI indicator that is about to break and retest, supporting the upside.
There is a major support area in green at 0.2950, which represents a strong basis for the upside.
Don't forget a simple thing: ease and capital.
When you reach the first target, save some money and then change your stop-loss order to an entry order.
For inquiries, please leave a comment.
We have a trend to hold above the 100 Moving Average.
Entry price: 0.3080.
First target: 0.3221.
Second target: 0.3343.
Third target: 0.3522.
Don't forget a simple thing: ease and capital.
When you reach your first target, save some money and then change your stop-loss order to an entry order.
For inquiries, please leave a comment.
Thank you.

#SEI/USDT Ready to Fly? Breakout #SEI
The price is moving within a descending channel on the 1-hour frame, adhering well to it, and is on its way to breaking it strongly upwards and retesting it.
We have a bounce from the lower boundary of the descending channel. This support is at 0.3140.
We have a downtrend on the RSI indicator that is about to be broken and retested, supporting the upside.
There is a major support area (in green) at 0.3050, which represents a strong basis for the upside.
Don't forget a simple thing: ease and capital.
When you reach the first target, save some money and then change your stop-loss order to an entry order.
For inquiries, please leave a comment.
We have a trend to hold above the 100 Moving Average.
Entry price: 0.3246
First target: 0.3381
Second target: 0.3521
Third target: 0.3673
Don't forget a simple thing: ease and capital.
When you reach the first target, save some money and then change your stop-loss order to an entry order.
For inquiries, please leave a comment.
Thank you.

SEI/USDT Ready to Fly? Breakout from Accumulation Zone Signals🧠 Market Overview:
SEI/USDT has just delivered a powerful technical signal — a clean breakout from a major accumulation zone that has been holding price action for several months. With increasing volume and bullish price structure, this breakout could mark the beginning of a sustained upward trend.
The $0.24–$0.27 zone acted as a strong accumulation base. Now flipped into support, this area could serve as the launchpad for the next leg higher if price continues to hold above it.
📌 Pattern Breakdown:
🔸 Pattern: Accumulation Base Breakout
SEI traded sideways for nearly 6 months within a tight consolidation range.
This behavior is typical of institutional accumulation (smart money phase).
A strong bullish breakout above $0.27 has occurred.
Price has successfully retested the breakout level, confirming it as new support.
📈 Bullish Scenario (Primary Bias):
As long as SEI holds above the breakout zone ($0.26–$0.27), bullish continuation is likely.
🎯 Upside Targets:
$0.3521 → Minor resistance and key breakout validation.
$0.4715 → First major historical resistance.
$0.5900 → Strong price memory zone.
$0.5936 – $0.7025 → Key supply zone from previous market cycle.
$0.9407 up to $1.1450 → Long-term extension targets if bullish trend accelerates.
💡 Potential ROI from support to top target: Over 300%
📉 Bearish Scenario (Alternative View):
If price falls back below the breakout zone:
It could signal a false breakout (bull trap).
Price may re-enter the previous range and lose bullish momentum.
Downside levels to watch:
$0.21 (mid-range)
$0.17 (range low)
Failed breakout retest = bearish warning for long positions.
⚖️ Validation & Risk Strategy:
Breakout occurred with strong bullish volume → confirmation signal.
Ideal stop-loss: just below $0.25 to protect against invalidation.
Strategy: Buy on successful retest → Add if price breaks and holds above $0.35.
🧠 Pro Tip for Traders:
This setup is ideal for swing traders and mid-term investors.
The current breakout pattern is consistent with the Markup Phase in the Wyckoff Cycle.
Monitor market sentiment and volume to validate trend continuation.
If Bitcoin remains stable or bullish, altcoins like SEI may strongly outperform.
#SEI #SEIUSDT #BreakoutTrade #CryptoSignals #AltcoinAnalysis #ChartPattern #VolumeBreakout #TechnicalAnalysis #PriceAction #CryptoTraders

#SEI/USDT#SEI
The price is moving within a descending channel on the 1-hour frame, adhering well to it, and is heading for a strong breakout and retest.
We have a bounce from the lower boundary of the descending channel. This support is at 0.2745.
We have a downtrend on the RSI indicator that is about to be broken and retested, supporting the upside.
There is a major support area (in green) at 0.2710, which represents a strong basis for the upside.
Don't forget a simple thing: ease and capital.
When you reach the first target, save some money and then change your stop-loss order to an entry order.
For inquiries, please leave a comment.
We have a trend to hold above the 100 Moving Average.
Entry price: 0.2813
First target: 0.2887
Second target: 0.2983
Third target: 0.3112
Don't forget a simple thing: ease and capital.
When you reach the first target, save some money and then change your stop-loss order to an entry order.
For inquiries, please leave a comment.
Thank you.

#SEI/USDT#SEI
The price is moving within a descending channel on the 1-hour frame, adhering well to it, and is on its way to breaking it strongly upwards and retesting it.
We have a bounce from the lower boundary of the descending channel. This support is at 0.2470.
We have a downtrend on the RSI indicator that is about to be broken and retested, supporting the upside.
There is a major support area in green at 0.2440, which represents a strong basis for the upside.
Don't forget a simple thing: ease and capital.
When you reach the first target, save some money and then change your stop-loss order to an entry order.
For inquiries, please leave a comment.
We have a trend to hold above the 100 Moving Average.
Entry price: 0.2494
First target: 0.2545
Second target: 0.2600
Third target: 0.2690
Don't forget a simple thing: ease and capital.
When you reach the first target, save some money and then change your stop-loss order to an entry order.
For inquiries, please leave a comment.
Thank you.

SEI/USDT Poised for a Major Breakout – Will It Surge Toward $0.7📊 Full Technical Analysis:
The SEI/USDT daily chart reveals a compelling setup with strong breakout potential. Here's a detailed breakdown:
🔍 Pattern & Key Structure:
Descending Trendline Breakout: SEI has successfully broken out of a long-term descending trendline that has suppressed price action since December 2024 — a strong early signal of a bullish reversal.
Bullish Retest in Progress: The price is currently retesting the breakout area, aligning with a historical demand zone and Fibonacci retracement levels of 0.5 ($0.2468) and 0.618 ($0.2259).
Previous Consolidation Zone: SEI previously moved sideways within a yellow box between $0.18 – $0.25. The breakout from this zone adds bullish confirmation.
🟢 Bullish Scenario:
If SEI holds above the key demand zone ($0.2259 – $0.2468), a strong rally could follow, targeting these Fibonacci resistance levels:
🔸 $0.3068
🔸 $0.3367
🔸 $0.4696
🔸 $0.5438
🔸 $0.6086
🔸 $0.6500
🔸 Final target: $0.7013 (major resistance)
This scenario is validated by a higher low formation and a continuation of the current uptrend, especially if backed by strong volume.
🔴 Bearish Scenario:
If the price breaks below the demand zone ($0.2259 – $0.2468), further downside may be expected, with potential support levels at:
🔻 0.786 Fibonacci at $0.1961
🔻 Historical support zones at $0.18 and $0.13
A bearish breakdown would invalidate the bullish structure and suggest sellers remain in control.
📐 Pattern Summary:
Pattern Type: Descending Trendline Breakout + Bullish Retest
Validation: Retest aligned with Fibonacci & prior consolidation
Bias: Bullish, as long as the price holds above $0.2259
📝 Conclusion:
SEI/USDT is showing early signs of a bullish reversal after a breakout from its long-term downtrend. A continuation toward higher Fibonacci levels is likely if the price holds the key demand zone. Traders should watch for bullish confirmation signals near support before entering.
#SEI #SEIUSDT #CryptoBreakout #BullishSetup #TechnicalAnalysis #FibonacciTrading #CryptoSignals #AltcoinSeason #ChartPattern #CryptoTA

SEI The next big Move#SEI
The price is moving within a descending channel on the 1-hour frame and is expected to break and continue upward.
We have a trend to stabilize above the 100 moving average once again.
We have a downtrend on the RSI indicator that supports the upward break.
We have a support area at the lower boundary of the channel at 0.2750, acting as strong support from which the price can rebound.
We have a major support area in green that pushed the price upward at 0.2600.
Entry price: 0.2813
First target: 0.2879
Second target: 0.2970
Third target: 0.3080
To manage risk, don't forget stop loss and capital management.
When you reach the first target, save some profits and then change your stop order to an entry order.
For inquiries, please comment.
Thank you.

SEI Just Broke Out - Massive Rally Incoming?SEIUSDT Technical analysis update
SEIUSDT is testing a long-term descending trendline, which has acted as strong resistance on multiple occasions. Price has now broken above this level with strong volume, signaling a potential trend reversal. And price trading above 100 and 200 EMA, in the coming trading days, we can see a strong bullish move in SEI
NYSE:SEI

SEIUSDT 1D AnalysisSEI ~ 1D Analysis
#SEI Buy gradually after retesting this support block with a short term target of at least 15%+ from here.

SEIUSDT 1DSEI ~ 1D Analysis
#SEI Buy gradually after successfully penetrating this resistant line with a short -term target of at least 10%+.

SEIUSDT 3DSEI ~ 3D Analysis
#SEI Buy back while visiting this support with a short -term target of at least 20%+.

#SEI/USDT#SEI
The price is moving within a descending channel on the 1-hour frame and is expected to continue lower.
We have a trend to stabilize below the 100 moving average once again.
We have a downtrend on the RSI indicator, supporting the upward move with a break above it.
We have a resistance area at the upper limit of the channel at 0.1920.
Entry price: 0.1915
First target: 0.1851
Second target: 0.1813
Third target: 0.1770

#SEI/USDT#SEI
The price is moving in a descending channel on the 1-hour frame and is adhering to it well and is heading to break it upwards strongly and retest it
We have a bounce from the lower limit of the descending channel, this support is at a price of 2.36
We have a downtrend on the RSI indicator that is about to break and retest, which supports the rise
We have a trend to stabilize above the moving average 100
Entry price 0.2166
First target 0.2300
Second target 0.2400
Third target 0.2530

#SEI/USDT#SEI
The price is moving in a descending channel on the 1-hour frame and is adhering to it well and is heading to break it strongly upwards and retest it
We have a bounce from the lower limit of the descending channel, this support is at a price of 0.2138
We have a downtrend on the RSI indicator that is about to break and retest, which supports the rise
We have a trend to stabilize above the moving average 100
Entry price 0.2260
First target 0.2300
Second target 0.2350
Third target 0.2400

SEIUSDT 3DSEI ~ 3D Analysis
#SEI Buy from here if you still have a Conviction on this coin with a minimum target of 20%++.
#SEI/USDT#SEI
The price is moving in a descending channel on the 1-hour frame and is adhering to it well and is heading to break it strongly upwards and retest it
We have a bounce from the lower limit of the descending channel, this support is at a price of 0.2260
We have a downtrend on the RSI indicator that is about to be broken and retested, which supports the rise
We have a trend to stabilize above the moving average 100
Entry price 0.2362
First target 0.2555
Second target 0.2727
Third target 0.2900

SEIUSDT 4DSEI ~ 4D Analysis
#SEI If you still have a Conviction on this Coin, buy gradually from here with a minimum target of 20%++

#SEI/USDT Ready to go higher#SEI
The price is moving in a descending channel on the 30-minute frame and sticking to it well
We have a bounce from the lower limit of the descending channel, this support is at 0.3510
We have a downtrend on the RSI indicator that is about to be broken, which supports the rise
We have a trend to stabilize above the moving average 100
Entry price 0.3545
First target 0.3619
Second target 0.3702
Third target 0.3800

#SEI/USDT#SEI
The price is moving in a descending channel on the 1-hour frame and is expected to continue upwards
We have a trend to stabilize above the moving average 100 again
We have a descending trend on the RSI indicator that supports the rise by breaking it upwards
We have a support area at the lower limit of the channel at a price of 0.4500
Entry price 0.4555
First target 0.4634
Second target 0.4753
Third target 0.4890

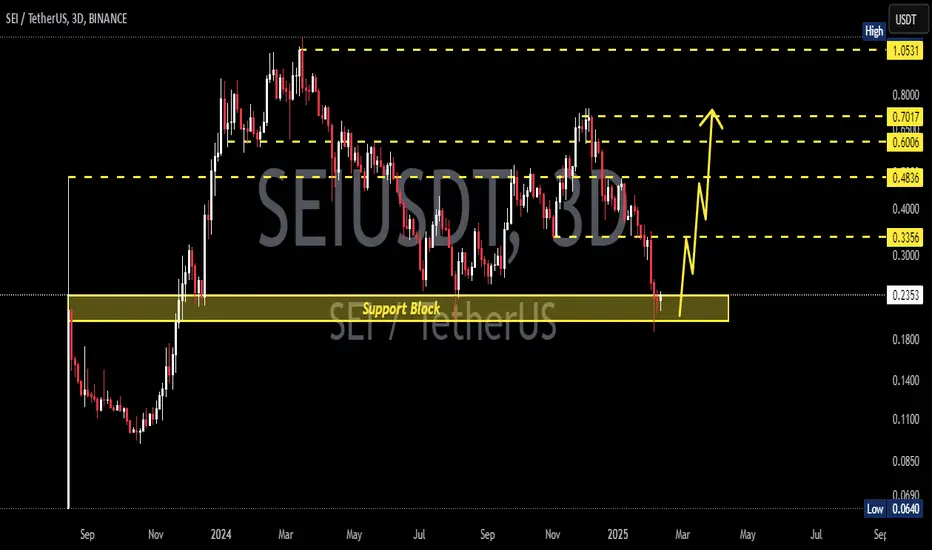
SEIUSDT 3DSEI ~ 3D
#SEI If you still have Conviction on the coin,. Buy gradually within this support block. with a short term target of at least 20%++

#SEI/USDT Ready to go higher#SEI
The price is moving in a descending channel on the 1-hour frame and sticking to it well
We have a bounce from the lower limit of the descending channel, this support is at 0.5040
We have a downtrend on the RSI indicator that is about to be broken, which supports the rise
We have a trend to stabilize above the moving average 100
Entry price 0.5100
First target 0.5277
Second target 0.5500
Third target 0.5825

#SEI/USDT#SEI
The price is moving in a descending channel on a 30-minute frame and is expected to continue upwards
We have a trend to stabilize above the moving average 100 again
We have a descending trend on the RSI indicator that supports the rise by breaking it upwards
We have a support area at the lower limit of the channel at a price of 0.6020
Entry price 0.6020
First target 0.6227
Second target 0.6470
Third target 0.6760
