#SEI/USDT#SEI
The price is moving within a descending channel on the 1-hour frame, adhering well to it, and is heading for a strong breakout and retest.
We are experiencing a rebound from the lower boundary of the descending channel, which is support at 0.1840.
We are experiencing a downtrend on the RSI indicator, which is about to break and retest, supporting the upward trend.
We are in a trend of consolidation above the 100 Moving Average.
Entry price: 0.1927
First target: 0.1999
Second target: 0.2067
Third target: 0.2162
Seiusdtperp

SEIUSDT - MEH!Hello everyone. I'm closely monitoring SEIUSDT, and I've observed significant activity in this asset: buyers have entered the market. This is a situation that demands close attention, as it carries the potential to shift the market's trajectory.
Our current focus is the blue box I've marked on the chart. This area currently presents itself as a resistance level. However, if buyers continue to strengthen and decisively break this blue box upwards, that's when a real opportunity could emerge. In such a scenario, following the breakout, I'll be looking for a retest on a low timeframe (LTF). If the price confirms this broken level as support, that will be a strong long position signal for me. This is one of those moments where the market is telling you, "I'm here."
When evaluating this scenario, I won't, of course, rely solely on price action. I'll be closely examining the volume footprint; understanding the true strength and intent of buyers is crucial. At the same time, I won't overlook CDV (Cumulative Delta Volume) divergences, as these can reveal hidden shifts in momentum. Sudden increases in volume, as always, act as a magnet for me; because, as you know, I only trade coins that are showing a sudden spike in volume. This is one of the secrets the market whispers to you.
However, as always, the market is two-sided, and we must remain flexible. If buyers fail to break this blue box and we see decisive downward breakouts on the daily timeframe, this could also present a potential scenario for a short attempt. Remember, the market can act independently of our expectations, and as a trader with one of the highest win rates, I always move according to the direction the market shows us.
We must also be vigilant against potential liquidity hunts at these levels. Price briefly pushing above the blue box and then rapidly falling back, or dipping below and then recovering, could be manipulations designed to shake out weaker hands. Failed breakouts or the regaining of lost levels will also provide us with valuable information.
Don't be surprised to see significant movements in SEIUSDT in the coming days. You might regret missing this setup, as most traders overlook these nuances at this level. Stay tuned, and let's decipher what the market is whispering together. You can trust my perspective.
📌I keep my charts clean and simple because I believe clarity leads to better decisions.
📌My approach is built on years of experience and a solid track record. I don’t claim to know it all but I’m confident in my ability to spot high-probability setups.
📌If you would like to learn how to use the heatmap, cumulative volume delta and volume footprint techniques that I use below to determine very accurate demand regions, you can send me a private message. I help anyone who wants it completely free of charge.
🔑I have a long list of my proven technique below:
🎯 ZENUSDT.P: Patience & Profitability | %230 Reaction from the Sniper Entry
🐶 DOGEUSDT.P: Next Move
🎨 RENDERUSDT.P: Opportunity of the Month
💎 ETHUSDT.P: Where to Retrace
🟢 BNBUSDT.P: Potential Surge
📊 BTC Dominance: Reaction Zone
🌊 WAVESUSDT.P: Demand Zone Potential
🟣 UNIUSDT.P: Long-Term Trade
🔵 XRPUSDT.P: Entry Zones
🔗 LINKUSDT.P: Follow The River
📈 BTCUSDT.P: Two Key Demand Zones
🟩 POLUSDT: Bullish Momentum
🌟 PENDLEUSDT.P: Where Opportunity Meets Precision
🔥 BTCUSDT.P: Liquidation of Highly Leveraged Longs
🌊 SOLUSDT.P: SOL's Dip - Your Opportunity
🐸 1000PEPEUSDT.P: Prime Bounce Zone Unlocked
🚀 ETHUSDT.P: Set to Explode - Don't Miss This Game Changer
🤖 IQUSDT: Smart Plan
⚡️ PONDUSDT: A Trade Not Taken Is Better Than a Losing One
💼 STMXUSDT: 2 Buying Areas
🐢 TURBOUSDT: Buy Zones and Buyer Presence
🌍 ICPUSDT.P: Massive Upside Potential | Check the Trade Update For Seeing Results
🟠 IDEXUSDT: Spot Buy Area | %26 Profit if You Trade with MSB
📌 USUALUSDT: Buyers Are Active + %70 Profit in Total
🌟 FORTHUSDT: Sniper Entry +%26 Reaction
🐳 QKCUSDT: Sniper Entry +%57 Reaction
📊 BTC.D: Retest of Key Area Highly Likely
📊 XNOUSDT %80 Reaction with a Simple Blue Box!
📊 BELUSDT Amazing %120 Reaction!
📊 Simple Red Box, Extraordinary Results
📊 TIAUSDT | Still No Buyers—Maintaining a Bearish Outlook
📊 OGNUSDT | One of Today’s Highest Volume Gainers – +32.44%
I stopped adding to the list because it's kinda tiring to add 5-10 charts in every move but you can check my profile and see that it goes on..
#SEI/USDT#SEI
The price is moving within a descending channel on the 1-hour frame, adhering well to it, and is heading for a strong breakout and retest.
We are seeing a bounce from the lower boundary of the descending channel, which is support at 0.2095.
We have a downtrend on the RSI indicator that is about to break and retest, supporting the upward trend.
We are looking for stability above the 100 Moving Average.
Entry price: 0.2249
First target: 0.2423
Second target: 0.2423
Third target: 0.2538

#SEI/USDT#SEI
The price is moving within a descending channel on the 1-hour frame, adhering well to it, and is on its way to breaking it strongly upwards and retesting it.
We are seeing a bounce from the lower boundary of the descending channel, which is support at 0.2170.
We have a downtrend on the RSI indicator that is about to break and retest, supporting the upward trend.
We are looking for stability above the 100 moving average.
Entry price: 0.2310
First target: 0.2372
Second target: 0.2446
Third target: 0.2563

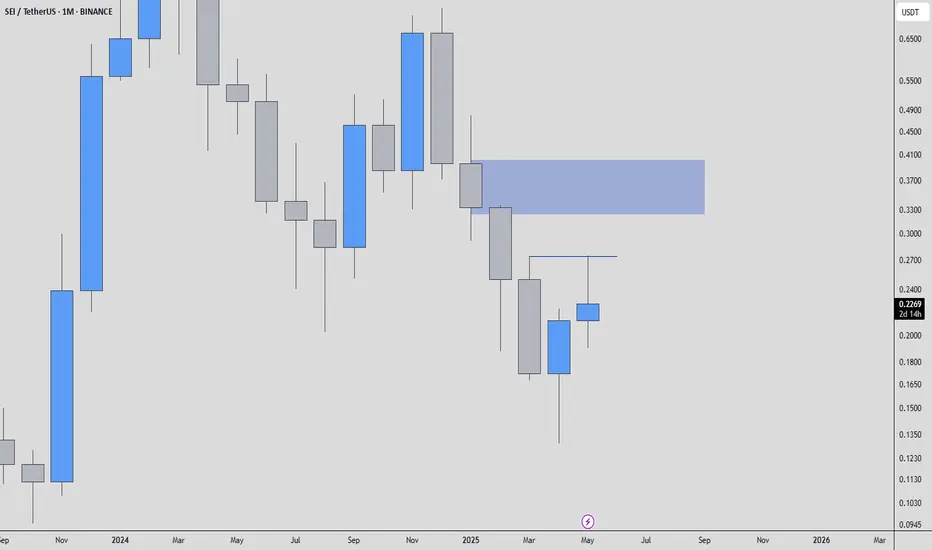
SEIUSDT 1D AnalysisSEI ~ 1D Analysis
#SEI Buy gradually after retesting this support block with a short term target of at least 15%+ from here.

#SEI/USDT#SEI
The price is moving within a descending channel on the 1-hour frame, adhering well to it, and is heading towards a strong breakout and retest.
We are seeing a bounce from the lower boundary of the descending channel, which is support at 0.2550.
We have a downtrend on the RSI indicator that is about to be broken and retested, which supports the upward trend.
We are looking for stability above the 100 Moving Average.
Entry price: 0.2579
First target: 0.2626
Second target: 0.2681
Third target: 0.2750

#SEIUSDT remains in bullish continuation mode📉 LONG BYBIT:SEIUSDT.P from $0.2747
🛡 Stop loss: $0.2640
🕒 Timeframe: 4H
✅ Market Overview:
➡️ Falling Wedge pattern has played out — confirmed breakout to the upside.
➡️ A strong Inverse Head and Shoulders pattern is visible — neckline broken with momentum.
➡️ Volume increases on upward impulse — bullish confirmation.
➡️ Current price is consolidating slightly — likely preparing for the next leg up.
➡️ POC at $0.1697 is far below — market structure flipped bullish.
➡️ Clear upward projection toward the $0.2810–$0.2910 range.
🎯 TP Targets:
💎 TP 1: $0.2810
💎 TP 2: $0.2870
💎 TP 3: $0.2910
📢 Holding above $0.2740 confirms bullish structure.
📢 Watch for minor resistance near TP1, then potential continuation to TP2 and TP3.
📢 Secure partial profits at TP1, and let the rest ride toward higher targets.
📢 It’s advisable to partially take profits near the specified resistance levels.
📢 A retest of the breakout zone (around $0.22) is possible — this can be used for adding to the position.
🚀 BYBIT:SEIUSDT.P remains in bullish continuation mode — targets still active!

#SEI/USDT#SEI
The price is moving within a descending channel on the 1-hour frame and is expected to break and continue upward.
We have a trend to stabilize above the 100 moving average once again.
We have a downtrend on the RSI indicator that supports the upward move with a breakout.
We have a support area at the lower limit of the channel at 0.2000, which acts as strong support from which the price can rebound.
Entry price: 0.2032
First target: 0.2074
Second target: 0.2119
Third target: 0.2164

#SEI/USDT#SEI
The price is moving within a descending channel on the 1-hour frame and is expected to break and continue upward.
We have a trend to stabilize above the 100 moving average once again.
We have a downtrend on the RSI indicator, which supports the upward move by breaking it upward.
We have a support area at the lower limit of the channel at 0.1880, acting as strong support from which the price can rebound.
Entry price: 0.1916
First target: 0.1954
Second target: 0.1998
Third target: 0.2052

#SEI/USDT#SEI
The price is moving within a descending channel on the 1-hour frame, adhering well to it, and is heading for a strong breakout and retest.
We are seeing a bounce from the lower boundary of the descending channel, which is support at 0.1693.
We have a downtrend on the RSI indicator that is about to be broken and retested, supporting the upward trend.
We are looking for stability above the 100 moving average.
Entry price: 0.1700
First target: 0.1724
Second target: 0.1743
Third target: 0.1766

SEI Trend Reversal? Breakout + Higher Low ConfirmedNYSE:SEI has broken above the key descending resistance line, signaling a shift in momentum after an extended downtrend. The price also rebounded strongly from the support zone marked in the chart, forming a clear higher low.
Currently, SEI is pushing through a critical zone where support previously flipped into resistance, now testing the 50 EM as the next challenge.
If the price can hold above this zone and close with strength, the next leg up could target $0.30–$0.50, as shown on the chart.
DYOR, NFA

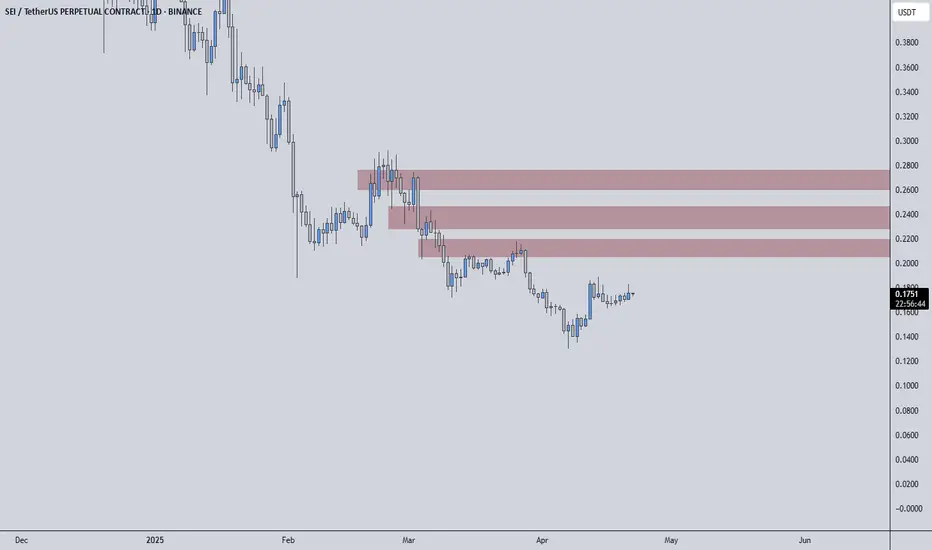
SEIUSDT | Weak Structure Persists, Eyes on Red Box ResistanceSEIUSDT continues to reflect weakness in its structure, and until proven otherwise, the red boxes remain key resistance zones. Buyers are still not stepping in with meaningful strength, and the overall market context doesn’t support a bullish shift yet.
🔴 Resistance Zones Are Still Dominant
The red boxes align with former support levels that now act as barriers. This type of flip often traps late buyers and offers great setups for short opportunities — but only with confirmation.
🔍 What to Watch For
Lower-Time-Frame Breakdown Patterns: Inside these red boxes, look for signs like bearish engulfing candles or lower highs on the 5-15 min charts.
CDV & Orderflow Weakness: If cumulative delta volume and tape show absorption or hidden selling, the likelihood of rejection increases.
Risk Management First: Use these zones not just for direction, but for well-defined invalidation points. If price pushes through and retests from above, then it's time to pivot your bias.
🚨 If Buyers Show Up…
I won’t stick to my short bias blindly. If SEIUSDT can break through the red resistance with strength, and more importantly hold above it, I will reassess and look for long setups — especially on the retest with bullish confirmations.
Markets can shift quickly, and we trade based on what the chart shows, not what we hope. For now, SEI remains under pressure. Be patient, act on signals, and never force a trade just because the price is near a key level.
📌I keep my charts clean and simple because I believe clarity leads to better decisions.
📌My approach is built on years of experience and a solid track record. I don’t claim to know it all but I’m confident in my ability to spot high-probability setups.
📌If you would like to learn how to use the heatmap, cumulative volume delta and volume footprint techniques that I use below to determine very accurate demand regions, you can send me a private message. I help anyone who wants it completely free of charge.
🔑I have a long list of my proven technique below:
🎯 ZENUSDT.P: Patience & Profitability | %230 Reaction from the Sniper Entry
🐶 DOGEUSDT.P: Next Move
🎨 RENDERUSDT.P: Opportunity of the Month
💎 ETHUSDT.P: Where to Retrace
🟢 BNBUSDT.P: Potential Surge
📊 BTC Dominance: Reaction Zone
🌊 WAVESUSDT.P: Demand Zone Potential
🟣 UNIUSDT.P: Long-Term Trade
🔵 XRPUSDT.P: Entry Zones
🔗 LINKUSDT.P: Follow The River
📈 BTCUSDT.P: Two Key Demand Zones
🟩 POLUSDT: Bullish Momentum
🌟 PENDLEUSDT.P: Where Opportunity Meets Precision
🔥 BTCUSDT.P: Liquidation of Highly Leveraged Longs
🌊 SOLUSDT.P: SOL's Dip - Your Opportunity
🐸 1000PEPEUSDT.P: Prime Bounce Zone Unlocked
🚀 ETHUSDT.P: Set to Explode - Don't Miss This Game Changer
🤖 IQUSDT: Smart Plan
⚡️ PONDUSDT: A Trade Not Taken Is Better Than a Losing One
💼 STMXUSDT: 2 Buying Areas
🐢 TURBOUSDT: Buy Zones and Buyer Presence
🌍 ICPUSDT.P: Massive Upside Potential | Check the Trade Update For Seeing Results
🟠 IDEXUSDT: Spot Buy Area | %26 Profit if You Trade with MSB
📌 USUALUSDT: Buyers Are Active + %70 Profit in Total
🌟 FORTHUSDT: Sniper Entry +%26 Reaction
🐳 QKCUSDT: Sniper Entry +%57 Reaction
📊 BTC.D: Retest of Key Area Highly Likely
📊 XNOUSDT %80 Reaction with a Simple Blue Box!
📊 BELUSDT Amazing %120 Reaction!
I stopped adding to the list because it's kinda tiring to add 5-10 charts in every move but you can check my profile and see that it goes on..
#SEI/USDT#SEI
The price is moving within a descending channel on the 1-hour frame, adhering well to it, and is heading for a strong breakout and retest.
We are seeing a bounce from the lower boundary of the descending channel, which is support at 0.1754.
We have a downtrend on the RSI indicator that is about to be broken and retested, supporting the upward trend.
We are looking for stability above the 100 moving average.
Entry price: 0.1823
First target: 0.1847
Second target: 0.1884
Third target: 0.1942

#SEI/USDT#SEI
The price is moving within a descending channel on the 1-hour frame, adhering well to it, and is heading for a strong breakout and retest.
We are experiencing a rebound from the lower boundary of the descending channel, which is support at 0.1600.
We are experiencing a downtrend on the RSI indicator, which is about to break and retest, supporting the upward trend.
We are looking for stability above the 100 Moving Average.
Entry price: 0.1614
First target: 0.1625
Second target: 0.1642
Third target: 0.1665

#SEI/USDT#SEI
The price is moving within a descending channel on the 1-hour frame and is expected to continue upward.
We have a trend to stabilize above the 100 moving average once again.
We have a downtrend on the RSI indicator that supports the upward move with a breakout.
We have a support area at the lower boundary of the channel at 0.1700.
Entry price: 0.1730
First target: 0.1764
Second target: 0.1808
Third target: 0.1850

SEIUSDT 1DSEI ~ 1D Analysis
#SEI Buy gradually after successfully penetrating this resistant line with a short -term target of at least 10%+.

SEIUSDT 3DSEI ~ 3D Analysis
#SEI Buy back while visiting this support with a short -term target of at least 20%+.

#SEI/USDT#SEI
The price is moving within a descending channel on the 1-hour frame and is expected to continue lower.
We have a trend to stabilize below the 100 moving average once again.
We have a downtrend on the RSI indicator, supporting the upward move with a break above it.
We have a resistance area at the upper limit of the channel at 0.1920.
Entry price: 0.1915
First target: 0.1851
Second target: 0.1813
Third target: 0.1770

#SEI/USDT#SEI
The price is moving within a descending channel on the 1-hour frame, adhering well to it, and is heading for a strong breakout and retest.
We are seeing a bounce from the lower boundary of the descending channel, which is support at 0.1880.
We have a downtrend on the RSI indicator that is about to be broken and retested, supporting the upward trend.
We are looking for stability above the 100 Moving Average.
Entry price: 0.1944
First target: 0.1979
Second target: 0.2017
Third target: 0.2059

SEI/USDT BUYHello friends
Given the price reaching resistance and price correction, there is a good opportunity to buy...
Here we suggest you buy step.
We have also specified price targets for you.
*Trade safely with us*

SEI/USDT hello friends
Considering the fall of this currency, it has now made a good bottom in the support range and we expect the price to move up to the specified targets.
*Trade safely with us*

#SEI/USDT#SEI
The price is moving in a descending channel on the 1-hour frame and is adhering to it well and is heading to break it upwards strongly and retest it
We have a bounce from the lower limit of the descending channel, this support is at a price of 2.36
We have a downtrend on the RSI indicator that is about to break and retest, which supports the rise
We have a trend to stabilize above the moving average 100
Entry price 0.2166
First target 0.2300
Second target 0.2400
Third target 0.2530

#SEIUSDT maintains bullish momentum📈 LONG BYBIT:SEIUSDT.P from $0.2922
🛡 Stop Loss: $0.2867
⏱ 1H Timeframe
✅ Overview:
➡️ BYBIT:SEIUSDT.P is in an uptrend after consolidating in the support zone, confirming buyer dominance.
➡️ Volume Profile indicates that the main liquidity ( POC ) is positioned at $0.274, confirming volume redistribution towards buying.
➡️ A breakout above $0.2922 and consolidation will trigger further upside movement.
➡️ The nearest targets are in the $0.2980 – $0.3030 range, where profit-taking may occur.
⚡ Plan:
➡️ Long entry upon breaking $0.2922, confirming bullish momentum.
➡️ Stop-Loss at $0.2867—placed below the nearest liquidity zone to minimize risk.
➡️ Main targets: $0.2980 and $0.3030, where partial profit-taking may be considered.
🎯 TP Targets:
💎 TP 1: $0.2980
🔥 TP 2: $0.3030
🚀 BYBIT:SEIUSDT.P maintains bullish momentum — expecting further upside!
📢 BYBIT:SEIUSDT.P is forming a bullish trend, and consolidation above $0.2922 may accelerate the uptrend.
📢 Monitor price reactions around $0.3030, as this could act as a resistance zone for potential corrections.
