Dow Jones Potential DownsidesHey Traders, in today's trading session we are monitoring US30 for a selling opportunity around 44,300 zone, Dow Jones is trading in a downtrend and currently is in a correction phase in which it is approaching the trend at 44,300 support and resistance area.
Trade safe, Joe.
SELL

Gold Set to Reach Historic HighsHello everyone, great to see you again!
Gold has been on a strong upward trajectory, breaking previous bearish structures and showing solid growth momentum. Market sentiment is heavily supported by the weakening of global currencies, particularly the US dollar, and expectations surrounding the potential interest rate cuts by the Federal Reserve.
Looking at the technical picture, we are approaching the historic peak of $3,433. The gold market is showing significant strength, confirmed by EMA 34 and EMA 89, as well as new support zones, signaling a trend reversal and confirming the bullish outlook.
The next few trading sessions could play a critical role in confirming whether the precious metal can break the all-time highs.
What do you think? Is gold about to make history? Let me know in the comments below!

GBP/USD: Sell setup shaping upHey everyone, what’s your take on GBP/USD right now?
After breaking below the trendline, GBP/USD tried to retest the area but failed to hold. Price is now hovering around 1.329, and the selling pressure is still clearly present.
This current setup is aiming toward the Fibonacci 1.618 extension zone around 1.287. In the short term, a pullback could play out based on Dow Theory, and the highlighted zone might offer a prime shorting opportunity.
My bias: SELL on the retest — with tight risk management, clear TP and SL in place.
Now it’s your turn — what’s your outlook? Drop your thoughts in the comments below.
Good luck and trade smart! 💼📉

EURUSD – Which Way Will It Break?Hello everyone, what are your thoughts on the EURUSD trend?
EURUSD is currently experiencing a Bollinger Bands squeeze, signaling a potential breakout in either direction. The price is trading near the lower limit, hovering around 1.157 , with two potential scenarios unfolding:
Bullish scenario: The price could break upward toward 1.172, testing the upper resistance zone.
Bearish scenario: If the price falls below the lower limit, it could head towards the sell target at 1.140.
💬 For me, I’m leaning toward FOMO (Fear of Missing Out) and following the sell trend with a target of 1.140. What about you? Let me know your thoughts in the comments below!

Gold Surges on Weak NFP Hello everyone, what’s your take on XAUUSD?
Gold prices soared at the end of the last session and are now trading around $3,380. This sharp rise followed a weaker-than-expected U.S. Non-Farm Payrolls (NFP) report, which shifted market sentiment toward expectations that the Fed may delay interest rate cuts. As a result, the U.S. dollar weakened and demand for gold as a safe haven surged.
Technically, gold appears to be forming a cup and handle pattern, with the first resistance target at $3,400, followed by $3,435.
What do you think? Could this rally continue? Let us know in the comments!

GBPUSD – Trendline Broken, More Downside Ahead?Hello traders! What’s your take on GBPUSD?
The GBP/USD pair has broken below its long-term ascending trendline and is now trading beneath a key resistance zone. After a failed breakout at the newly formed trendline, price quickly reversed and dropped sharply.
This resistance zone previously acted as a strong support level but has now been flipped to resistance. If price fails to reclaim this area during the next pullback, the bearish outlook will be further confirmed.
💬 Do you think GBPUSD will bounce from the 1.32 region, or will it continue falling toward the lower targets? Share your thoughts below!

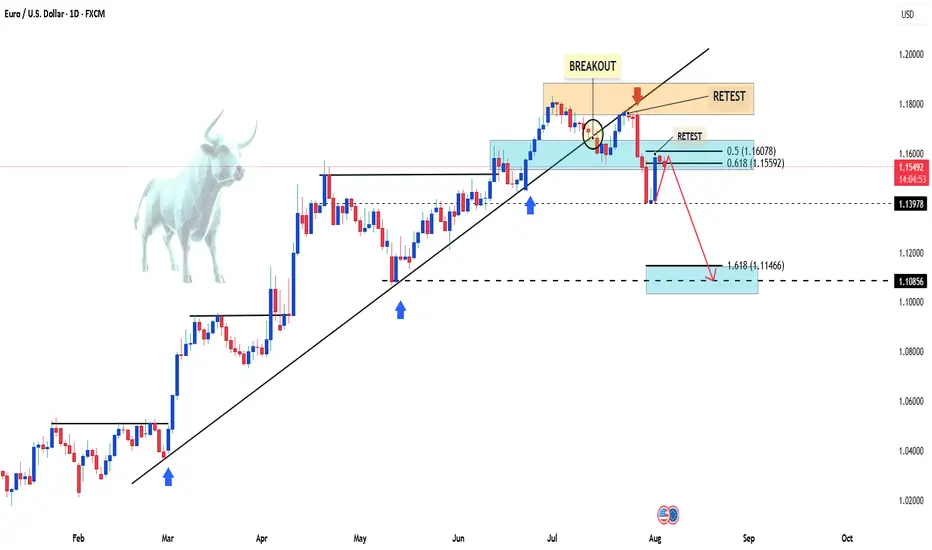
EURUSD Faces Renewed Selling PressureHello, what are your thoughts on EURUSD?
After failing to break above the 1.1600 level, the EUR/USD pair is now facing strong selling pressure again, currently testing the mid-1.1500s on Monday. Meanwhile, the US Dollar has seen a modest rebound across the board as investors digest Friday’s sharp drop following weaker-than-expected US jobs data.
From a technical standpoint, this setup may lead EURUSD to even lower levels. The recent movement aligns well with our previous outlook and follows the Dow Theory principles.
I'm expecting the price to continue its correction—what about you?
BTC recovery within the downtrend – watch for sell signalsHello friends,
Today, BTCUSD is showing a slight bearish bias, currently hovering around $115,000.
On the macro front, global financial markets are still digesting expectations that the Fed could cut interest rates in September, with current odds close to 90%, according to the CME FedWatch Tool. The main driver? Last week’s disappointing Non-Farm Payroll (NFP) report, which slightly weakened the US dollar and gave Bitcoin some short-term relief.
However, BTC is still not out of the woods. Institutional investors remain cautious, awaiting clearer signals from the Fed. If the US stock market pulls back, Bitcoin could follow suit as part of a short-term profit-taking wave.
From a technical point of view, BTCUSD is still respecting a well-defined descending channel on the H4 timeframe. Price is approaching a strong confluence resistance zone around $115,800 (Entry Sell 1), aligned with both EMA and trendline. The next key level to watch is $118,000 (Entry Sell 2) – a zone that may trigger a false breakout before sellers step back in.
Looking ahead, the plan is to sell if the price shows rejection signs near 115,800 or 118,000. Place your SL just above resistance, and TP targets at 112,000, with an extended target near the $110,000 channel bottom.
So, what’s your take – will BTC break the downtrend channel or drop further?
Drop your thoughts in the comments below!

Gold Continues to Rise, Breaking ResistanceWeak US jobs data has increased expectations that the Fed will cut interest rates, weakening the USD and bond yields, making gold an attractive safe-haven asset. Gold has reached 3,371 USD, with US gold futures at 3,425 USD. Gold is currently facing resistance at 3,450 USD, and if broken, it could continue towards 3,500 USD.
The XAUUSD chart is moving within a clear uptrend channel with higher highs and higher lows. Gold has surpassed key support levels, including the Fair Value Gap (FVG), indicating strong buying momentum. The market is now testing the 3,450 USD resistance. If broken, the next target will be 3,500 USD.
Strategy:
Buy: If price breaks above 3,450 USD, aim for 3,500 USD.
Stop Loss: Place below 3,320 USD to manage risk.

USDJPY Bullish Momentum Continues ? Hello traders, what do you think about USDJPY?
As of now, USDJPY is showing a slight upward movement after the recent correction. The price is trading around 147.59, not changing much since the beginning of the session.
The Japanese yen remains under pressure due to Japan’s slow recovery and ongoing economic challenges, giving USD an edge to capitalize on recent gains.
From a technical standpoint, USDJPY is moving in an ascending wedge pattern. After testing the trendline support near 147, the pair could be headed toward the psychological target of 150, or even higher towards the upper trendline boundary in the coming days.
Keep an eye on the price action near key resistance levels as the market continues to evaluate global economic factors, especially the upcoming US jobs data and Fed policy outlook.
What’s your take on USDJPY? Do you expect this pair to rise further? Let me know in the comments below!

Gold's Bullish Momentum: Heading Towards Historic Highs?Hey everyone, it's Alex here!
Yesterday, XAUUSD continued its upward trend and is now trading around 3.375 USD.
The price increase of gold is mainly driven by the bargain-hunting sentiment from speculators. After a slight drop in gold prices in the morning, buy orders were quickly triggered, taking advantage of the lower prices. Coupled with the weakening USD, this opened the door for a strong buying pressure on gold.
From a technical perspective, the current trend shows the beginning of a new bullish wave within a clearly defined uptrend channel. Notably, the EMA 34 and EMA 89 are converging closely, along with the breakout of previous resistance, which further increases the likelihood of the ongoing bullish momentum.
Regarding the outlook, I prefer buying in line with the prevailing trend. As long as the price holds above the newly established support (confirmed by previous resistance), the next target will be the upper boundary of the price channel, around 3,435 USD.
This is a key level that will determine whether the upward trend continues or if the market will experience a correction. It all depends on how the market reacts at that moment.
What do you think about the current gold trend? Feel free to share your thoughts in the comments!

USDJPY Will Fall! Sell!
Take a look at our analysis for USDJPY.
Time Frame: 12h
Current Trend: Bearish
Sentiment: Overbought (based on 7-period RSI)
Forecast: Bearish
The price is testing a key resistance 147.518.
Taking into consideration the current market trend & overbought RSI, chances will be high to see a bearish movement to the downside at least to 144.599 level.
P.S
The term oversold refers to a condition where an asset has traded lower in price and has the potential for a price bounce.
Overbought refers to market scenarios where the instrument is traded considerably higher than its fair value. Overvaluation is caused by market sentiments when there is positive news.
Disclosure: I am part of Trade Nation's Influencer program and receive a monthly fee for using their TradingView charts in my analysis.
Like and subscribe and comment my ideas if you enjoy them!

Gold Setting the Trap: Fake Rally Before the Fall?Gold (GC) Futures are showing signs of a potential reversal after a surprise bullish NY session, likely sparked by headline sentiment (Trump-related news). While the impulse looked strong, we remain below the previous daily high, and structure may still favor a deeper move south.
🔍 Key Notes:
Price is stalling near a high-volume node (~3436–3445).
Possible liquidity sweep above NY highs before reversal.
Watching for confirmation during Asian or London killzone.
Bearish continuation becomes more likely if we break below NY session lows and hold.
Bias: Bearish, targeting rebalancing of the H4 FVG if structure confirms.
Sharing this to track how the algo reacts inside upcoming killzones. Open to thoughts, breakdowns, and alternate reads 👇

USDCAD Will Go Down From Resistance! Short!
Please, check our technical outlook for USDCAD.
Time Frame: 1D
Current Trend: Bearish
Sentiment: Overbought (based on 7-period RSI)
Forecast: Bearish
The market is trading around a solid horizontal structure 1.375.
The above observations make me that the market will inevitably achieve 1.362 level.
P.S
We determine oversold/overbought condition with RSI indicator.
When it drops below 30 - the market is considered to be oversold.
When it bounces above 70 - the market is considered to be overbought.
Disclosure: I am part of Trade Nation's Influencer program and receive a monthly fee for using their TradingView charts in my analysis.
Like and subscribe and comment my ideas if you enjoy them!

CHF/JPY SELLERS WILL DOMINATE THE MARKET|SHORT
Hello, Friends!
We are going short on the CHF/JPY with the target of 181.383 level, because the pair is overbought and will soon hit the resistance line above. We deduced the overbought condition from the price being near to the upper BB band. However, we should use low risk here because the 1W TF is green and gives us a counter-signal.
Disclosure: I am part of Trade Nation's Influencer program and receive a monthly fee for using their TradingView charts in my analysis.
✅LIKE AND COMMENT MY IDEAS✅

RIVN Rivian Automotive Options Ahead of EarningsIf you haven`t bought RIVN before the previous earnings:
Now analyzing the options chain and the chart patterns of RIVN Rivian Automotive prior to the earnings report this week,
I would consider purchasing the 10usd strike price Puts with
an expiration date of 2025-10-17,
for a premium of approximately $0.39.
If these options prove to be profitable prior to the earnings release, I would sell at least half of them.
Disclosure: I am part of Trade Nation's Influencer program and receive a monthly fee for using their TradingView charts in my analysis.

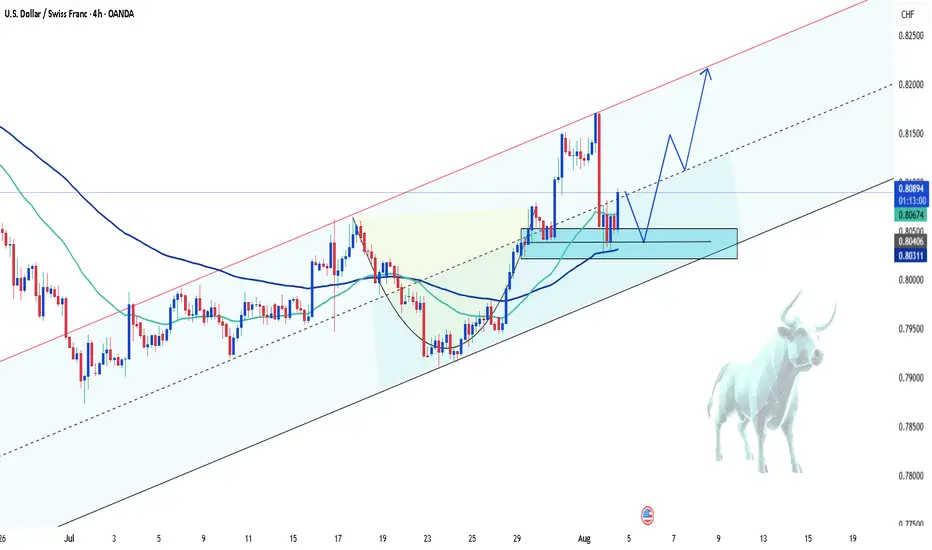
USDCHF – Bullish comeback in progress?Hey everyone! What’s your take on the current trend of USDCHF?
While the pair experienced a recent dip, take a step back and look at the bigger picture — doesn’t it still seem to be moving within an ascending channel?
Right now, USDCHF is hovering around 0.8092 and starting to bounce back. The recovery appears to be supported by a newly formed support zone and the confluence of the EMA 34 and 89. The pair seems to be eyeing the recent high, with potential to climb further toward the upper boundary of the channel.
My current bias? Bullish.
What about you — do you see the same opportunity?
Drop a comment and hit like if you’re on the same page!
Gold’s heating up – Riding the wave or waiting for the dip?Hey everyone! So, what’s your take on XAUUSD right now?
Gold’s been on a tear lately – yesterday it kept pushing higher and is now chilling around $3,376.
The move’s mostly driven by hopes that the Fed might ease up soon, especially with recent U.S. data showing signs of slowing down.
From a chart perspective, it’s looking like we might be at the beginning of a fresh bullish wave. There’s a nice bullish confluence happening at the EMA 34 and 89, plus we’ve broken above previous resistance – both giving that upward momentum some real backing.
If price pulls back before another push, I’m keeping my eyes on the Fibo 0.5–0.618 zone. That area also lines up with the EMAs and old resistance, so it could be a sweet spot for a buy setup if things line up right.
Personally, I’m leaning bullish today.

XAUUSD breaks out – bullish bias returnsGold has bounced from the bottom of the descending channel, initiating a clear upward move with a series of strong bullish candles. On the H2 chart, price has broken above the upper boundary of the medium-term downtrend channel and filled the nearest fair value gap, signaling a resurgence in buying pressure.
Current price action is approaching a previous resistance zone, aligned with recent swing highs. The chart suggests a potential consolidation before further upside, provided that the current bullish structure remains intact.
From a macro perspective, while the stronger-than-expected U.S. PMI data supports the USD in the short term, weak labor market figures and ongoing global geopolitical tensions continue to fuel demand for gold as a safe-haven asset. This environment is helping sustain XAUUSD’s current recovery structure.

EURUSD Will Move Lower! Sell!
Please, check our technical outlook for EURUSD.
Time Frame: 9h
Current Trend: Bearish
Sentiment: Overbought (based on 7-period RSI)
Forecast: Bearish
The market is approaching a significant resistance area 1.156.
Due to the fact that we see a positive bearish reaction from the underlined area, I strongly believe that sellers will manage to push the price all the way down to 1.140 level.
P.S
The term oversold refers to a condition where an asset has traded lower in price and has the potential for a price bounce.
Overbought refers to market scenarios where the instrument is traded considerably higher than its fair value. Overvaluation is caused by market sentiments when there is positive news.
Disclosure: I am part of Trade Nation's Influencer program and receive a monthly fee for using their TradingView charts in my analysis.
Like and subscribe and comment my ideas if you enjoy them!

USDCHF Is Very Bearish! Short!
Take a look at our analysis for USDCHF.
Time Frame: 1h
Current Trend: Bearish
Sentiment: Overbought (based on 7-period RSI)
Forecast: Bearish
The price is testing a key resistance 0.808.
Taking into consideration the current market trend & overbought RSI, chances will be high to see a bearish movement to the downside at least to 0.804 level.
P.S
Overbought describes a period of time where there has been a significant and consistent upward move in price over a period of time without much pullback.
Disclosure: I am part of Trade Nation's Influencer program and receive a monthly fee for using their TradingView charts in my analysis.
Like and subscribe and comment my ideas if you enjoy them!

EURUSD – Bearish pullback in play ? EURUSD has broken the ascending trendline and dropped below the EMA confluence, confirming a bearish structure. The current rebound is testing the 0.5–0.618 Fibonacci zone, but weak buying pressure and rejection candles suggest it’s likely just a technical pullback.
If momentum holds, the pair may resume its downtrend toward 1.1400 and potentially 1.1296. The bears remain in control unless strong fundamentals shift the balance.

Gold Trading Strategy XAUUSD August 6, 2025Gold Trading Strategy XAUUSD August 6, 2025:
Spot gold edged lower in Asian trading yesterday (August 5), currently trading around $3,380/ounce. On Tuesday, the US ISM Services PMI came in at 50.1, below the forecast of 1.4 and below the previous month's reading of 0.7; the news sent gold prices soaring in the US session.
Fundamentals: Gold prices surged after weak jobs data increased the likelihood of a rate cut by the Federal Reserve. Data released last Friday showed that the number of new jobs in the US non-farm sector was much lower than expected, indicating a sharp deterioration in the labor market. The probability of the Fed cutting interest rates in September increased to 87%, up from 63% last week.
Technical analysis: Gold price is still in the uptrend channel in the H1 frame, the 3365 - 3370 area is supporting the gold price to continue following the price channel. If the gold price continues to fluctuate according to the price channel, the next prospective area could be 3400 - 3405 or even 3420 - 3425. However, the RSI and MA lines have shown signs that the buyers are weakening, so the gold price is very likely to have a strong correction from today until the end of the week.
Important price zones today: 3365 - 3370, 3400 - 3405 and 3420 - 3425.
Today's trading trend: SELL.
Recommended order:
Plan 1: SELL XAUUSD zone 3403 - 3405
SL 3408
TP 3400 - 3390 - 3380 - 3350 - OPEN.
Plan 2: SELL XAUUSD zone 3423 - 3425
SL 3428
TP 3420 - 3420 - 3400 - 3380 - OPEN.
Plan 3: BUY XAUUSD zone 3365 - 3367
SL 3362
TP 3370 - 3380 - 3390 - 3400.
Wish you a safe, successful and profitable trading day.🥰🥰🥰🥰🥰
