Decred DCR Bearish SentimentSeptember has major catalysts for the crypto market as well as for the stock market.
The Ethereum merge on September 6th, that will end on Sept 20, the inflation report on September 13 and the next FOMC meeting afterwards with the new interest rates hike.
That is reflected in the crypto space in general as a bearish outlook.
Decred DCR has a negative overall sentiment recently.
I have the following price targets:
DCR/USDT short
Entry Range: $29 - 31
Price Target 1: $24
Price Target 2: $19
Price Target 3: $18
Stop Loss: $35
Sell-signal

Ardor ARDR Bearish SentimentSeptember has major catalysts for the crypto market as well as for the stock market.
The Ethereum merge on September 6th, that will end on Sept 20, the inflation report on September 13 and the next FOMC meeting afterwards with the new interest rates hike.
That is reflected in the crypto space in general as a bearish outlook.
Ardor ARDR has a negative overall sentiment recently.
I have the following price targets:
ARDR/USDT short
Entry Range: $0.095 - 0.110
Take Profit 1: $0.090
Take Profit 2: $0.0805
Take Profit 3: $0.072
Stop Loss: $0.119

Enjin Coin ENJ bearish sentimentSeptember has major catalysts for the crypto market as well as for the stock market.
The Ethereum merge on September 6th, that will end on Sept 20, the inflation report on September 13 and the next FOMC meeting afterwards with the new interest rates hike.
That is reflected in the crypto space in general as a bearish outlook.
Enjin Coin ENJ has a negative overall sentiment recently.
I have the following price targets:
ENJ/USDT short
Entry Range: $0.49 - 0.56
Take Profit 1: $0.45
Take Profit 2: $0.38
Take Profit 3: $0.29
Stop Loss: $0.63

Polygon MATIC bearish sentimentSeptember has major catalysts for the crypto market as well as for the stock market.
The Ethereum merge on September 6th, that will end on Sept 20, the inflation report on September 13 and the next FOMC meeting afterwards with the new interest rates hike.
That is reflected in the crypto space in general as a bearish outlook.
Polygon MATIC has a negative overall sentiment recently.
I have the following price targets:
MATIC/USDT short
Entry Range: $0.84 - 0.90
Take Profit 1: $0.76
Take Profit 2: $0.72
Take Profit 3: $0.61
Stop Loss: $0.99

Kyber Network Crystal v2 KNC bearish sentimentSeptember has major catalysts for the crypto market as well as for the stock market.
The Ethereum merge on September 6th, that will end on Sept 20, the inflation report on September 13 and the next FOMC meeting afterwards with the new interest rates hike.
That is reflected in the crypto space in general as a bearish outlook.
Kyber Network Crystal v2 KNC has a negative overall sentiment recently.
I have the following price targets:
KNC/USDT short
Entry Range: $1.63 - 1.99
Price Target 1: $1.45
Price Target 2: $1.30
Price Target 3: $1.17
Stop Loss: $2.21

Chainlink LINK bearish sentimentSeptember has major catalysts for the crypto market as well as for the stock market.
The Ethereum merge on September 6th, that will end on Sept 20, the inflation report on September 13 and the next FOMC meeting afterwards with the new interest rates hike.
That is reflected in the crypto space in general as a bearish outlook.
Chainlink LINK has a negative overall sentiment recently.
I have the following price targets:
LINK/USDT short
Entry Range: $6.50 - 7.10
Take Profit 1: $5.10
Take Profit 2: $4.50
Take Profit 3: $3.90
Stop Loss: $8.10

ATOM bearish sentimentSeptember has major catalysts for the crypto market as well as for the stock market.
The Ethereum merge on September 6th, that will end on Sept 20, the inflation report on September 13 and the next FOMC meeting afterwards with the new interest rates hike.
That is reflected in the crypto space in general as a bearish outlook.
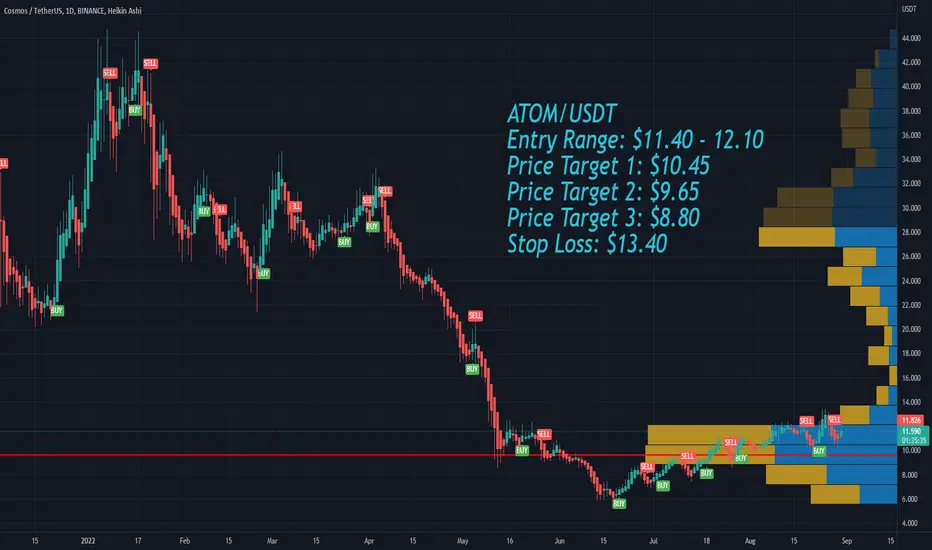
ATOM is a cypto with a negative overall sentiment recently.
I have the following price targets:
ATOM/USDT
Entry Range: $11.40 - 12.10
Price Target 1: $10.45
Price Target 2: $9.65
Price Target 3: $8.80
Stop Loss: $13.40
Near bearish sentiment September has major catalysts for the crypto market as well as for the stock market.
The Ethereum merge on September 6th, that will end on Sept 20, the inflation report on September 13 and the next FOMC meeting afterwards with the new interest rates hike.
That is reflected in the crypto space in general as a bearish outlook.
NEAR is a cypto with a negative overall sentiment recently.
I have the following price targets:
NEAR/USDT short
Entry Range: $4.00 - 4.35
Price Target 1: $3.65
Price Target 2: $3.20
Price Target 3: $2.95
Stop Loss: $4.85

FLOW bearish sentimentSeptember has major catalysts for the crypto market as well as for the stock market.
The Ethereum merge on September 6th, that will end on Sept 20, the inflation report on September 13 and the next FOMC meeting afterwards with the new interest rates hike.
That is reflected in the crypto space in general as a bearish outlook.
FLOW is a cypto with a negative overall sentiment recently.
I have the following price targets:
FLOW/USDT short
Entry Range: $1.95 - 2.10
Take Profit 1: $1.75
Take Profit 2: $1.50
Take Profit 3: $1.10
Stop Loss: $2.35

US Oil Sell Opportunity VSA BaseIn this chart price break the support with increasing Volume and retest the level with Low Volume which is clear indication of sell trade. best of luck.

Cardano ADA short Entry Range, Take Profit and Stop LossADA/USDT short
Entry Range: $0.44 - 0.47
Take Profit 1: $0.41
Take Profit 2: $0.35
Take Profit 3: $0.30
Stop Loss: $0.52

AAVE short Entry Range, Take Profit and Stop LossAAVE/USDT short
Entry Range: $88 - 91
Price Target 1: $78
Price Target 2: $71
Price Target 3: $53
Stop Loss: $102

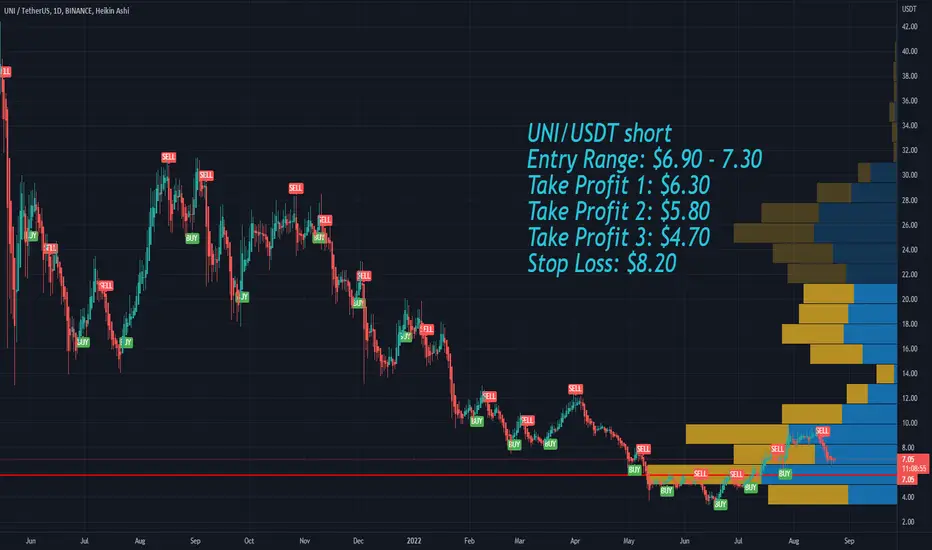
Uniswap UNI short Entry Range, Take Profit and Stop LossUNI/USDT short
Entry Range: $6.90 - 7.30
Take Profit 1: $6.30
Take Profit 2: $5.80
Take Profit 3: $4.70
Stop Loss: $8.20
METAMeta is in a poisition currently you don't want to be buying quite yet. There's further downside to flush out and CEO hasn't bought a single share on this downward turn.
130 lvl to buy is a great spot to start.

xauusd gold shortDear friends, in the 4-hour time frame, the upward dynamic trend line has been broken and after the pullback, it will hit the following targets. Also, the divergence is evident here.
tp1=1767
tp2=1756
If you like my analysis, be sure to like and follow me


Tezos XTZ Entry Range, Take Profit and Stop LossXTZ/USDT
Entry Range: $1.80 - 2.15
Price Target 1: $2.45
Price Target 2: $3.25
Price Target 3: $4.10
Stop Loss: $1.55

Cosmos ATOM Entry Range, Take Profit and Stop LossATOM/USDT
Entry Range: $11.59 - 12.70
Price Target 1: $13.70
Price Target 2: $15.50
Price Target 3: $17.00
Stop Loss: $9.70

Fantom FTM Entry Range, Take Profit and Stop LossFTM/USDT
Entry Range: $0.39 - 0.43
Take Profit 1: $0.57
Take Profit 2: $0.71
Take Profit 3: $1.13
Stop Loss: $0.31

Good Sell position in goldHi
We are in 5th wave of ending diagonal in Elliott wave analysis. A good sell position is ready to catch profit. I predict that flat or regtangular correction can be occurred.
Have a good trade
Yours

USD CAD SELL (SHORT) ANALSIS Hello traders this is my analysis on usd cad
we see they have taken out trendline liquidity with an impulsive move creating a fresh supply zone
I did my analysis on a 4 hr time frame but have refined it to a 15 min time frame
Once price reaches our supply zone , enter after seeing change of character (choch) on a smaller timeframe like 1 min or 5 min .
if this analysis has been useful please leave a comment

BTC Bitcoin short Entry Range, Take Profit and Stop LossBTC /USDT short
Entry Range: $2300 - 23200
Price Target 1: $22020
Price Target 2: $20950
Price Target 3: $18900
Stop Loss: $24800

Elrond EGLD short Entry Range, Take Profit and Stop LossEGLD/USDT short
Entry Range: $65 - 69
Price Target 1: $59
Price Target 2: $49
Price Target 3: $39
Stop Loss: $79
