GBPCAD Will Go Down From Resistance! Sell!
Take a look at our analysis for GBPCAD.
Time Frame: 1D
Current Trend: Bearish
Sentiment: Overbought (based on 7-period RSI)
Forecast: Bearish
The market is approaching a key horizontal level 1.850.
Considering the today's price action, probabilities will be high to see a movement to 1.836.
P.S
We determine oversold/overbought condition with RSI indicator.
When it drops below 30 - the market is considered to be oversold.
When it bounces above 70 - the market is considered to be overbought.
Disclosure: I am part of Trade Nation's Influencer program and receive a monthly fee for using their TradingView charts in my analysis.
Like and subscribe and comment my ideas if you enjoy them!
SELL

AUD/JPY SENDS CLEAR BEARISH SIGNALS|SHORT
Hello, Friends!
AUD/JPY pair is in the uptrend because previous week’s candle is green, while the price is clearly rising on the 4H timeframe. And after the retest of the resistance line above I believe we will see a move down towards the target below at 96.380 because the pair overbought due to its proximity to the upper BB band and a bearish correction is likely.
Disclosure: I am part of Trade Nation's Influencer program and receive a monthly fee for using their TradingView charts in my analysis.
✅LIKE AND COMMENT MY IDEAS✅

EUR/JPY BEARS WILL DOMINATE THE MARKET|SHORT
EUR/JPY SIGNAL
Trade Direction: short
Entry Level: 172.040
Target Level: 170.885
Stop Loss: 172.804
RISK PROFILE
Risk level: medium
Suggested risk: 1%
Timeframe: 9h
Disclosure: I am part of Trade Nation's Influencer program and receive a monthly fee for using their TradingView charts in my analysis.
✅LIKE AND COMMENT MY IDEAS✅

XAUUSD Gold Trading Strategy August 11, 2025
At the beginning of the new week's trading session, the gold price fell sharply from the 340x area to the current 335x area.
Basic news: The US Dollar Index (DXY) fell to around 98 last week, unable to stay above 100. Although the 10-year Treasury yield rose to 4.285%, the Dollar remained under pressure, reflecting market concerns about political risks in the United States.
Technical analysis: After the price met the 340x resistance area, it fell sharply. Currently, the H1 frame MA lines have turned into resistance, but the H4 frame is still support. The H1 frame RSI is showing signs of increasing again and moving towards the average line; the H4 frame RSI is adjusting towards the oversold area. We will wait at the resistance areas and liquidity areas to trade.
Important price zones today: 3375 - 3380, 3350 - 3355 and 3395 - 3400.
Today's trading trend: SELL.
Recommended orders:
Plan 1: SELL XAUUSD zone 3378 - 3380
SL 3383
TP 3375 - 3365 - 3355 - 3330.
Plan 2: SELL XAUUSD zone 3395 - 3397
SL 3400
TP 3392 - 3382 - 3362 - 3330.
Plan 3: BUY XAUUSD zone 3353 - 3355
SL 3350
TP 3358 - 3368 - 3378 - 3390 (small volume).
Wish you a safe, successful and profitable new trading week.🥰🥰🥰🥰🥰

Gold Retests Support – Waiting for the Next Trend ConfirmationHello everyone, looking at the 4H XAU/USD chart, it’s clear that gold is undergoing a pullback after breaking above its previous high at $3,380. Although the market has formed a higher high, we now see a Fair Value Gap (FVG) appearing, with price consolidating sideways between $3,360 and $3,380.
This reflects market indecision about the next move. Currently, gold is testing a strong support zone at $3,360 — an area with an unfilled FVG. If this support holds, gold may rebound and continue toward $3,400. Conversely, if $3,360 breaks, the next support lies at $3,312, where significant trading volume occurred previously.
Bullish Scenario
If gold holds above $3,360 and breaks above $3,380 with confirmed volume, the next target will be $3,400–$3,420, where strong resistance is located.
Bearish/Correction Scenario
If gold loses the $3,360 support, it could correct toward $3,312, or even retest the major support at $3,280. A deeper correction would present new buying opportunities at lower support zones.
With the current setup, the market is in a decision-making phase. A confirmed breakout or rejection at $3,360 will be a key factor in determining the next trend. What do you think of these scenarios? Share your view in the comments below!

TME Tencent Music Entertainment Group Options Ahead of EarningsIf you haven`t bought TME before the rally:
Now analyzing the options chain and the chart patterns of TME Tencent Music Entertainment Group prior to the earnings report this week,
I would consider purchasing the 23usd strike price Calls with
an expiration date of 2025-9-19,
for a premium of approximately $1.00.
If these options prove to be profitable prior to the earnings release, I would sell at least half of them.

JD Options Ahead of EarningsIf you haven`t bought JD before the recent rally:
Now analyzing the options chain and the chart patterns of JD prior to the earnings report this week,
I would consider purchasing the 32.50usd strike price Calls with
an expiration date of 2026-1-16,
for a premium of approximately $3.10.
If these options prove to be profitable prior to the earnings release, I would sell at least half of them.
Disclosure: I am part of Trade Nation's Influencer program and receive a monthly fee for using their TradingView charts in my analysis.

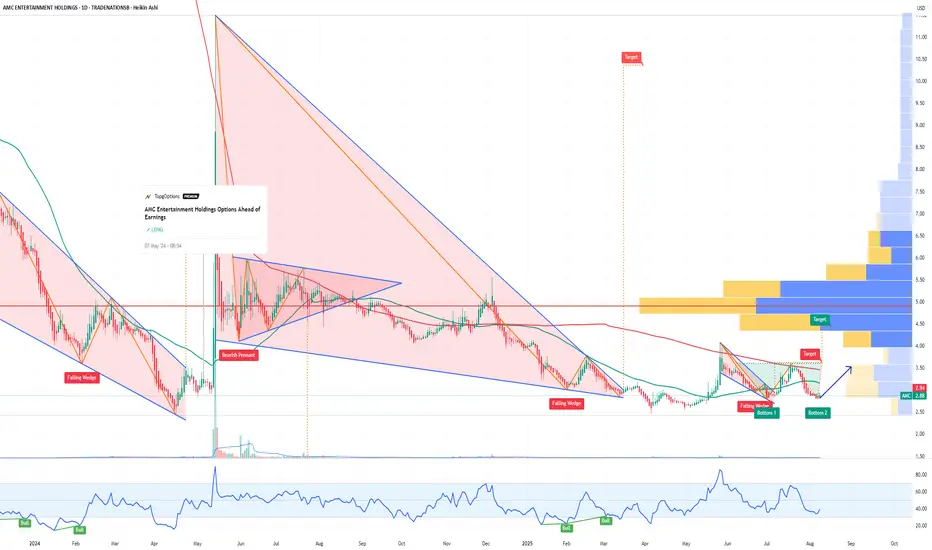
AMC Entertainment Holdings Options Ahead of EarningsIf you haven`t bought AMC before the last breakout:
Now analyzing the options chain and the chart patterns of AMC Entertainment Holdings prior to the earnings report this week,
I would consider purchasing the 2.50usd strike price Calls with
an expiration date of 2025-8-29,
for a premium of approximately $0.52.
If these options prove to be profitable prior to the earnings release, I would sell at least half of them.
Disclosure: I am part of Trade Nation's Influencer program and receive a monthly fee for using their TradingView charts in my analysis.
USD/CHF BEARISH BIAS RIGHT NOW| SHORT
Hello, Friends!
USD/CHF pair is trading in a local downtrend which know by looking at the previous 1W candle which is red. On the 1D timeframe the pair is going up. The pair is overbought because the price is close to the upper band of the BB indicator. So we are looking to sell the pair with the upper BB line acting as resistance. The next target is 0.787 area.
Disclosure: I am part of Trade Nation's Influencer program and receive a monthly fee for using their TradingView charts in my analysis.
✅LIKE AND COMMENT MY IDEAS✅

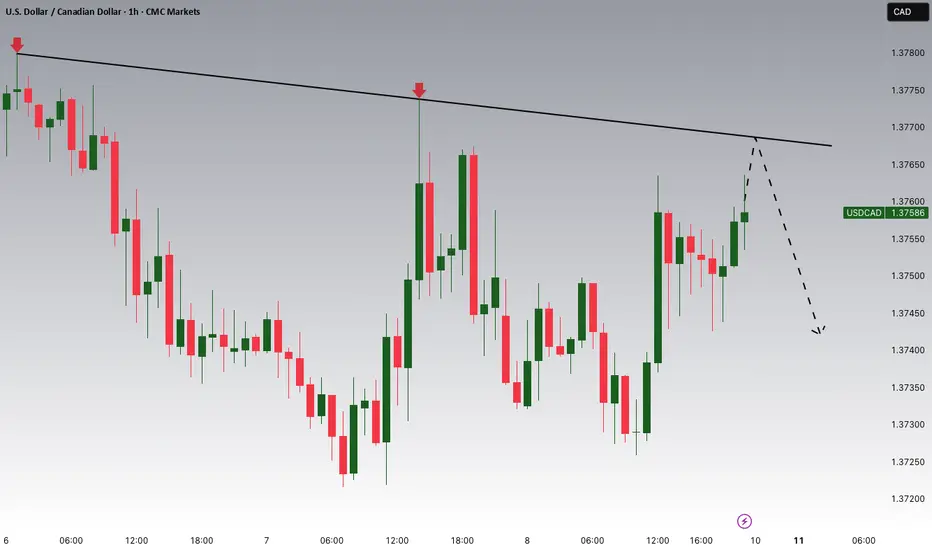
USDCAD Potential DownsidesHey Traders, in the coming week we are monitoring USDCAD for a selling opportunity around 1.37700 zone, USDCAD is trading in a downtrend and currently is in a correction phase in which it is approaching the trend at 1.37700 support and resistance area.
Trade safe, Joe.
BITCOIN Will Move Lower! Short!
Take a look at our analysis for BITCOIN.
Time Frame: 4h
Current Trend: Bearish
Sentiment: Overbought (based on 7-period RSI)
Forecast: Bearish
The price is testing a key resistance 116,484.20.
Taking into consideration the current market trend & overbought RSI, chances will be high to see a bearish movement to the downside at least to 114,249.78 level.
P.S
The term oversold refers to a condition where an asset has traded lower in price and has the potential for a price bounce.
Overbought refers to market scenarios where the instrument is traded considerably higher than its fair value. Overvaluation is caused by market sentiments when there is positive news.
Disclosure: I am part of Trade Nation's Influencer program and receive a monthly fee for using their TradingView charts in my analysis.
Like and subscribe and comment my ideas if you enjoy them!

USD/JPY BEARS ARE STRONG HERE|SHORT
Hello, Friends!
We are targeting the 145.012 level area with our short trade on USD/JPY which is based on the fact that the pair is overbought on the BB band scale and is also approaching a resistance line above thus going us a good entry option.
Disclosure: I am part of Trade Nation's Influencer program and receive a monthly fee for using their TradingView charts in my analysis.
✅LIKE AND COMMENT MY IDEAS✅

AUD/USD SHORT FROM RESISTANCE
Hello, Friends!
We are now examining the AUD/USD pair and we can see that the pair is going up locally while also being in a uptrend on the 1W TF. But there is also a powerful signal from the BB upper band being nearby, indicating that the pair is overbought so we can go short from the resistance line above and a target at 0.644 level.
Disclosure: I am part of Trade Nation's Influencer program and receive a monthly fee for using their TradingView charts in my analysis.
✅LIKE AND COMMENT MY IDEAS✅

EURJPY Will Go Lower From Resistance! Sell!
Here is our detailed technical review for EURJPY.
Time Frame: 2h
Current Trend: Bearish
Sentiment: Overbought (based on 7-period RSI)
Forecast: Bearish
The market is on a crucial zone of supply 172.145.
The above-mentioned technicals clearly indicate the dominance of sellers on the market. I recommend shorting the instrument, aiming at 171.318 level.
P.S
We determine oversold/overbought condition with RSI indicator.
When it drops below 30 - the market is considered to be oversold.
When it bounces above 70 - the market is considered to be overbought.
Disclosure: I am part of Trade Nation's Influencer program and receive a monthly fee for using their TradingView charts in my analysis.
Like and subscribe and comment my ideas if you enjoy them!

NZDCAD Will Go Lower! Short!
Take a look at our analysis for NZDCAD.
Time Frame: 1D
Current Trend: Bearish
Sentiment: Overbought (based on 7-period RSI)
Forecast: Bearish
The price is testing a key resistance 0.817.
Taking into consideration the current market trend & overbought RSI, chances will be high to see a bearish movement to the downside at least to 0.808 level.
P.S
Overbought describes a period of time where there has been a significant and consistent upward move in price over a period of time without much pullback.
Disclosure: I am part of Trade Nation's Influencer program and receive a monthly fee for using their TradingView charts in my analysis.
Like and subscribe and comment my ideas if you enjoy them!

BITCOIN BEARS WILL DOMINATE THE MARKET|SHORT
BITCOIN SIGNAL
Trade Direction: short
Entry Level: 116,600.46
Target Level: 114,560.87
Stop Loss: 117,943.96
RISK PROFILE
Risk level: medium
Suggested risk: 1%
Timeframe: 4h
Disclosure: I am part of Trade Nation's Influencer program and receive a monthly fee for using their TradingView charts in my analysis.
✅LIKE AND COMMENT MY IDEAS✅

NZD/USD SENDS CLEAR BEARISH SIGNALS|SHORT
NZD/USD SIGNAL
Trade Direction: short
Entry Level: 0.595
Target Level: 0.590
Stop Loss: 0.599
RISK PROFILE
Risk level: medium
Suggested risk: 1%
Timeframe: 6h
Disclosure: I am part of Trade Nation's Influencer program and receive a monthly fee for using their TradingView charts in my analysis.
✅LIKE AND COMMENT MY IDEAS✅

GBP/USD BEARS ARE GAINING STRENGTH|SHORT
Hello, Friends!
The BB upper band is nearby so GBP-USD is in the overbought territory. Thus, despite the uptrend on the 1W timeframe I think that we will see a bearish reaction from the resistance line above and a move down towards the target at around 1.328.
Disclosure: I am part of Trade Nation's Influencer program and receive a monthly fee for using their TradingView charts in my analysis.
✅LIKE AND COMMENT MY IDEAS✅

EUR/USD SELLERS WILL DOMINATE THE MARKET|SHORT
Hello, Friends!
Previous week’s green candle means that for us the EUR/USD pair is in the uptrend. And the current movement leg was also up but the resistance line will be hit soon and upper BB band proximity will signal an overbought condition so we will go for a counter-trend short trade with the target being at 1.152.
Disclosure: I am part of Trade Nation's Influencer program and receive a monthly fee for using their TradingView charts in my analysis.
✅LIKE AND COMMENT MY IDEAS✅

XAUUSD Gold Trading Strategy August 8, 2025XAUUSD Gold Trading Strategy August 8, 2025:
Gold prices have approached the 340x area and have fallen sharply to the 338x support area at the beginning of today's trading session.
Basic news: President Trump announced to double tariffs on Indian goods to 50% in response to continued oil imports from Russia. Reports show that Trump may meet with Russian President Vladimir Putin as early as next week.
Technical analysis: Gold prices are currently in an uptrend channel, but the trading range is showing signs of narrowing. The possibility that the price will correct at this 340x area is very high; if the gold price creates a double peak pattern in the H1 frame, the price range of 3375 - 3380 will confirm the pattern and create a strong downward force for the gold price. If gold forms a double top pattern here, this correction could take gold to the 3350 or even 3330 area.
Important price zones today: 3375 - 3380, 3405 - 3410 and 3420 - 3425.
Today's trading trend: SELL.
Recommended orders:
Plan 1: SELL XAUUSD zone 3407 - 3409
SL 3412
TP 3404 - 3394 - 3374 - 3354.
Plan 2: SELL XAUUSD zone 3423 - 3425
SL 3428
TP 3420 - 3410 - 3390 - 3370.
Plan 3: BUY XAUUSD zone 3375 - 3377
SL 3372
TP 3380 - 3390 - 3400.
Wish you a safe, successful and profitable trading weekend.🌟🌟🌟🌟🌟

Gold rises on continued central bank buyingHello everyone, great to see you again!
Gold prices have continued their upward momentum since last night, reaching as high as 3,403 USD, up 33 USD from the session’s low. At the time of writing, gold is undergoing a slight pullback but remains elevated around 3,385 USD.
The primary driver behind today’s rally is news that the People’s Bank of China (PBoC) continued accumulating gold in July, marking the ninth consecutive month of purchases.
Specifically, PBoC’s gold reserves increased by 60,000 ounces, bringing total holdings to 73.96 million ounces. Since November last year, China has purchased roughly 36 tonnes of gold in a move to diversify reserves and reduce reliance on the US dollar.
This trend of central bank gold buying, particularly by China, has been one of the key factors pushing gold prices up by 30% year-to-date, even though the pace has slowed as prices remain high.
With continued buying from central banks, gold is expected to maintain its upward trajectory, although a stronger US dollar could pose some headwinds.

EUR/USD Holds Steady Ahead of US DataHello everyone, what are your thoughts on FX:EURUSD ?
Today, the pair is trading in a narrow range around 1.1650 on Friday. While the US dollar is struggling to regain strength, a slight pullback in EUR/GBP following the Bank of England’s policy announcement has limited the upside for EUR/USD. The market now awaits upcoming US economic data.
From a technical perspective, EUR/USD remains anchored above newly established support levels. If these levels hold, this pullback could be an excellent accumulation phase before a breakout move.
What do you think? How will EUR/USD move by the end of the session and in the coming days?

AUDJPY SELL SETUP SHOOOOOOOOOOOOOORTTHE Price now on resistance level
and it shaped head and shoulder on time frame 2H and take inducement so i expect shoort
