GOLD (XAU/USD) : SHORT IDEAThe chart shows a classic bearish pennant formation after a strong downward move. Gold has been consolidating in a tight triangular pattern with converging trend lines, indicating decreased volatility before the next directional move. This technical pattern emerged following a significant decline from the 3,350+ highs, with price action now squeezed between narrowing support and resistance levels.
The pennant structure is textbook - we see the characteristic flag-like consolidation with declining volume and compressed price range after the initial sharp selloff. The upper boundary shows consistent rejection of higher prices, while the lower boundary has provided temporary support. This coiling action typically precedes a continuation of the prior trend, which in this case points to further downside.
From a fundamental perspective, the setup aligns with potential policy shifts that could pressure precious metals. Market expectations around tariff pauses or delays in trade war escalation would likely reduce demand for safe-haven assets like gold. When geopolitical tensions ease or trade uncertainties diminish, investors typically rotate out of defensive positions and back into risk assets. Gold, being a primary safe-haven play, tends to suffer during these periods of reduced fear and uncertainty.
The current consolidation may be reflecting this underlying shift in sentiment - from crisis-driven demand to a more stable economic outlook. If tariff implementations are indeed paused or softened, we could see accelerated outflows from precious metals as investors no longer feel the need for portfolio insurance. This fundamental backdrop supports the technical bearish bias, as both chart patterns and potential policy changes point toward continued weakness in gold prices.
The tight range also suggests that a significant move is imminent, with the technical setup favoring a break to the downside based on both the pattern structure and the evolving macro environment.
SELL

Downtrend Awaiting ConfirmationUSDJPY has just made a technical rebound from the support zone at 142.22 up to the resistance area around 144.60 — a confluence with both the EMA 34 and EMA 89. However, based on the chart, this zone has previously acted as a reversal point, and price is now retesting that same level of rejection.
The current price action suggests a high likelihood of a small double-top pattern forming around 144.60. If selling pressure re-emerges here, the market could reverse and head back down toward 142.22, aligning with the developing downtrend.
Moody’s recent warning on U.S. credit rating has placed pressure on the USD, while the JPY continues to hold its safe-haven appeal amid market uncertainty.

EURUSD – Bouncing on trendline amid EU optimismEURUSD continues to hold a strong upward momentum within a short-term ascending channel. After retesting the channel bottom around the 1.1360 zone, price is showing signs of rebounding, and a "small double bottom" pattern appears to be forming. If confirmed, EURUSD may rally toward the resistance area at 1.1447.
Factors supporting the bullish trend:
Trump temporarily postponed the 50% tariff on EU goods until July 9 → Trade tensions ease, supporting the euro.
Germany's Q1 GDP grew by 0.4% – above expectations → Boosts confidence in Eurozone recovery.
The ECB aims to elevate the euro’s global role (digital euro, cross-border payment improvements).
Potential scenario:
If the 1.1360 zone holds (channel bottom + EMA support), there is a high chance that price will retest and break above the 1.1447 resistance.

Trump Eases Tariff Pressure, Gold Awaits Fed SignalsOn May 26, U.S. President Donald Trump decided to extend the deadline for the 50% tariff on goods from the European Union until July 9. This move temporarily eased trade tensions and slightly reduced the demand for gold as a safe haven.
Gold is currently trading near a long-term descending trendline that has previously rejected three bullish attempts. After a strong recent rebound, the price is now pausing and risks retracing toward the support zone around 3,241.4 – a confluence area with both the EMA 34 and EMA 89.
If this support holds, gold may bounce back and attempt a breakout above the trendline, targeting the 3,439.5 level. However, if selling pressure continues to dominate, a deeper correction remains a real possibility.
This week, investors will closely watch the FOMC meeting minutes and the U.S. Consumer Confidence Index for May. These data releases are expected to shed light on the Federal Reserve’s outlook on inflation and interest rate policy, which could significantly impact the strength of the USD and gold prices.

COST Costco Wholesale Corporation Options Ahead of EarningsIf you haven`t bought COST before the rally:
Now analyzing the options chain of COST Costco prior to the earnings report this week,
I would consider purchasing the 800usd strike price Puts with
an expiration date of 2027-1-15,
for a premium of approximately $42
If these options prove to be profitable prior to the earnings release, I would sell at least half of them.

PSTG Pure Storage Options Ahead of EarningsAnalyzing the options chain and the chart patterns of PSTG Pure Storage prior to the earnings report this week,
I would consider purchasing the 60usd strike price Calls with
an expiration date of 2025-6-20,
for a premium of approximately $2.55.
If these options prove to be profitable prior to the earnings release, I would sell at least half of them.

ZS Zscaler Options Ahead of EarningsIf you haven`t bought the dip on ZS:
Now analyzing the options chain and the chart patterns of ZS Zscaler prior to the earnings report this week,
I would consider purchasing the 250usd strike price Puts with
an expiration date of 2026-1-16,
for a premium of approximately $29.30.
If these options prove to be profitable prior to the earnings release, I would sell at least half of them.
Disclosure: I am part of Trade Nation's Influencer program and receive a monthly fee for using their TradingView charts in my analysis.

NAS100 Will Go Down! Sell!
Please, check our technical outlook for NAS100.
Time Frame: 12h
Current Trend: Bearish
Sentiment: Overbought (based on 7-period RSI)
Forecast: Bearish
The price is testing a key resistance 21,208.3.
Taking into consideration the current market trend & overbought RSI, chances will be high to see a bearish movement to the downside at least to 19,875.4 level.
P.S
We determine oversold/overbought condition with RSI indicator.
When it drops below 30 - the market is considered to be oversold.
When it bounces above 70 - the market is considered to be overbought.
Disclosure: I am part of Trade Nation's Influencer program and receive a monthly fee for using their TradingView charts in my analysis.
Like and subscribe and comment my ideas if you enjoy them!

USDJPY Will Go Lower From Resistance! Sell!
Please, check our technical outlook for USDJPY.
Time Frame: 12h
Current Trend: Bearish
Sentiment: Overbought (based on 7-period RSI)
Forecast: Bearish
The market is testing a major horizontal structure 145.469.
Taking into consideration the structure & trend analysis, I believe that the market will reach 142.516 level soon.
P.S
The term oversold refers to a condition where an asset has traded lower in price and has the potential for a price bounce.
Overbought refers to market scenarios where the instrument is traded considerably higher than its fair value. Overvaluation is caused by market sentiments when there is positive news.
Disclosure: I am part of Trade Nation's Influencer program and receive a monthly fee for using their TradingView charts in my analysis.
Like and subscribe and comment my ideas if you enjoy them!

GOLD SELLERS WILL DOMINATE THE MARKET|SHORT
GOLD SIGNAL
Trade Direction: short
Entry Level: 3,335.28
Target Level: 3,136.44
Stop Loss: 3,467.43
RISK PROFILE
Risk level: medium
Suggested risk: 1%
Timeframe: 1D
Disclosure: I am part of Trade Nation's Influencer program and receive a monthly fee for using their TradingView charts in my analysis.
✅LIKE AND COMMENT MY IDEAS✅

NZD/JPY BEARISH BIAS RIGHT NOW| SHORT
NZD/JPY SIGNAL
Trade Direction: short
Entry Level: 85.992
Target Level: 83.908
Stop Loss: 87.366
RISK PROFILE
Risk level: medium
Suggested risk: 1%
Timeframe: 1D
Disclosure: I am part of Trade Nation's Influencer program and receive a monthly fee for using their TradingView charts in my analysis.
✅LIKE AND COMMENT MY IDEAS✅

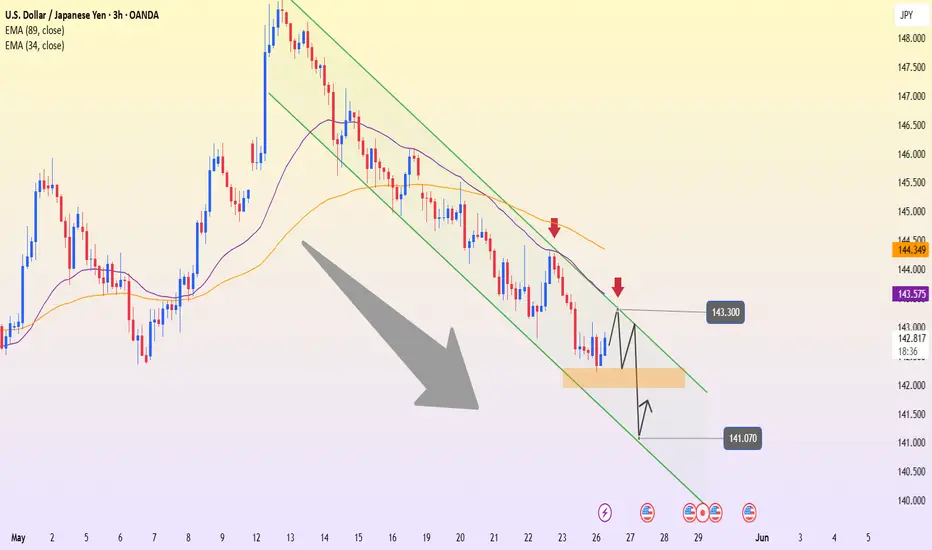
USDJPY – Bearish Channel Holds, Eyes on Support BreakUSDJPY is currently trading within a clearly defined bearish channel on the 3H timeframe, consistently forming lower highs and lower lows. After a slight bounce from the 142.50 support zone, the price is now heading toward the 143.30 resistance area — which aligns with the upper boundary of the channel. This is a zone likely to face rejection and renewed selling pressure.
On the news front, Moody’s recently downgraded the U.S. credit rating due to concerns over prolonged budget deficits, putting pressure on the USD. Although the interest rate gap between the Fed and the BoJ still favors the dollar, current market sentiment is making it harder for USDJPY to maintain a strong rally.
If the 143.30 resistance holds, the price is likely to be pushed back down to retest the 141.07 support zone — a previous low and the lower boundary of the descending channel. A confirmed break below this level would signal further downside, with the next target below the 140.00 mark.
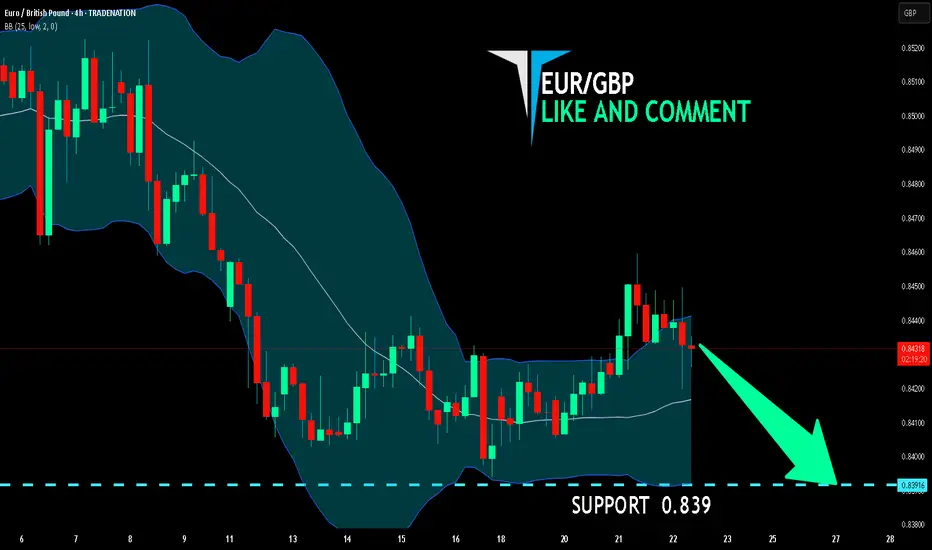
EUR/GBP BEARS ARE GAINING STRENGTH|SHORT
Hello, Friends!
EUR/GBP pair is trading in a local downtrend which know by looking at the previous 1W candle which is red. On the 4H timeframe the pair is going up. The pair is overbought because the price is close to the upper band of the BB indicator. So we are looking to sell the pair with the upper BB line acting as resistance. The next target is 0.839 area.
Disclosure: I am part of Trade Nation's Influencer program and receive a monthly fee for using their TradingView charts in my analysis.
✅LIKE AND COMMENT MY IDEAS✅
1.15150 Resistance Looms Amid EU Economic WoesOn the daily timeframe, EURUSD continues climbing toward the strong resistance zone around 1.15150 after a solid rebound from the EMA 34. However, the current candlestick structure shows signs of slowing momentum as price approaches a historically significant top — a zone prone to short-term profit-taking.
The technical setup becomes even more relevant when viewed alongside macroeconomic developments: the U.S. has just announced an extension of its 50% tariff deadline on EU goods from June 1 to July 9, temporarily easing trade tensions. However, the European Commission has revised down its Eurozone growth forecast for 2025 from 1.3% to 0.9%, highlighting persistent structural weaknesses and economic risks in the region.
The likely scenario: EURUSD may face rejection at 1.15150, followed by a pullback toward the support area around 1.09610. This zone aligns with the EMA 34, EMA 89, and a previous accumulation range. If this support fails to hold, the medium-term trend could shift clearly to the downside.

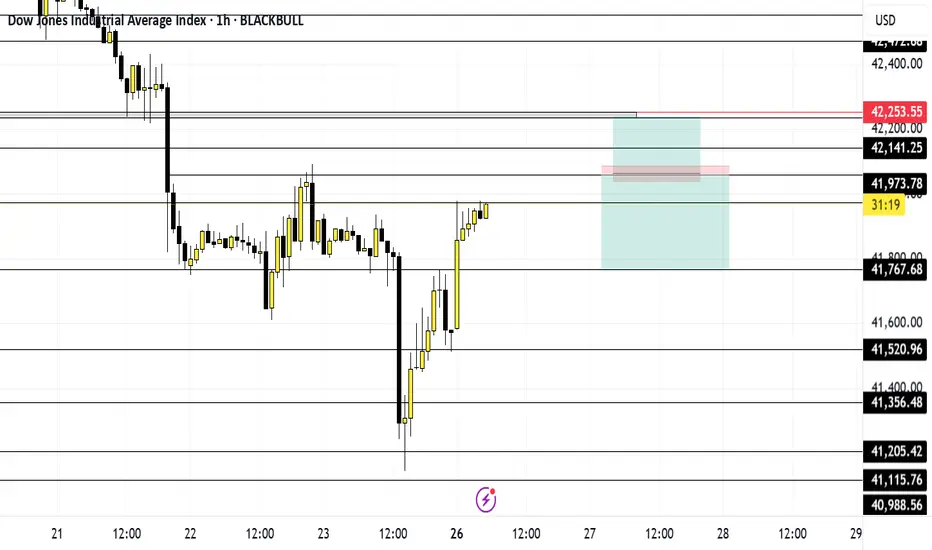
May 26 US30Let's get to work... Price at the moment is trending down, creating lower highs and lower lows on the 4hr. However it broke structure on the 1hr and is trending upward.
I'm going to wait for price to get to 42,055 level and wait for it to break and retest for a buy or break structure for a sell.
Caution. Monday is a holiday so I most likely won't trade until Tuesday.
And ultimately whichever way price goes I'm going to get out at my net key level.
Have fun, stay safe and enjoy your journey
XAUUSD – Signs of Weakness at the Pressure ZoneToday’s market has low trading volume as both the UK and the US are on holiday. This makes price action more prone to “choppy” movements within a narrow range, and technical signals tend to become more reliable.
Gold is approaching a strong resistance zone around 3,420 – a level that previously triggered a sharp drop in early May. Based on the current technical structure, it’s clear that gold is entering a “pressure zone,” as upward momentum slows down and recent candles start to show hesitation.
The most likely scenario is a rejection at 3,420, followed by a pullback toward the 3,250 support area – where EMA 34 and prior accumulation volume converge. If this zone fails to hold, the next target could be around 3,170.
We don’t always have to “call the top,” but this is definitely a time to dial back bullish expectations and closely monitor price action in this sensitive area.

BTCUSDT – Hitting resistance, is selling pressure returning?Bitcoin is showing signs of losing momentum after touching the resistance zone around 111,669. On the H4 timeframe, the previous bullish structure has stalled with a series of red candles and a clear pullback, bringing price back to test the EMA 34 zone.
In terms of news, although the market remains excited due to expectations surrounding a Bitcoin spot ETF, many large investors are starting to take profits after the recent sharp rally. This is causing selling pressure to slightly outweigh buying in the short term.
The most likely scenario now is that BTC could make a mild upward move to retest the 111,600 area – but if it fails to break above, a reversal back toward the support zone at 105,800 is highly probable. This area aligns with the EMA 89 and a previous accumulation zone.
Current strategy: don’t get caught in a false breakout. Instead, watch the 111,600 area and wait for a clear signal. If a reversal candlestick pattern appears, short-term sell entries may be considered with a target near the lower support.

EURUSD – Testing Key Resistance, Signs of a Pullback EmergingEURUSD is gradually approaching the strong resistance zone around 1.142 – a level that has rejected price at least twice in the past. The recent bullish momentum is clear, but the current move is nearing a major barrier, increasing the likelihood of a short-term pullback.
If the price fails to break this zone and rejection signals appear, a drop back toward the support area around 1.125 is highly possible – this level aligns with the EMA 89 and recent swing lows. It will be a key area to watch where the market might “take a breath” before deciding the next direction.
The current strategy is to patiently observe price action at this resistance zone. If confirmation appears, this could offer an opportunity for short-term sell setups. However, if the price decisively breaks above 1.142, the bearish scenario would be invalidated.

XAUUSD holds the trend – Will it break through 3,440?Gold continues to maintain a strong uptrend on the daily timeframe, supported by a rising trendline and upward-sloping EMA 34 and EMA 89. The price is now approaching the key resistance zone at 3,440 – a level that has been rejected twice in the past – making a slight pullback entirely possible.
However, the market structure shows no signs of reversal, and any dip toward the support area around 3,210 could present a “buy on dip” opportunity. As long as the price remains above the ascending trendline, the primary trend is still upward.
Traders are advised to patiently wait for clear signals near support rather than FOMO at resistance. If the 3,440 barrier is broken successfully, bullish momentum may accelerate toward higher targets.

US30 Is Going Down! Sell!
Here is our detailed technical review for US30.
Time Frame: 9h
Current Trend: Bearish
Sentiment: Overbought (based on 7-period RSI)
Forecast: Bearish
The market is approaching a significant resistance area 41,575.9.
Due to the fact that we see a positive bearish reaction from the underlined area, I strongly believe that sellers will manage to push the price all the way down to 40,381.8 level.
P.S
We determine oversold/overbought condition with RSI indicator.
When it drops below 30 - the market is considered to be oversold.
When it bounces above 70 - the market is considered to be overbought.
Disclosure: I am part of Trade Nation's Influencer program and receive a monthly fee for using their TradingView charts in my analysis.
Like and subscribe and comment my ideas if you enjoy them!

EURNZD Will Fall! Short!
Take a look at our analysis for EURNZD.
Time Frame: 8h
Current Trend: Bearish
Sentiment: Overbought (based on 7-period RSI)
Forecast: Bearish
The market is on a crucial zone of supply 1.899.
The above-mentioned technicals clearly indicate the dominance of sellers on the market. I recommend shorting the instrument, aiming at 1.880 level.
P.S
Overbought describes a period of time where there has been a significant and consistent upward move in price over a period of time without much pullback.
Disclosure: I am part of Trade Nation's Influencer program and receive a monthly fee for using their TradingView charts in my analysis.
Like and subscribe and comment my ideas if you enjoy them!

GBP/CAD BEARS WILL DOMINATE THE MARKET|SHORT
Hello, Friends!
We are now examining the GBP/CAD pair and we can see that the pair is going up locally while also being in a uptrend on the 1W TF. But there is also a powerful signal from the BB upper band being nearby, indicating that the pair is overbought so we can go short from the resistance line above and a target at 1.825 level.
Disclosure: I am part of Trade Nation's Influencer program and receive a monthly fee for using their TradingView charts in my analysis.
✅LIKE AND COMMENT MY IDEAS✅

BITCOIN SENDS CLEAR BEARISH SIGNALS|SHORT
BITCOIN SIGNAL
Trade Direction: short
Entry Level: 108,794.06
Target Level: 97,384.13
Stop Loss: 116,400.68
RISK PROFILE
Risk level: medium
Suggested risk: 1%
Timeframe: 1D
Disclosure: I am part of Trade Nation's Influencer program and receive a monthly fee for using their TradingView charts in my analysis.
✅LIKE AND COMMENT MY IDEAS✅
