USDJPY Is Bearish! Short!
Take a look at our analysis for USDJPY.
Time Frame: 30m
Current Trend: Bearish
Sentiment: Overbought (based on 7-period RSI)
Forecast: Bearish
The market is testing a major horizontal structure 142.838.
Taking into consideration the structure & trend analysis, I believe that the market will reach 142.464 level soon.
P.S
Please, note that an oversold/overbought condition can last for a long time, and therefore being oversold/overbought doesn't mean a price rally will come soon, or at all.
Disclosure: I am part of Trade Nation's Influencer program and receive a monthly fee for using their TradingView charts in my analysis.
Like and subscribe and comment my ideas if you enjoy them!
SELL

SILVER SHORT FROM RESISTANCE
SILVER SIGNAL
Trade Direction: short
Entry Level: 3,288.2
Target Level: 3,157.4
Stop Loss: 3,374.6
RISK PROFILE
Risk level: medium
Suggested risk: 1%
Timeframe: 12h
Disclosure: I am part of Trade Nation's Influencer program and receive a monthly fee for using their TradingView charts in my analysis.
✅LIKE AND COMMENT MY IDEAS✅

NZD/CHF BEARS WILL DOMINATE THE MARKET|SHORT
NZD/CHF SIGNAL
Trade Direction: short
Entry Level: 0.492
Target Level: 0.486
Stop Loss: 0.495
RISK PROFILE
Risk level: medium
Suggested risk: 1%
Timeframe: 8h
Disclosure: I am part of Trade Nation's Influencer program and receive a monthly fee for using their TradingView charts in my analysis.
✅LIKE AND COMMENT MY IDEAS✅

CHF/JPY BEARS ARE GAINING STRENGTH|SHORT
Hello, Friends!
CHF/JPY pair is in the uptrend because previous week’s candle is green, while the price is clearly rising on the 1D timeframe. And after the retest of the resistance line above I believe we will see a move down towards the target below at 171.708 because the pair overbought due to its proximity to the upper BB band and a bearish correction is likely.
Disclosure: I am part of Trade Nation's Influencer program and receive a monthly fee for using their TradingView charts in my analysis.
✅LIKE AND COMMENT MY IDEAS✅

AUD/JPY BEARS ARE STRONG HERE|SHORT
Hello, Friends!
We are targeting the 92.544 level area with our short trade on AUD/JPY which is based on the fact that the pair is overbought on the BB band scale and is also approaching a resistance line above thus going us a good entry option.
Disclosure: I am part of Trade Nation's Influencer program and receive a monthly fee for using their TradingView charts in my analysis.
✅LIKE AND COMMENT MY IDEAS✅

CAD/JPY BEST PLACE TO SELL FROM|SHORT
Hello, Friends!
CAD/JPY pair is trading in a local downtrend which know by looking at the previous 1W candle which is red. On the 1H timeframe the pair is going up. The pair is overbought because the price is close to the upper band of the BB indicator. So we are looking to sell the pair with the upper BB line acting as resistance. The next target is 103.758 area.
Disclosure: I am part of Trade Nation's Influencer program and receive a monthly fee for using their TradingView charts in my analysis.
✅LIKE AND COMMENT MY IDEAS✅

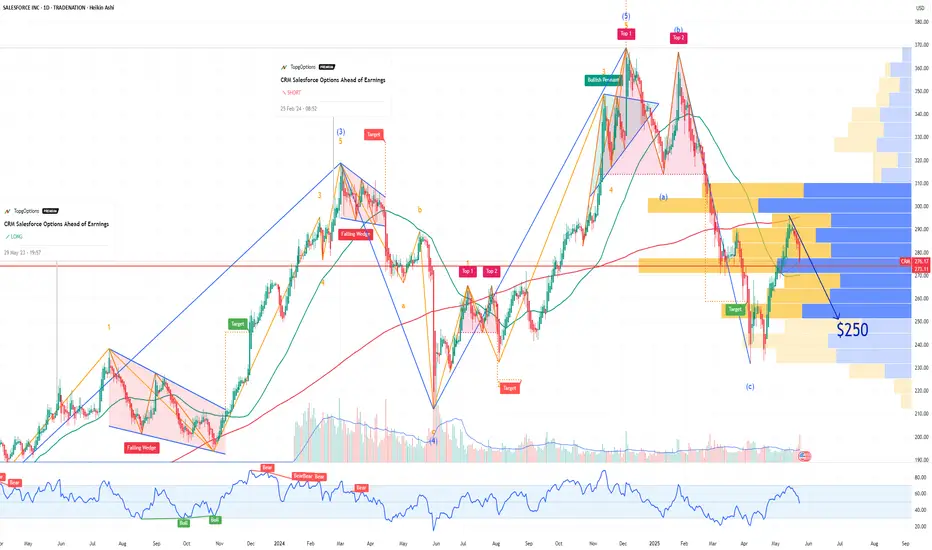
CRM Salesforce Options Ahead of EarningsIf you haven`t bought CRM before this rally:
nor sold this top:
Now analyzing the options chain and the chart patterns of CRM Salesforce prior to the earnings report this week,
I would consider purchasing the 250usd strike price Puts with
an expiration date of 2025-6-20,
for a premium of approximately $5.15.
If these options prove to be profitable prior to the earnings release, I would sell at least half of them.
Disclosure: I am part of Trade Nation's Influencer program and receive a monthly fee for using their TradingView charts in my analysis.
NTNX Nutanix Options Ahead of EarningsIf you haven`t bought NTNX before the recent rally:
Now analyzing the options chain and the chart patterns of NTNX Nutanix prior to the earnings report this week,
I would consider purchasing the 80usd strike price Puts with
an expiration date of 2025-6-20,
for a premium of approximately $5.20.
If these options prove to be profitable prior to the earnings release, I would sell at least half of them.

ELF Beauty Options Ahead of EarningsAnalyzing the options chain and the chart patterns of ELF Beauty prior to the earnings report this week,
I would consider purchasing the 85usd strike price Calls with
an expiration date of 2025-5-30,
for a premium of approximately $5.85.
If these options prove to be profitable prior to the earnings release, I would sell at least half of them.

DELL Technologies Options Ahead of EarningsIf you haven`t bought the recent dip:
Now analyzing the options chain and the chart patterns of DELL Technologies prior to the earnings report this week,
I would consider purchasing the 110usd strike price Puts with
an expiration date of 2025-9-19,
for a premium of approximately $8.90.
If these options prove to be profitable prior to the earnings release, I would sell at least half of them.
I`m bullish long term on DELL though.
Disclosure: I am part of Trade Nation's Influencer program and receive a monthly fee for using their TradingView charts in my analysis.

GOLD (XAU/USD) : SHORT IDEAThe chart shows a classic bearish pennant formation after a strong downward move. Gold has been consolidating in a tight triangular pattern with converging trend lines, indicating decreased volatility before the next directional move. This technical pattern emerged following a significant decline from the 3,350+ highs, with price action now squeezed between narrowing support and resistance levels.
The pennant structure is textbook - we see the characteristic flag-like consolidation with declining volume and compressed price range after the initial sharp selloff. The upper boundary shows consistent rejection of higher prices, while the lower boundary has provided temporary support. This coiling action typically precedes a continuation of the prior trend, which in this case points to further downside.
From a fundamental perspective, the setup aligns with potential policy shifts that could pressure precious metals. Market expectations around tariff pauses or delays in trade war escalation would likely reduce demand for safe-haven assets like gold. When geopolitical tensions ease or trade uncertainties diminish, investors typically rotate out of defensive positions and back into risk assets. Gold, being a primary safe-haven play, tends to suffer during these periods of reduced fear and uncertainty.
The current consolidation may be reflecting this underlying shift in sentiment - from crisis-driven demand to a more stable economic outlook. If tariff implementations are indeed paused or softened, we could see accelerated outflows from precious metals as investors no longer feel the need for portfolio insurance. This fundamental backdrop supports the technical bearish bias, as both chart patterns and potential policy changes point toward continued weakness in gold prices.
The tight range also suggests that a significant move is imminent, with the technical setup favoring a break to the downside based on both the pattern structure and the evolving macro environment.

Downtrend Awaiting ConfirmationUSDJPY has just made a technical rebound from the support zone at 142.22 up to the resistance area around 144.60 — a confluence with both the EMA 34 and EMA 89. However, based on the chart, this zone has previously acted as a reversal point, and price is now retesting that same level of rejection.
The current price action suggests a high likelihood of a small double-top pattern forming around 144.60. If selling pressure re-emerges here, the market could reverse and head back down toward 142.22, aligning with the developing downtrend.
Moody’s recent warning on U.S. credit rating has placed pressure on the USD, while the JPY continues to hold its safe-haven appeal amid market uncertainty.

EURUSD – Bouncing on trendline amid EU optimismEURUSD continues to hold a strong upward momentum within a short-term ascending channel. After retesting the channel bottom around the 1.1360 zone, price is showing signs of rebounding, and a "small double bottom" pattern appears to be forming. If confirmed, EURUSD may rally toward the resistance area at 1.1447.
Factors supporting the bullish trend:
Trump temporarily postponed the 50% tariff on EU goods until July 9 → Trade tensions ease, supporting the euro.
Germany's Q1 GDP grew by 0.4% – above expectations → Boosts confidence in Eurozone recovery.
The ECB aims to elevate the euro’s global role (digital euro, cross-border payment improvements).
Potential scenario:
If the 1.1360 zone holds (channel bottom + EMA support), there is a high chance that price will retest and break above the 1.1447 resistance.

Trump Eases Tariff Pressure, Gold Awaits Fed SignalsOn May 26, U.S. President Donald Trump decided to extend the deadline for the 50% tariff on goods from the European Union until July 9. This move temporarily eased trade tensions and slightly reduced the demand for gold as a safe haven.
Gold is currently trading near a long-term descending trendline that has previously rejected three bullish attempts. After a strong recent rebound, the price is now pausing and risks retracing toward the support zone around 3,241.4 – a confluence area with both the EMA 34 and EMA 89.
If this support holds, gold may bounce back and attempt a breakout above the trendline, targeting the 3,439.5 level. However, if selling pressure continues to dominate, a deeper correction remains a real possibility.
This week, investors will closely watch the FOMC meeting minutes and the U.S. Consumer Confidence Index for May. These data releases are expected to shed light on the Federal Reserve’s outlook on inflation and interest rate policy, which could significantly impact the strength of the USD and gold prices.

COST Costco Wholesale Corporation Options Ahead of EarningsIf you haven`t bought COST before the rally:
Now analyzing the options chain of COST Costco prior to the earnings report this week,
I would consider purchasing the 800usd strike price Puts with
an expiration date of 2027-1-15,
for a premium of approximately $42
If these options prove to be profitable prior to the earnings release, I would sell at least half of them.

PSTG Pure Storage Options Ahead of EarningsAnalyzing the options chain and the chart patterns of PSTG Pure Storage prior to the earnings report this week,
I would consider purchasing the 60usd strike price Calls with
an expiration date of 2025-6-20,
for a premium of approximately $2.55.
If these options prove to be profitable prior to the earnings release, I would sell at least half of them.

ZS Zscaler Options Ahead of EarningsIf you haven`t bought the dip on ZS:
Now analyzing the options chain and the chart patterns of ZS Zscaler prior to the earnings report this week,
I would consider purchasing the 250usd strike price Puts with
an expiration date of 2026-1-16,
for a premium of approximately $29.30.
If these options prove to be profitable prior to the earnings release, I would sell at least half of them.
Disclosure: I am part of Trade Nation's Influencer program and receive a monthly fee for using their TradingView charts in my analysis.

NAS100 Will Go Down! Sell!
Please, check our technical outlook for NAS100.
Time Frame: 12h
Current Trend: Bearish
Sentiment: Overbought (based on 7-period RSI)
Forecast: Bearish
The price is testing a key resistance 21,208.3.
Taking into consideration the current market trend & overbought RSI, chances will be high to see a bearish movement to the downside at least to 19,875.4 level.
P.S
We determine oversold/overbought condition with RSI indicator.
When it drops below 30 - the market is considered to be oversold.
When it bounces above 70 - the market is considered to be overbought.
Disclosure: I am part of Trade Nation's Influencer program and receive a monthly fee for using their TradingView charts in my analysis.
Like and subscribe and comment my ideas if you enjoy them!

USDJPY Will Go Lower From Resistance! Sell!
Please, check our technical outlook for USDJPY.
Time Frame: 12h
Current Trend: Bearish
Sentiment: Overbought (based on 7-period RSI)
Forecast: Bearish
The market is testing a major horizontal structure 145.469.
Taking into consideration the structure & trend analysis, I believe that the market will reach 142.516 level soon.
P.S
The term oversold refers to a condition where an asset has traded lower in price and has the potential for a price bounce.
Overbought refers to market scenarios where the instrument is traded considerably higher than its fair value. Overvaluation is caused by market sentiments when there is positive news.
Disclosure: I am part of Trade Nation's Influencer program and receive a monthly fee for using their TradingView charts in my analysis.
Like and subscribe and comment my ideas if you enjoy them!

GOLD SELLERS WILL DOMINATE THE MARKET|SHORT
GOLD SIGNAL
Trade Direction: short
Entry Level: 3,335.28
Target Level: 3,136.44
Stop Loss: 3,467.43
RISK PROFILE
Risk level: medium
Suggested risk: 1%
Timeframe: 1D
Disclosure: I am part of Trade Nation's Influencer program and receive a monthly fee for using their TradingView charts in my analysis.
✅LIKE AND COMMENT MY IDEAS✅

NZD/JPY BEARISH BIAS RIGHT NOW| SHORT
NZD/JPY SIGNAL
Trade Direction: short
Entry Level: 85.992
Target Level: 83.908
Stop Loss: 87.366
RISK PROFILE
Risk level: medium
Suggested risk: 1%
Timeframe: 1D
Disclosure: I am part of Trade Nation's Influencer program and receive a monthly fee for using their TradingView charts in my analysis.
✅LIKE AND COMMENT MY IDEAS✅

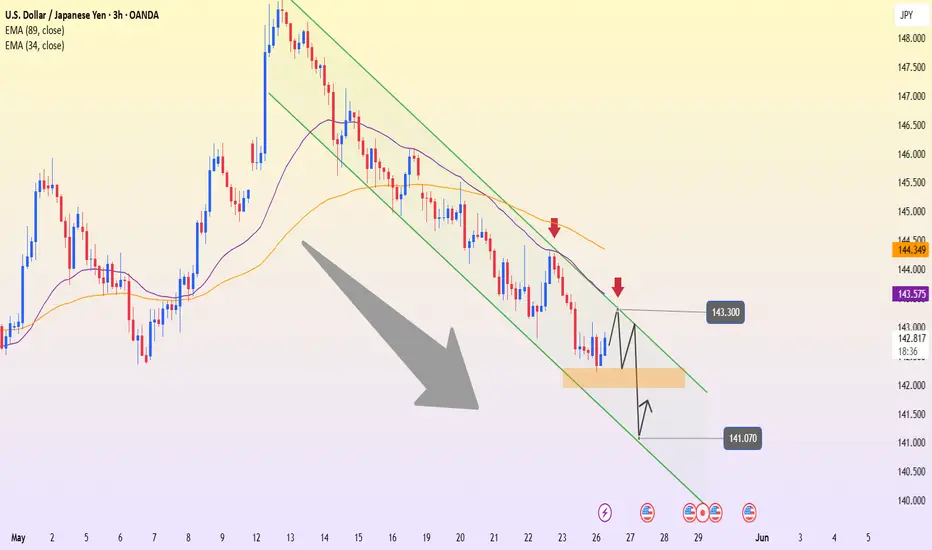
USDJPY – Bearish Channel Holds, Eyes on Support BreakUSDJPY is currently trading within a clearly defined bearish channel on the 3H timeframe, consistently forming lower highs and lower lows. After a slight bounce from the 142.50 support zone, the price is now heading toward the 143.30 resistance area — which aligns with the upper boundary of the channel. This is a zone likely to face rejection and renewed selling pressure.
On the news front, Moody’s recently downgraded the U.S. credit rating due to concerns over prolonged budget deficits, putting pressure on the USD. Although the interest rate gap between the Fed and the BoJ still favors the dollar, current market sentiment is making it harder for USDJPY to maintain a strong rally.
If the 143.30 resistance holds, the price is likely to be pushed back down to retest the 141.07 support zone — a previous low and the lower boundary of the descending channel. A confirmed break below this level would signal further downside, with the next target below the 140.00 mark.
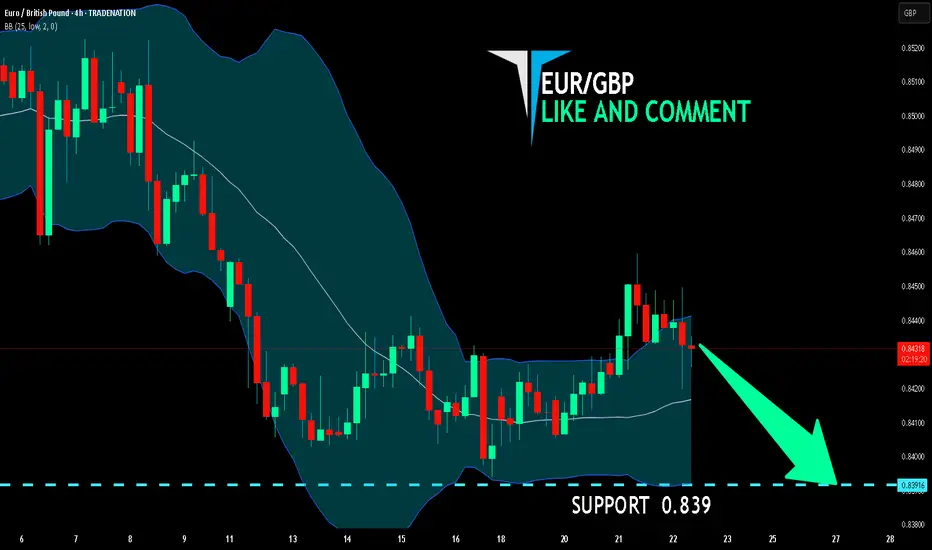
EUR/GBP BEARS ARE GAINING STRENGTH|SHORT
Hello, Friends!
EUR/GBP pair is trading in a local downtrend which know by looking at the previous 1W candle which is red. On the 4H timeframe the pair is going up. The pair is overbought because the price is close to the upper band of the BB indicator. So we are looking to sell the pair with the upper BB line acting as resistance. The next target is 0.839 area.
Disclosure: I am part of Trade Nation's Influencer program and receive a monthly fee for using their TradingView charts in my analysis.
✅LIKE AND COMMENT MY IDEAS✅