US500 Is Going Down! Sell!
Please, check our technical outlook for US500.
Time Frame: 1D
Current Trend: Bearish
Sentiment: Overbought (based on 7-period RSI)
Forecast: Bearish
The market is approaching a key horizontal level 5,960.96.
Considering the today's price action, probabilities will be high to see a movement to 5,538.99.
P.S
We determine oversold/overbought condition with RSI indicator.
When it drops below 30 - the market is considered to be oversold.
When it bounces above 70 - the market is considered to be overbought.
Disclosure: I am part of Trade Nation's Influencer program and receive a monthly fee for using their TradingView charts in my analysis.
Like and subscribe and comment my ideas if you enjoy them!
SELL

USDJPY Will Go Lower From Resistance! Sell!
Take a look at our analysis for USDJPY.
Time Frame: 12h
Current Trend: Bearish
Sentiment: Overbought (based on 7-period RSI)
Forecast: Bearish
The market is on a crucial zone of supply 145.162.
The above-mentioned technicals clearly indicate the dominance of sellers on the market. I recommend shorting the instrument, aiming at 142.359 level.
P.S
Please, note that an oversold/overbought condition can last for a long time, and therefore being oversold/overbought doesn't mean a price rally will come soon, or at all.
Disclosure: I am part of Trade Nation's Influencer program and receive a monthly fee for using their TradingView charts in my analysis.
Like and subscribe and comment my ideas if you enjoy them!

BTCUSDT – Risk of trend break, bearish signs emergingBTCUSDT is trading right at the lower boundary of its ascending channel, around the 108,800 mark. After several bounces from this trendline, price action now appears to be stalling—indicating that buying pressure is weakening. If the price breaks below the 107,500–106,500 support zone (marked by the 34 EMA and recent swing low), the short-term uptrend could be invalidated.
A confirmed break below 106,500 could trigger a further correction toward the 89 EMA around 102,800.
On the news front: Latest data shows Bitcoin’s dominance is slightly decreasing as capital rotates back into altcoins. Additionally, market uncertainty surrounding the Fed's monetary policy outlook is making investors more cautious about riskier assets like crypto.

USDJPY – Rejected at 146.00, downside risk growsUSDJPY reacted strongly at the 146.00 resistance area – a level where price was previously rejected. After a sharp rally, the pair has turned lower and is now heading toward the 144.00 support zone, which aligns with the EMA 34–89 on the H3 chart.
The chart shows a small double top pattern forming around the recent highs. If USDJPY continues to struggle below 146.00 and breaks through the 144.00 support, a short-term downtrend may be confirmed, with the next target around 142.50.
On the news side: The Japanese Yen is gaining some ground again after the BOJ signaled readiness to adjust its easing policy if inflation consistently exceeds its target. Meanwhile, the USD is under pressure as expectations grow that the Fed may keep interest rates steady in the upcoming meeting, due to cooler consumer data.
Suggested strategy: Consider selling if bearish signals appear around the 145.80–146.00 area, with a short-term target at 144.00.

EURUSD – Technical rebound, but bearish pressure still loomsAfter a sharp drop to the support zone around 1.12255, EURUSD has made a mild recovery and is now retesting the 1.13360 resistance area – which aligns with both the 34 and 89 EMAs. This confluence zone could trigger renewed selling pressure if price fails to break above.
The 3-hour chart shows a zigzag-like recovery forming, but each new high is still lower than the previous one – indicating that the downtrend remains intact. If EURUSD continues to struggle at this resistance, it is likely to reverse and retest the 1.11910 support area.
On the news front, markets are awaiting CPI data from both the Eurozone and the U.S. this week. If U.S. inflation comes in higher than expected, the dollar may continue to strengthen – increasing short-term downside pressure on EURUSD.

EUR/GBP BEARS ARE GAINING STRENGTH|SHORT
EUR/GBP SIGNAL
Trade Direction: short
Entry Level: 0.860
Target Level: 0.843
Stop Loss: 0.872
RISK PROFILE
Risk level: medium
Suggested risk: 1%
Timeframe: 1D
Disclosure: I am part of Trade Nation's Influencer program and receive a monthly fee for using their TradingView charts in my analysis.
✅LIKE AND COMMENT MY IDEAS✅

XAUUSD – Weakening signals, growing risk of breakdownGold is trading around $3,273 after a clear drop from the $3,314 resistance zone. On the H8 chart, price has approached the long-term ascending trendline and is hovering near the EMA 89 – a very critical confluence area.
At the moment, price is forming a sideways pattern just above the trendline, but the recovery momentum remains weak. If gold breaks below this zone, the uptrend will officially be invalidated, and the next target could be the $3,135 technical support.
On the news front: The market is closely watching the upcoming U.S. Core PCE data this weekend. This is the Fed’s preferred inflation metric, and if the reading comes in stronger than expected, expectations of prolonged high interest rates could return – which would put significant pressure on gold.

U Unity Potential Buyout Soon?!If you missed my previous signal on U (Unity):
Now Unity Technologies (NYSE: U) just caught fire — surging 12.5% in a single day — on a massive uptick in volume that should have every sharp trader watching closely. With $39.1M in volume against a daily average of 9.4M shares, something is clearly brewing beneath the surface.
But this isn’t just about technicals — the options market is lighting up with unusual activity, and there’s fundamental buyout potential that’s getting harder to ignore.
🔍 Options Traders Are Making Bold Bets
Yesterday: Traders loaded up on January 16 $37 strike calls — deep out-of-the-money, high-risk, high-reward plays.
Today: A massive $3.5 million bet was placed on the $30 strike calls, also expiring January 16.
These aren’t casual bets. This is smart money positioning for a potential takeover or major catalyst, and the timeline is clear: January 2025.
📈 Why a Buyout Could Be Back on the Table
Let’s rewind. On August 9, 2022, AppLovin (APP) made an unsolicited offer to acquire Unity in an all-stock deal worth $17.5B, valuing Unity shares at $58.85 — an 18% premium at the time. Unity rejected the deal.
Fast forward to today:
AppLovin's market cap has exploded — now sitting at a jaw-dropping $127B, up 3,800% since late 2022.
Unity, meanwhile, is a shadow of its former self, trading far below its ATH of $201.12 (November 2021), with ongoing struggles in monetization and competition.
But this disparity creates a prime M&A setup:
AppLovin now has the firepower and strategic incentive to revisit the acquisition — with Unity’s depressed valuation, it’s arguably a bargain.
The AI + gaming narrative is red hot. Combining Unity’s engine with AppLovin’s ad and monetization capabilities could be the synergy Wall Street loves.
🎯 The Trade Setup
Unity just broke out with conviction on high volume — this could be the first leg of a larger move.
Options flow suggests bullish sentiment into early 2025.
A renewed takeover offer could easily push the stock back toward the $50–60 zone, if not higher.
🧠 Final Thoughts
Unity is no stranger to volatility, but when volume spikes, options explode, and a cash-rich suitor like AppLovin is thriving, traders should sit up and pay attention.
We may be watching the early stages of a buyout story 2.0 unfold — and Wall Street might be starting to price it in.
📌 Watch Unity (U) closely in the coming weeks. The market may be whispering — or shouting — "Takeover incoming."

SELL DXYThis week the USD has been retracing, most traders are going long but we know how this goes. Based of our strategy and approach we are still very much bearish on the USD. Our positions for shorts are at 99.916 and adding more shorts at 100.500. Our targets remain at 94.760. If you are catching this set up now then your stops should be above 1011.300. Use proper risk management and risk what you can afford to loose. Best of luck folks.

USDCHF Will Move Lower! Sell!
Take a look at our analysis for USDCHF.
Time Frame: 6h
Current Trend: Bearish
Sentiment: Overbought (based on 7-period RSI)
Forecast: Bearish
The market is on a crucial zone of supply 0.826.
The above-mentioned technicals clearly indicate the dominance of sellers on the market. I recommend shorting the instrument, aiming at 0.814 level.
P.S
Overbought describes a period of time where there has been a significant and consistent upward move in price over a period of time without much pullback.
Disclosure: I am part of Trade Nation's Influencer program and receive a monthly fee for using their TradingView charts in my analysis.
Like and subscribe and comment my ideas if you enjoy them!

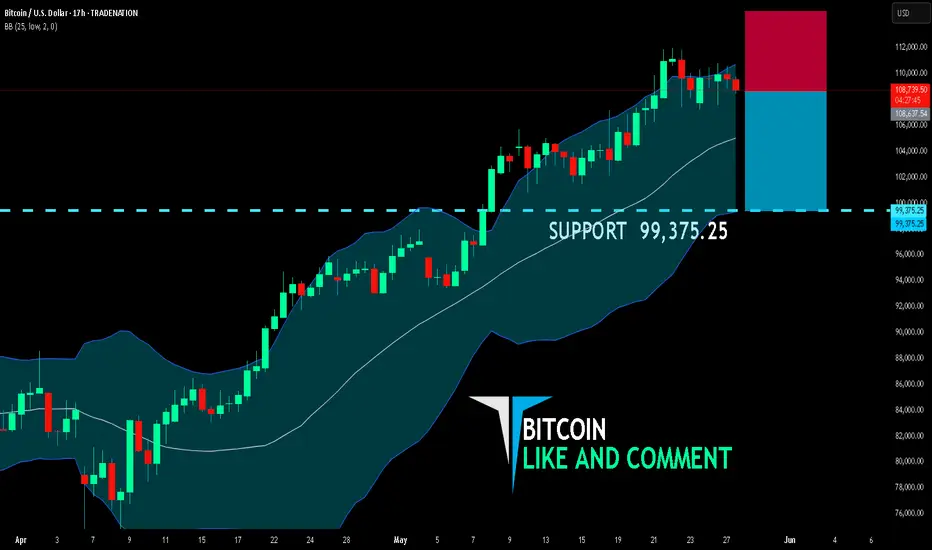
BITCOIN SELLERS WILL DOMINATE THE MARKET|SHORT
BITCOIN SIGNAL
Trade Direction: short
Entry Level: 108,637.54
Target Level: 99,375.25
Stop Loss: 114,788.84
RISK PROFILE
Risk level: medium
Suggested risk: 1%
Timeframe: 17h
Disclosure: I am part of Trade Nation's Influencer program and receive a monthly fee for using their TradingView charts in my analysis.
✅LIKE AND COMMENT MY IDEAS✅
XAUUAD UPDATE 28 - 5 - 2025This is a technical analysis chart for Gold (CFDs on Gold, USD/OZ) on a 45-minute timeframe from TradingView. Here's a breakdown of the key elements:
Chart Summary (as of May 28, 2025):
Current Price: $3,321.640 (up +0.64%)
Chart Timeframe: 45 minutes
Highlighted Zones:
Resistance Zone (Top Yellow Area): Around 3,355–3,360
Support Zones (Middle to Bottom Yellow Areas):
~3,280
~3,240
~3,200
Chart Annotations:
Blue Arrows: Indicate a projected price movement:
1. Short-Term Bullish Move: A rise toward the resistance area near 3,360.
2. Followed by Bearish Reversal: A sharp drop expected after reaching the resistance zone, possibly down to the 3,280 or lower support zone.
Volume Bars: Shown at the bottom, giving insight into trade activity. A noticeable spike in volume supports the prior price drop and recovery pattern.
Interpretation:
The analyst expects a bullish continuation in the short term, reaching the resistance zone around 3,360.
After testing resistance, a rejection and bearish reversal is anticipated, targeting the support zone around 3,280 or even 3,240.
This strategy appears to rely on support/resistance trading and reversal patterns.
Would you like an assessment of the likelihood of this move or suggestions for entry/exit points?

USD/JPY BEARISH BIAS RIGHT NOW| SHORT
USD/JPY SIGNAL
Trade Direction: short
Entry Level: 144.107
Target Level: 141.877
Stop Loss: 145.579
RISK PROFILE
Risk level: medium
Suggested risk: 1%
Timeframe: 6h
Disclosure: I am part of Trade Nation's Influencer program and receive a monthly fee for using their TradingView charts in my analysis.
✅LIKE AND COMMENT MY IDEAS✅

GBP/USD BEST PLACE TO SELL FROM|SHORT
Hello, Friends!
The BB upper band is nearby so GBP-USD is in the overbought territory. Thus, despite the uptrend on the 1W timeframe I think that we will see a bearish reaction from the resistance line above and a move down towards the target at around 1.334.
Disclosure: I am part of Trade Nation's Influencer program and receive a monthly fee for using their TradingView charts in my analysis.
✅LIKE AND COMMENT MY IDEAS✅

EUR/USD BEARS ARE STRONG HERE|SHORT
Hello, Friends!
Bearish trend on EUR/USD, defined by the red colour of the last week candle combined with the fact the pair is overbought based on the BB upper band proximity, makes me expect a bearish rebound from the resistance line above and a retest of the local target below at 1.104.
Disclosure: I am part of Trade Nation's Influencer program and receive a monthly fee for using their TradingView charts in my analysis.
✅LIKE AND COMMENT MY IDEAS✅

EURUSD – Holding the uptrend, eyes on support reactionEURUSD continues to move steadily within a clearly defined rising channel. After touching the channel bottom around 1.1305 (which aligns with the 89 EMA), price is showing a slight rebound and has a chance to form the next upward leg.
Technical view: The bullish structure remains intact. As long as price holds this bottom area, there's a high probability of another push toward the resistance zone around 1.1428 – a level that was previously rejected.
News factor: Market sentiment is now focused on upcoming U.S. Core PCE inflation data, which could influence expectations of a Fed rate cut and, in turn, impact the strength of the USD.
Suggested strategy: Favor buying if price holds above 1.1305 – targeting 1.1428. If this level fails, the short-term uptrend may be challenged.

XAUUSD – Holding the channel, eyeing a bounceGold is still trading within a rising channel, recently touching the confluence support zone of the trendline, the 89 EMA, and the demand area around 3,287. This level has seen strong reactions in the past – and if price holds here again, a bounce toward the 3,382 zone is highly likely.
Supporting factor: Market sentiment remains cautious after Moody’s emphasized the risks surrounding U.S. public debt, putting pressure on the USD and boosting gold’s appeal. In addition, investors are closely watching the upcoming U.S. Core PCE data later this week – a key factor that could influence Fed rate cut expectations.
Suggested scenario: Favor buying if the price holds above 3,287, targeting 3,382 – the upper boundary of the channel. If this fails, selling pressure may return.

GBPUSD Will Fall! Short!
Please, check our technical outlook for GBPUSD.
Time Frame: 12h
Current Trend: Bearish
Sentiment: Overbought (based on 7-period RSI)
Forecast: Bearish
The market is approaching a key horizontal level 1.355.
Considering the today's price action, probabilities will be high to see a movement to 1.336.
P.S
Overbought describes a period of time where there has been a significant and consistent upward move in price over a period of time without much pullback.
Disclosure: I am part of Trade Nation's Influencer program and receive a monthly fee for using their TradingView charts in my analysis.
Like and subscribe and comment my ideas if you enjoy them!

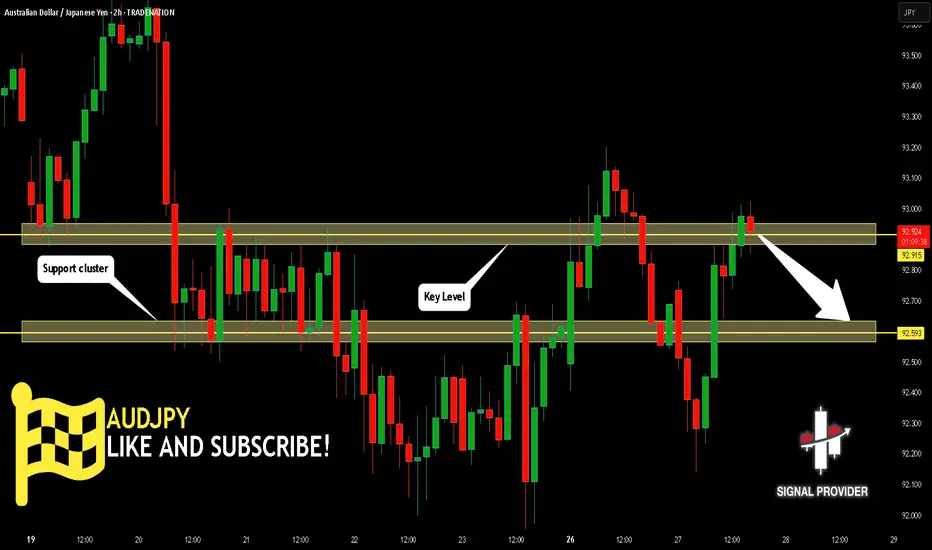
AUDJPY Will Go Lower From Resistance! Short!
Here is our detailed technical review for AUDJPY.
Time Frame: 2h
Current Trend: Bearish
Sentiment: Overbought (based on 7-period RSI)
Forecast: Bearish
The market is approaching a significant resistance area 92.915.
Due to the fact that we see a positive bearish reaction from the underlined area, I strongly believe that sellers will manage to push the price all the way down to 92.593 level.
P.S
Please, note that an oversold/overbought condition can last for a long time, and therefore being oversold/overbought doesn't mean a price rally will come soon, or at all.
Disclosure: I am part of Trade Nation's Influencer program and receive a monthly fee for using their TradingView charts in my analysis.
Like and subscribe and comment my ideas if you enjoy them!
GOLD Will Go Down! Sell!
Please, check our technical outlook for GOLD.
Time Frame: 2h
Current Trend: Bearish
Sentiment: Overbought (based on 7-period RSI)
Forecast: Bearish
The market is approaching a key horizontal level 3,354.87.
Considering the today's price action, probabilities will be high to see a movement to 3,290.54.
P.S
Overbought describes a period of time where there has been a significant and consistent upward move in price over a period of time without much pullback.
Disclosure: I am part of Trade Nation's Influencer program and receive a monthly fee for using their TradingView charts in my analysis.
Like and subscribe and comment my ideas if you enjoy them!

USDJPY Is Bearish! Short!
Take a look at our analysis for USDJPY.
Time Frame: 30m
Current Trend: Bearish
Sentiment: Overbought (based on 7-period RSI)
Forecast: Bearish
The market is testing a major horizontal structure 142.838.
Taking into consideration the structure & trend analysis, I believe that the market will reach 142.464 level soon.
P.S
Please, note that an oversold/overbought condition can last for a long time, and therefore being oversold/overbought doesn't mean a price rally will come soon, or at all.
Disclosure: I am part of Trade Nation's Influencer program and receive a monthly fee for using their TradingView charts in my analysis.
Like and subscribe and comment my ideas if you enjoy them!

SILVER SHORT FROM RESISTANCE
SILVER SIGNAL
Trade Direction: short
Entry Level: 3,288.2
Target Level: 3,157.4
Stop Loss: 3,374.6
RISK PROFILE
Risk level: medium
Suggested risk: 1%
Timeframe: 12h
Disclosure: I am part of Trade Nation's Influencer program and receive a monthly fee for using their TradingView charts in my analysis.
✅LIKE AND COMMENT MY IDEAS✅

NZD/CHF BEARS WILL DOMINATE THE MARKET|SHORT
NZD/CHF SIGNAL
Trade Direction: short
Entry Level: 0.492
Target Level: 0.486
Stop Loss: 0.495
RISK PROFILE
Risk level: medium
Suggested risk: 1%
Timeframe: 8h
Disclosure: I am part of Trade Nation's Influencer program and receive a monthly fee for using their TradingView charts in my analysis.
✅LIKE AND COMMENT MY IDEAS✅
