I WENT SHORT XAU/USDI recently decided not to waste my time explaining why i took a trade, because we never know what the outcome of a trade will be every trade i take from now on i expect a random outcome...i will be sharing the trades i take tho, and just hope for the best
Sellgold


GOLD SHORTMy first commodities share 🤓 I managed to get a good position at 1912.64, the triple touch in this area inspired me to take a short position. A hidden bearish divergence on the daily also encouraged me. I’m adding another short position 🤞🏾

#Gold Sell Oportunity!!!!!!!Gold has beed trading in a ranging market however in a grand corrective cycle.
that means the biased direction is to the downside in order to finish from the third corrective leg near 1805- 1776 $ per ounce.
meanwhile gold is retracing upwards in a 3 waves pullback, we will be looking for short positions near 1914-1917 level with respect to a stop loss
above 1923$ per ounce.
targets are open for now, however 1805 is insight.

gold sell after pull backwe will continue with our gold sell. after a 61.8% pullback now xauusd is shorting to 1950.

Sell opportunity Hello everybody 👋🏻and welcome to my analysis
As you can see on the chart, the price tested the resistance line and I think it can go down.
This is only my opinion.Make your own analysis before investing and always use SL and tp.

gold is going creazy Hello dears, we are choosing today to analyze Gold. as analyze technique show's that gold is going to touch the price 1793. then we will have a bullish trade with force.
but why gold price is going down in that moment of Corona crisis, simple cause market psychology is changed after news of having new vac-sin.


We are selling gold again! In early August, we sold the gold and closed over $100 - 1000 pips in one trade. - Many people did not get involved in sales!
Last week we sent 2 analyzes for a decline to $1920 - Many people did not get in!
Now we expect a new decline and breakthrough of $1920. - Many people will not get involved in sales.
The main reason for missing most of the movements is that we expect something to happen and seek confirmation only in this direction. If we have an active buy position , our brains will find enough reasons to confirm our decision and ignore all the possibilities for a price drop.
This leads to the biggest losses. If he manages to convince us that there is no other option and we are without a stop with a large volume.
This is welcome for the sharks in the market who are waiting for this fresh blood of the still naive market participants!
The price will go up, but how much will fall before that and whether we can withstand this fall if we have a buy are the more important questions.


Gold - Potential selling opportunity setup Taking a look at the 1 Hour chart on Gold, it has gone through a sharp drop since breaking its record highs above the $2000 level.
Currently now the price in Gold has pulled back higher from its sharp recent fall and is trading in an ascending channel.
This Channel has completed a potential larger 3 drive bearish pattern in the process. Why we like this pattern is that it has convergences at the 3rd drive high which also lines up with the 61.8% Fibonacci retracement.
This current high is starting to look like there is a bit of price exhaustion just below the $2000 level as well.
What we want to see is price start to breakdown on our lower time frames and locate any smaller bearish price patterns in the process to help confirm a possible move lower. We have also drawn a lower trend line as this can also increase the probability for a move lower and expose a good point of execution if this trend line gets broken to the downside for a possible retest entry short.
If the price in Gold starts to continue its rise and trades above the pattern and $2000 level no action needs to be taken.


XAU/USD SHORT OPPORTUNITY (HOURLY):XAUUSD needs some relief, retest of Fib 61.8% zone then up to -27.00%. Overall Bullish on GOLD.


Gold monthly downside level is BROKENBecause of the broken monthly level line and it is already retested this level. I am directly bearish tonight on Gold , also because the dollar will rise and as i see on my weekly formation bar it is a shaved bearish bar which means it will go down.
Take profit around 1653.00
and stoploss 1683.00
You don't need to look hours to analyse this chart. It is simple and just follow your analytical and fundamentals
Have a nice weekend and nice trading week
React and share your thoughts what you think?


SELL GOLD SELL XAUSUD
Entry : 1738 - 1744
SL : 1751
TP :
1715 - 1725
Bearish Flag
Over Bought
Disclaimer - Buy/Sell at your own risk!

SELL GOLD SELL XAUUSD
Entry : 1738 - 1744
SL : 1750
TP :
1715 - 1725
Bearish Flag
Over Bought
Disclaimer - Buy/Sell at your own risk!

SELL GOLD SELL GOLD
Entry : 1755 - 1760
TP :
1740 - 1745
Resistant Trendline
Over Bought
Disclaimer - Buy/Sell at your own risk!

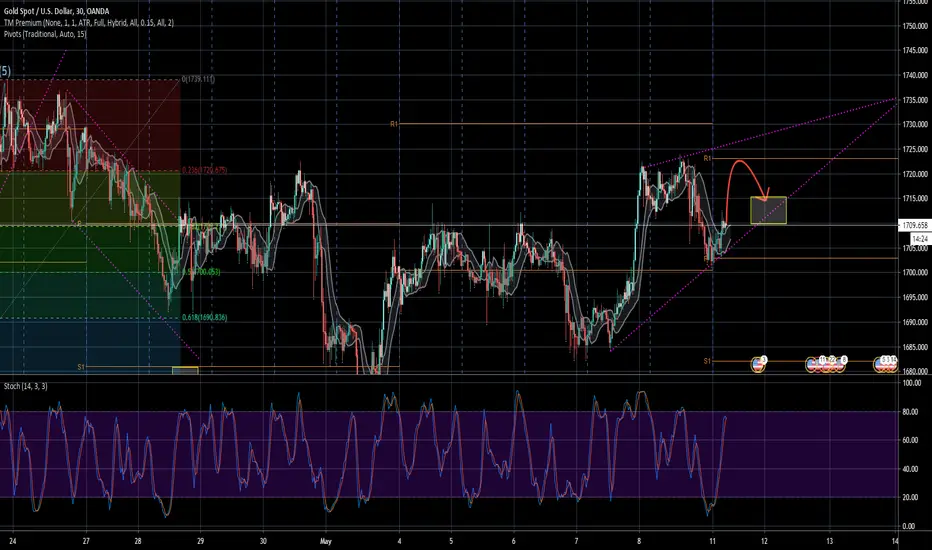
SELL GOLD11 mei 2020 , 10:15 WIB
Sell GOLD
Entry : 1715 - 1725
TP : 1700 - 1710
Ascending Wedge / Resisten zone ( 1723 )
Disclaimer - Buy/Sell at your own risk!