BankNifty futures may test the Support areaFutures seems to have broken the resistance, but is seeing selling at the moment. So I belive we will see and test the Support now.
Selling

Gold melting a little?In the final days in December gold's strength has started to weaken. Wednesday December 27th 2023 is the last high we saw gold peaking around 2088.41. A massive and consistent downtrend has come right after that with a clear formulated structure with lower-low's and lower-high's. Monday January 08th 2024 is when we saw a pull-back and momentum revitalize it's self with going stabilizing itself seeing more stride with it's price trying to gain value back to the upside. Yesterday Tuesday January 9th 2024 during New York session it's seemly lost it's momentum but we can see that Monday's New York session has made clean traffic with price to the upside which in turn will be great for pin pointing where gold will go.
*** KEY ANALYSIS ***
I'm looking for GOLD to break and CLOSE under 2023.83 on a 30M time frame. This will confirm more of a downtrend considering the clean traffic and move up from Monday New York session that had alot of volume
-- Close under my zone at 2023.83
Target 120 pts on candle break and close.
Stops: anywhere above opposite side of the zone at 2027.43

Lessons of Trading by News - MMTC - "Let it" or "Delist it" ???Time and again the stock market gets some knee jerk reaction from Investors based on some Hot News. But most news are shortlived and forgotten in forthcoming days.
One such interesting counter is MMTC - A PSU Mineral Trading Company with 89% stake with Govt of India.
Technical Analysis:
Monthly - Inverted Head and Shoulder pattern indicating a Multi-bagger return
Our initial position was at 61.55 levels and booked profit around 87-88 in just 1 month
The primary reason to book profits was due to a Hot News in October from Govt that they are going to De-list the company. The counter eroded all gains within same month and fell below our entry point. For next 2 months - there is no News about de-listing - no progress - and all the Hype settled down and now when I look at the charts - its back to its beauty. You won't even remember that something happened in Oct looking at the chart now.
The Original Tech pattern (Inv H&S) is still perfectly intact
MMTC is once again on the verge of Breaking Out the Inv H&S pattern.
It has to settle above 68 WCB for neckline BO confirmation
Further it also has to close above 72 WCB for resistance BO and further upside
CAUTION: New Entrants / Safe Players - please AVOID this counter. There is still no clarity on delisting process from Govt. Existing players hold for further gains and make most out of this until you see a significant reversal
Disclaimer:
Stocks-n-Trends is NOT a SEBI registered company. We do not provide Buy / Sell recommendations - rather we provide detailed analysis of how to review a chart, explain multi--timeframe views purely for Educational Purposes. We strongly suggest our followers to "Learn to Ride the Tide" and consult your Financial Advisors before taking any positions.
If you like our detailed analysis, please do rate us with your Likes, Boost and share your comments
-Team Stocks-n-Trends

NVDA: $194M Insider LiquidationNVIDIA is presenting potentially lucrative short-term trading opportunities, specifically for derivatives. A months-long ascending triangle is visible on the hourly and daily charts; a second, smaller ascending triangle is potentially forming at the time of this idea.
I believe, and am hopeful for, that the smaller ascending triangle will prove invalid and complete the double-top "M" pattern with selling pressure draining NVDA to the $430 range which falls around the respective 61.8% Fibonacci retracement level. However, I think it would be reckless to count out a potential rebound around $470 which is where the second ascending triangle's support will be tested.
If the $430 support is reached, I believe this will be the time to enter a long call option as I suspect the asset will be retesting the $500 resistance. However, insider liquidation is a major concern especially since the total offload within the last 30 days is equal to $194.3M USD. A link to the SEC filings is posted below.
NASDAQ:NVDA
www.sec.gov

Selling Signal: GOLD Retesting Key Support AreaDiscover an enticing selling opportunity in GOLD as it undergoes a critical retest of a key support area. With market analysis, technical indicators, and price action as your allies, evaluate the potential downside move. Stay vigilant and informed to capitalize on this precious metal's market dynamics.

Clean traffic downAs Gold heads down lower. We are looking for a clean range of motion to the downside. The Gold candle closed below the 1978.75 area with the candle confirming that there is more volume to the downside. Following this range. It's looking to be clean traffic going all the way down to the low of the candles bearish rejection wick at 1969.77. Price may struggle to break lower than this area but we will need another confirmation on candle close before we can verify anything to be more confident. I will be at a safe entry at the new 30m candle open at 1977.55 doing a safe scalp until 1975. The more aggressive traders can target 1970

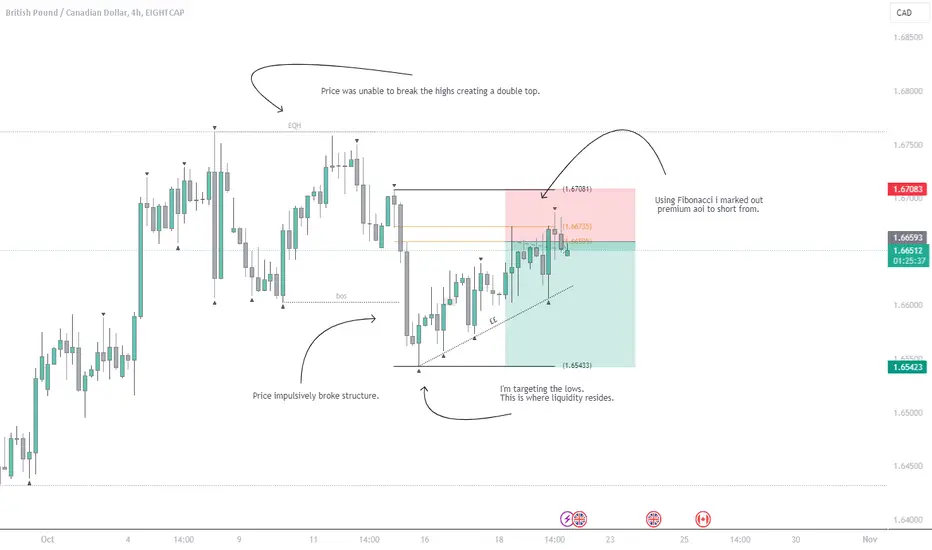
GBPCAD 4HR Swing IdeaThe market has given me an opportunity to go long on GBPCAD.
Price had impulsively broke structure to the downside leaving behind a clear demand zone to mitigate. This move presented a selling opportunity at premium Fibonacci levels.
I have a very simplistic outlook at trading which has come after years of dedication. Simplistic is key to me so i hope this analysis has some value. Thank you.
EURCAD break and retestclassic trading 101 break and retest on this pair, A sell confirmation is all is needed

EURUSD ForecastPrice will most likely continue moving in the downside direction as a wave 3. Wave 3 is usually projected as a 1.618 Fibonacci extension level.

Nifty selling Trend Next week viewNifty will reach 19102 on 21st Aug 2023 10:15am orelse 22nd Aug 202311:15am

USDJPY D1 - Short SignalUSDJPY D1
We are still holding resistance here on the daily timeframe. GBPJPY also still trading much lower than that 182 handle in question yesterday, although the likes of EURJPY has now broken resistance.
USDJPY shorts is certainly something o the radar today, especially after some interesting signs of rejection over the eastern session. DXY sat on 102 support. Would need to see a break of this zone ideally to see deeper rejections on USDJPY.

Should you sell your TESLA shares? ▼We can see price breaking out of a bearish pennant, resulting in a solid move down, retesting first, going down again and now going for a potential second retest of the previous support which now becomes resistance.
Looking for continuation to the downside.
Fundamental backup as the average analyst price target is 180$ a share which is about 20% lower than current prices

This is another quick scalplooking to get in during our London session open momentum, rejection zones at 1960.44. Looking to get in on momentum break from rejection a fee pips down. Entry looks to be safer at 1959.74, aiming for a 2 Dollar move to the downside. If rejection hold we wait for our upper channel to break resistance at 1974.69. We look to aim down entering at 1959.74 exiting at 1956.74

Gold AnalysisXAUUSD
next area of interest for myself is on the D timeframe (daily).
will price reject from this supply, or will price continue higher... we need confirmation before any entry can be made, so this is an interesting one... I would like to know everyones thoughts so please leave a comment on what you think may happen.
Trade Safe.

GOLD SHORT - TRADING IDEAMy next area to sell gold, untapped order block, lets see how this one plays out... want to see a rejection from this zone/ before entering a position, will scale into the lower time frame for that trade and will update accordingly.

GOLD SHORT IDEAmake trading simple. Do not overcomplicate the charts.
rules...
imbalance to fill, break of structure, untapped order block,
this is my analysis on the 15m timeframe... 0.5% risked. LETS GO!

EURCAD IDEA FOR SHORTWho didnt take the trade can enter now,its not late...sell time for eurcad,i took the trade on retest,30 pips sl...why i took the trade is bearish momentum,and a retest of the zone

Selling CAD against FrancThe hourly chart control of bears as the price continues to form lower highs after breaking its double top neckline.

SHORT ON EUR/USDPrice has created equal highs.
The dxy is starting to rise.
If more bears come in to break the uptrend structure we could see price fall further.
Here is the play that I will be taking on this pair:
Order Type - sell stop (pending order)
Entry - 1.07671
Stop loss - 1.08800 112 PIPS
Take profit - 1.03745 392 PIPS
This is a swing trade that may take a few days to play out so please be patient.

DXY Bearish ContinuationHEY TRADERS:
DXY trade criteria:
WHAT ARE WE EXPECTING:"
i'm expecting a continuation correction which is forming now after that it likely going to be the next bearish impulse down
HOW DO WE ENTER:
wait for continuation correction to complete and for entry on the break below correction
OUR STOP LOSS LEVEL:
above bearish continuation correction
POSSIBLE TARGET:
low zone
THANKS FOR READING
AS ALWAYS TRADE SAFE AND STAY SAFE!!!!

SHORT ON EUR/USDPrice has finally broken below the
support area of a Major rising wedge.
It has since given a perfect retest
of the 61.8 fib level and the bears
have now shown up on the lower TF.
Here is the play I will be taking:
Entry - 1.05828
Stop Loss - 1.06354 52 pips
Take Profit - 1.04155 167 pips

SHORT ON AUD/NZDPrice has formed a Major Rising Wedge (bearish reversal pattern) on the 4hr tf.
Price is also at a Major resistance zone with Bearish divergence on the RSI.
I expect price to do some sort of a stop hunt taking out the previous high before falling.
Here is the play I will be taking:
(SELL STOP ORDER)
Entry - 1.07546
Stop Loss - 1.08118 - 57.2 pips
Take Profit - 1.03486 - 406 pips
*** This is a SWING trade! ***

BTC jump to 18 or 20 K then down to the hell ;-)The 18K and 20K are the areas which are the premium price. lets short sell from there ;-)
