Bitcoin Selloff updateThe target is $32700 from which it will bounce to $39800.
Extreme fear in the market with BTC oversold on the RSI.
i don`t believe that the head and shoulders bearish chart pattern will ever complete.
Looking forward to read your opinion about it.
Selloff

BSV to test the support linesBitcoin SV is close to test two important support lines and most likely it will.
What is the utility of those Bitcoin forks anyway?!
Aren`t they useless?

Bitcoin bottom isn't in. Made a video. Real talk guys. As the title says. I don't believe we are at the bottom but we are close so why wait? DCA is king here. Dry powder bombs are your aces so placing some orders in some low territories is a smart idea to scoop up those sales baby!

What's next on Bitcoin?Do you need some intuition for BTC? This is my map!
Fear and Greed index shows 13 (Extreme Fear), where previous week it was 23.
The 28k-29k is a great support, yet we could go to 25k as well. I consider it the next strong support. There are two big bearish patterns, a Head and shoulders and a huge double top pattern. Yet I consider the deeps with green boxes, which are higher than the patterns' target. What is going to do is wait for some time and perhaps Buy (Long) on these supports.
I Feel there would be a larger Volume (Sell off or Buys) which will indicate the next move, So just wait for it.

NFLX Netflix SelloffIf you haven`t shorted the top at my last call:
then you can see NFLX reached a strong support area and it`s now consolidating.
In 2021 insiders sold around $500Mil worth of shares.
The buy opportunity area is $350 - $385 in my opinion if you want to long it once again.
Looking forward to read your opinion about it.

PTON Peloton Buy area after a Massive Head and Shoulders The price target of the massive head and shoulders bearish chart pattern was reached yesterday.
Insiders sold around 500Mil worth of shares last year.
PTON went lower than its IPO price, $29 and is now trading in a consolidation area.
the price is not yet safe in that range.
My buy area is $18 to $24.5
Looking forward to read your opinion about it.

Market Recap and levels to watch for the coming sessionUS markets saw a late session beating to push prices sharply lower into the close and continue the recent selloff. Watch the video for a more detailed breakdown on my Macro picture and key levels I am watching in major markets.
Thanks for watching and please take some time to check out the website.

AUROBINDO PHARMA - Price Action Analysis Considering last week candle, NSE:AUROPHARMA has already given confirmation of further sign of selling .
Price has created harmonic Shark pattern with PRZ level 0.886 and 1.13 with price 651.70 and 548.75 respectively.
As we have witnessed of bounce from 0.886 level but not sustained above 200 MA.
Two things are possible here :
1. It again takes confirmation support nearest to 0.886 level and shows bullish reversal candle
with high volume.
2. Or can see further sell off up to 1.13% level at price 548.75.
BUY: if price sustains above both PRZ level can gives further upside opportunity.
SELL : below 650 price, you can sell if its break or you can do every rise sell with strict SL.

Time to Go Long?Maybe. On higher timeframe, still looks bearish, a Bounce is likely from the 21 MA IMO.
See the 'h' pattern? Primary and Secondary sells. Indecision and consolidation followed.
Would not get real Bullish just yet, although it sure suggests we could see higher next week.
These indicators are by no means foolproof, but they do help you to not make expensive mistakes;
so, closing shorts might be wise here, even if it's too soon to go long.
Not investing advice; trade at your own risk, GLTA!


GBP/USD Chart AnalysisLooking for a GBP sell off this week. Targeting the OB and POC for the overall volume control. The extension on the TP is targeting a large area of un-mitigated price from the previous bullish push to the new highs. This area has to be mitigated by the institutions at some point so they can close out of their sell orders at BE.

Moving the lines for buying the $BTC dip.Moving the lines for buying more bitcoin. Will be patient. Crypo as a highly speculative asset is now closely linked to the high growth/growth stocks, tech index and in the case of selloff I see crypto selling off more too.

USDJPY quick sell off shorts Looking for a rejection off the last supportive area that it broke at 115.700, a rejection from here would give a nice confirmation that we will get a decent sell off. BUT remember higher time frames we are still in a bullish market with this pair. If I get entry's my stop loss will be move very quickly to break even.

BTC/USD: Short Position toward $40,600 USDIn H4 it's look bearish like H8 timeframe
MACD it's showing us sell inminent in this cross-over
I shorting Bitcoin with the SL at $48,650 USD in the live price at $46,200 USD approx. And my target toward $40,600 USD. Only shorting with 0.07 BTC contracts.
Good Luck!!!

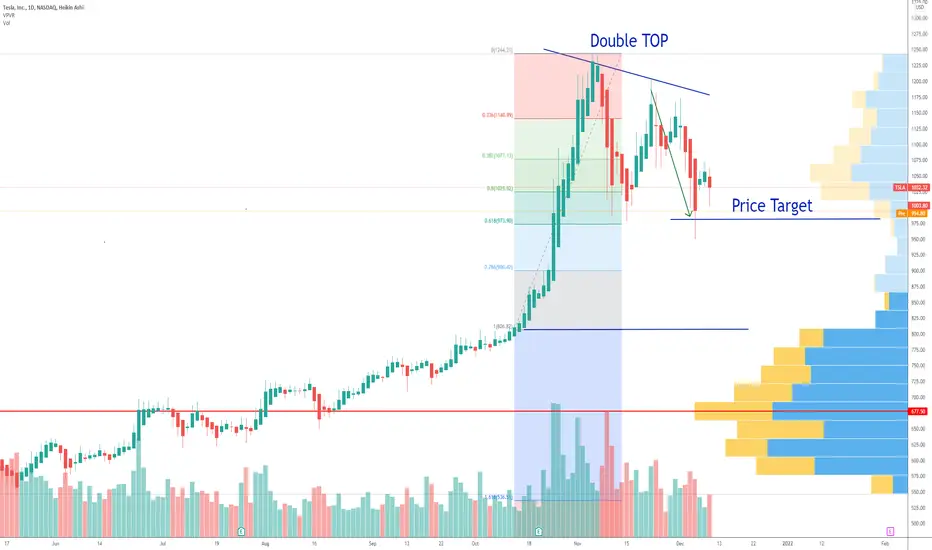
Tesla short short-term short ideaHey Trader,
please see my current idea, where my count suggests an impact of the $ 860 area before we see our next bullish impulse. This may be the perfect zone to buy.
This is no financial advice, just my technical expertise.
RT

Gold is targeting 1720 area - FOMC catalystHey Trader,
please see my current idea on Gold where my count suggests that we are currently in our bearish wave 3. This is due to the fact, that we printed a new low which indicated a break of structure. My last Gold analysis is folded and I am sticking to this one now.
This is no financial advice, just my technical expertise.
RT

USOIL Price TargetIf you haven`s shorted the top here:
Then you should know that USOIL seems to be heading to its major support at 60.40usd.

Elon Musk dumps another $1 Billion TSLA StockIf you haven`t sold when he got the answer "yes" on twitter for selling his shares:
Then you should know that Elon Musk sold another 934,091 TSLA shares, according to filings with the SEC published on Thursday.
The shares are worth $963.2 million.
Ark Invest also sold TSLA shares.
What is your next move?
Are we building for a deeper selloff or a bounceAsian markets remain looking heavy as the HSI and Nikkei Daily timeframes press lower. The US has been more resilient to negative news and remains focused on inflation and interest rates. The question is how much of the good news ie/ strong economy and bounce from pandemic lows has been factored in to price action in the US. If the US start to take a hit, then other markets will follow....so are Asian shares markets flagging what is to come. Check out the video for a more detailed look at key levels for major US, Asian and Australian Indexes.
Remember to check out the website www.tradethestructure.com and leave a comment a thumbs up for the video.

MSTR MicroStrategy bearish chart patternMSTR MicroStrategy is forming a head and shoulders bearish chart pattern.
My price target is the 598usd strong support area.
Looking forward to read your opinion about it.

DAX Sells-Off As Markets Are In Risk-Off SentimentHello traders and investors!
Markets are in risk-off mode as the media is spreading fear about the new covid variant. But everything is maybe just too pessimistic if we consider there are no deaths and no hospitalization for a new variant! However, markets do not like uncertainty so we are seeing a sharp sell-off on stocks, even commodities are coming down which is making a dollar, jpy and chf very strong. DAX is coming down but into some support at around 15k with five waves down, so rally can be coming in three waves. Resistance is at 15500/15450, where a new sell-off may show up, but only once we have an a-b-c rally.
All the best!
Disclosure: Please be informed that information we provide is NOT a trading recommendation or investment advice. All of our work is for educational purposes only.

Asian Markets melting down and do not look healthy longer termThe Nikkei and Hang Seng along with my local ASX200 are well under pressure today and may see further downside in coming sessions. In the video I take a look at the daily charts for my major Indexes and discuss where I see the risk and how I will look to trade any downside if this weakness continues.

FB Meta Platforms sold by ARK InvestIs it overvalued?
Is a crash about to happen?
ARKF sold 43,188 shares of FB yesterday, equivalent of 14.55Mil usd.
And it`s not the first time!
FB has a strong support in the $285 area!
Looking forward to read your opinion about it.
