Is this the Correction?Third time is a charm, I originally thought we would see the sell off after earning as we see the impact of inflation but market didn't seem to care and we had the options gambling mania pushing stocks up parabolically. I don't really get why the inflation number that came out shocks anyone given the expenses reported in everyone's earnings rose sharply and Petrol and food price have been sky rocketing but bout time that 10 year yields come to life. Evergrande finally officially defaults on its $148 million coupon payments and has over $300 million that was due by the end of the year so I don't see that fixing itself and could send china into a Deep recession. If china cant contain this debt problem we could see a big fall coming next year as inflation will continue to rise but if the second largest economy declines the worlds growth will decline. I only have a 7% target on this trade but will see how it unfolds closer to the target. I do still think we Bull into Christmas like always before the impact is felt and we have the bigger sell off some time Feb - March.
Selloff

$PYPL PayPal under heavy fire, where is the bottom??Paypal got destroyed over the last couple of months, after it made it's double top on July 26th.
It has lost 35% of its value since then.
Paypal gapped below the support at around 222ish$ today and that triggered even more selling, since that support held for almost a year now.
The next area, where i see heavy support is at around 184-190$
I feel like that support must really hold, if we for example would gap below that support too and keep selling off,
there is a gap that would be closed at 130$.
Overall, the $PYPL chart really got some technical damage done to it, and it will need some hard work of the bulls to repair that damage.
We ripped a big down gap today, so i expect somewhat of a recovery rallye, also to work off that oversold RSI, but i would not be surprised, if we see another leg down in the $PYPL chart afterwards, since there's alot of fear in this stock now, and holders might use a recovery rallye to rebalance $PYPL in their portfolios.
Definetly not the stock, that would blindly go long on now, just because it got sold off, there's potentially a lot more selling to come in $PYPL

TWTR Twitter to lose market share because of TRUTH Social ? Twitter permanently banned Trump from the platform in January 2021 during the final days of his term. Back then he had over 88.9 million followers.
Can we expect a retracement to that area because of TRUTH Social gaining momentum and market share?
Trump Media & Technology Group and Digital World Acquisition Corp. DWAC have entered into a definitive merger agreement.
The transaction values TMTG at an initial enterprise value of $875 Million, with a potential valuation of up to $1.7 Billion depending on the performance of the stock price post-business combination.
Truth Social is aiming for a beta launch in November.
TRUTH Social will be a competitor to Twitter and Facebook.
TMTG+ will compete with Netflix and Disney+.
TMTG news will compete with CNN and iHeart Radio.
They have also plans for a Tech Stack that includes web hosting (vs Amazon Cloud) and payment processing software (vs PayPal).
Could this be the new Twitter / Facebook platform?
I`m looking forward to read your opinion about it!

GBPJPY Potential Sell to 149.976Using the Fibonacci Tool found a potential sell opportunity. Price just came off of the trend line and may restest the level. If price holds below then I am looking for price to drop.

Market Alpha - EMBNASDAQ:EMB
As a way to get exposure to the China housing debacle.... I go over my chart on a new position I opened that has relatively low volatility considering the weight of exposure it may have to the chinese housing collapse.

Weekly Watchlist 9/20 - 9/24Here is what stocks we are watching for this week!
NASDAQ:NVDA
Currently range bounce with a support of $518. Will looks to take puts on a move under that 518 level.
NYSE:GS
Looking at a double top on the daily level. Looking to take puts under the $388 level
NASDAQ:CRWD
Clean bear flag showing on the daily chart. If we get more selling in tech this should see some nice downside on the break of $259.50
NYSE:SNAP
SNAP we are keeping on from last week's watchlist. Looking to take calls to the upside on a break of $76

Polygon (MATIC) technical analysisMATIC SELL OFF POSITIONS
Polygon (MATIC) technical analysis:
Trade setup: Broke below 1.50 resistance and stabilizing around 1.25 support area (also 50-day MA). Need it to break back above 1.50 resistance. Forecast: 2.00. (set a price alert).
Trend: Neutral on Short-Term basis and Uptrend on Medium- and Long-Term basis.
Momentum is Mixed as MACD Line is below MACD Signal Line ( Bearish ) but RSI ~ 50 (Neutral).
OBV ( On Balance Volume ): is declining, indicating that volume on Up days is lower than volume on Down days. Hence, demand (buyers) is below supply (sellers).
Support and Resistance: Nearest Support Zone is 1.25, then 1.00. The nearest Resistance Zone is 1.50, then 2.00 and 2.50.
-For more chart analysis on the crypto market follow, and if you agree with this, like and share.
Cheers.

NZDUSDYou can as well join the sell market right from here if you wish. But risk what you can afford to loss, please.

S&P 500: this short might just be the real one!The SP500 index seems to have topped @ 4476. Technical analysis points to a sharper correction this time around:
- prices broke-out the long term bullish trendline
- short-term SMAs form an intersection above traded price
- short volumes are accelerating, as the daily range expands
- the new top formation saw the lowest traded volumes, signaling an exhausted market and low buying interest at these levels.
Next support should stand @ 4200 . Short positions till this point, at least, should be easy money.
Below this level, more stops might get triggered.
Looking forward to your thoughts!
Trade smart!

CPI @ +99.4% - Looking for Hot 7% TomorrowThe Inflation statistics are heavily skewed with the potential for a large
surprise in store for Chasers.
DX, BONDS, FX, YIELDS appear to have the scoop.
Insiders buying Puts in SIZE.
Crude Oil trade for entry 57-61s after this next retracement.
Economic Activity is slowing to a crawl.
Spending collapsing.
FED wants you to BUY STOCKS.
VIX Shakeout.
Trade Safe, we're


VIX - PRCE OBJECTIVES30 /38 / 45
We favor the 40s during the dirty second drop.
Algos are working the limits of the Falling Wedge.
The VIX-Plosion is dead ahead as resolution is less
than two weeks away.
The lower compression in Range lows will see a dip-in
as often occurs to shake out the weak hands.
Cruse Oil should see follow through in the coming weeks.
We are beginning to accumulate and reposition our VIX Curve
entries and will post them here as they are filled.
Bonds are about to reverse throughout the Longer end
which continues to Flatten and turn down, indicating a
very large contraction in Economic Activity.
Divergences are frankly astounding and being ignored
by the Chasers, who although ONLY playing in options
on balance - are weak hands there as well.
Gamma only goes so far this Friday.

ROKU double TOP | Less Streaming Viewing55.1 million active customer accounts for the quarter and 17.4 billion streaming hours.
VS
55.8 million active customer accounts and 19.19 billion streaming hours. (The Bloomberg Consensus estimate)
The chart pattern looks like a double top.

FSLY Fastly Head and Shoulders Price TargetThe head and shoulders pattern is one of the most reliable trend reversal patterns.
The distance from the neckline to the head is the same for the retracement from the neckline to the bottom.
In this case, using Renko candles to understand better the H&S chart pattern, the price target is 31usd.

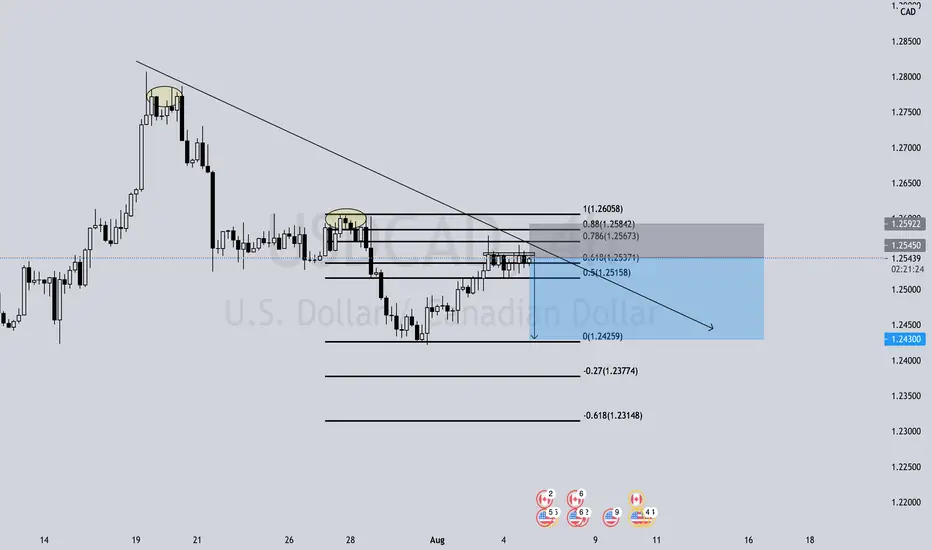
USDCAD SELL USDCAD short position, I have sold this pair for many reasons, one reason is that USDCAD has had a major sell-off for more than two weeks; has been forming lower lows and lower highs...
Price has reached the 0.786 area @1.25680 and has shown major resistance, such as wicks and LL/LH on smaller time frames.
USDCAD has also formed a double top that may indicate a reversal.
I am risking 2% on this trade. Risk to Reward on this trade is 1.2.
SPY - Bearish Arrangements4422 - Gap and Crap complete.
A lower High on smaller timeframes led to Sell Signals which
were quickly heeded.
The 50/200 are now pointing due South on 5 minute timeframe.
Last Thursday the Divergences provided an enormous warning.
Negative Histograms are waiting.
Chasers are eyeing a considerable "Panic Cycle" setting up whereby
the "everything must go sale" begins and leaves they wanting a return
to "normal" - BTD Failed.
It is rejection, a nasty and very sporty rejection which appears to be
lost on the Herd.
We continue to press our VIX Curve Trade with 21.75 today's target.
I have been buying @ 2050-2055 with buys in all the way down to
2015-2025 for a larger press.
Conditions in the Markets have reversed, the largest gains are made
ahead of the broader Point of Recognition.
The Weekly and Daily indicators are simply N A S T Y.
Sellers were lurking at the Gap Fill and slammed the Chippers and
Dippers.
Ignore them are you peril.
Catalyst abound, pay close attention to the Bond Market.

Consumers are pulling back quickly as Uncertainty ReignsThe Indices will see a healthy correction into the Seasonal Period of Extreme Weakness.
We Anticipate a LARGE Selloff to begin during Globex Sunday followed by further selling
into Monday.
The PRICE of the things we need is an issue... it is not lost on Institutions.
They are heavily positioning for SELL.
TCEHY Tencent Head And Shoulders Chart PatternIn the chart you can see a schoolbook Head And Shoulders Bearish Chart Pattern.
Theory says that you measure the distance from the neckline to the top and then consider the same distance to discover the bottom from the neckline down.
In this case it coincides with the strong 40usd support!
ARK also sold its positions in TCEHY Tencent Holdings Limited.
I`m looking forward to read your opinion about it!

BEKE KE Holdings. ARK sold all its 9Mil sharesIn a selloff that can predict a new market valuation on Chinese stocks, ARK Invest sold all its 9 139 000 shares of BEKE.
Looking at its financials, BEKE is not a bad stock to own at at price lower than its IPO.
The company had revenue increase year over year in the last 4 years, but only in 2020 went profitable with 2.78Bil Earnings. They also have a decent PE Ratio (TTM) : 39.71
The question is: would you buy now what ARK sold for a loss??
Even Buffett was wrong when he sold Delta Airlines or Icahn about Hertz!
Jim Cramer (Mad Money) on China's tech crackdown: You can't own Chinese stocks!
It seems dangerous to hold Chinese stocks right now.
US-listed Chinese companies have three years to comply with US accounting oversight, to comply with the rules of accounting and transparency that American public companies must follow, if not they will get delisted.
This looks like the beginning of China`s stock market crash.
I`m looking forward to read your opinion about this!

YQ 17 Education New Regulations UpdateDon`t you like basic technical analysis without fundamentals whatsoever to back it up?
Because otherwise before entering the pump you would paid attention to 17 Education & Technology Group Inc. business update: "institutions providing after-school tutoring services on academic subjects in China's compulsory education system, or Academic AST Institutions, need to be registered as non-profit; changing the current registration-based regime for operating online Academic AST Institutions to a government approval-based regime". (globenewswire.com)
Or maybe you want to own a foundation or a nonprofit company?!
A temporary recovery in share prices after a substantial fall, caused by speculators buying in order to cover their positions is called a Dead Cat Bounce!
China's crackdown on for-profit education companies was a disaster for traders not using a stop loss.
In the 52 Week Range 17 Education & Technology Group Inc. went from 23.9 to 1.02usd. i almost can`t imagine such a loss!
After-school tutoring institutions must transform themselves into "nonprofit organizations".
Jim Cramer (Mad Money) on China's tech crackdown: You can't own Chinese stocks!
ARK Invest dumps Chinese stocks.
It seems dangerous to hold Chinese stocks right now.
US-listed Chinese companies have three years to comply with US accounting oversight, to comply with the rules of accounting and transparency that American public companies must follow, if not they will get delisted.
This looks like the beginning of China`s stock market crash.
I`m looking forward to read your opinion about this!

DIDI Global ideaAt the time of DIDI`s IPO i was tempted to enter this stock because i was listing to Jim Cramer`s blessing: 'I would try to get as many shares as you can'. i hope he didn`t. and i haven`t entered either because i considered the valuation too high for a company that last year had negative earnings, -10.84Bil.
And in comparison i was listing to analysts saying that UBER will never be a profitable company. So why would i invest in the Chinese copy of a business that didn't find the path to profitability for so many years?!
The funny thing is that after going down 55% from the IPO day, Jim Cramer reevaluated the Chinese stocks: "You can't own Chinese stocks"! :)
I`m looking forward to read your opinion on Chinese stocks right now.

GOTU A simple question for bullish tradersGOTU had negative earnings last year, -1.39 Billion dollars to be precise. So it`s a money eating machine that burns a lot of cash just to operate. How do you see Gaotu Techedu raising money this year? Would you buy a public offering from a nonprofit company?
Now look at the 15% recovery today and think about this perspective: a temporary recovery in share prices after a substantial fall, caused by speculators buying in order to cover their positions is called a Dead Cat Bounce! :)
China's crackdown on for-profit education companies was a disaster for traders not using a stop loss.
In the 52 Week Range Gaotu Techedu Inc. went from 149 to 2.4usd
After-school tutoring institutions must transform themselves into "nonprofit organizations".
Jim Cramer (Mad Money) on China's tech crackdown: You can't own Chinese stocks!
ARK Invest dumps Chinese stocks.
It seems dangerous to hold Chinese stocks right now.
US-listed Chinese companies have three years to comply with US accounting oversight, to comply with the rules of accounting and transparency that American public companies must follow, if not they will get delisted.
This looks like the beginning of China`s stock market crash.
I`m looking forward to read your opinion about this!

TAL Education Dead Cat Bounce ?Think about this perspective: a temporary recovery in share prices after a substantial fall, caused by speculators buying in order to cover their positions. this is the Dead Cat Bounce!
China's crackdown on for-profit education companies was a disaster for traders not using a stop loss.
In the 52 Week Range TAL Education Group went from 90.96 to 4.03usd.
After-school tutoring institutions must transform themselves into "nonprofit organizations".
Jim Cramer (Mad Money) on China's tech crackdown: You can't own Chinese stocks!
ARK Invest dumps Chinese stocks.
It seems dangerous to hold Chinese stocks right now.
US-listed Chinese companies have three years to comply with US accounting oversight, to comply with the rules of accounting and transparency that American public companies must follow, if not they will get delisted.
This looks like the beginning of China`s stock market crash.
I`m looking forward to read your opinion about this!
