GBPUSD SELLS THU 19 MAY 2022 Seeling GBPUSD with my 1.18 ratial model
Expecting a sweep high before the bleed down
Expecting a bullish trend in dxy, giving more evidence to my setup
Sells

Gbpjpy $ell$ A peak performance trader is totally committed to being the best and doing whatever it takes to be the best. He feels totally responsible for whatever happens and thus can learn from mistakes. These people typically have a working business plan for trading because they treat trading as a business.

AUD/USD Sells I am looking to sell this pair should we break the previous candles lows
Daily and 30min momentum is to the downside, with the previous structural lows also being broken
targets will be set at the previous weekly lows

GBP/JPY SellsGBP/JPY has been bullish for some time now with high momentum pushes on all timeframes
there has been a recent correction and some support formations after a decent rally.
with no significant pullback in place since market open, I opted to take some sells should we break the previous candles lows come market open.
On this occasion, the market fell below the Pre-London candles and triggered my position.
Targets are ambitious but they are also in a significant structure zone on the H4 timeframe.
If the H4 timeframe is to see a decent reversal, I have this area in mind to be where it will find consolidation

GBP/USD SellsThis pair is displaying a bearish sentiment overall on the higher timeframes.
The H4 timeframe attempted to create new highs and left some rejection wicks, failing to break resistance.
The 30min timeframe displayed a clear push to the upside which is the only timeframe to create a solid bullish move
with this in mind, the more probable result is for the bearish sentiment to continue overall.
Targets are set at the most recent daily lows.

AUD/USD Sells Price has displayed a bearish sentiment and momentum for some time now. This analysis is based on a few technical factors:
- Weekly momentum to the downside is very high
- The previous daily lows have been breached
- Current price has retraced from support in order to achieve a discounted entry
Targets have been set at a significant support region and I intend to scale out and go breakeven to secure a risk free position. More importantly, this means I can get to sleep here in the UK lol.
Hopefully this analysis is useful regardless of the outcome!

expect a sell GBPCAD on the 15 minutes time frame. GBPCAD in tight range we expect a break above . which will quickly break below since its a down trend

AUDJPY OHLC (SELLS) MONTHLY STRUCTURE (MARCH 2022)AUDJPY OHLC (SELLS)
MONTHLY STRUCTURE
(MARCH 2022)
Please support this idea with LIKE if you find it useful..
Monthly Structure for AUDJPY is OHLC (SELLS).
A resistance will be formed the minute tdi Priceline and bloodline cross. Patience. Long term runner Tp must be set at the Daily Open 83.507 . Price is slowly getting into the sell pressure zone. Waiting on a tdi cross to confirm the presence of sellers in Markets.
Trade with Caution. Wait for valid entries.
Please support this idea with LIKE if you find it useful.
P A T I E N C E + D I S C I P L I N E

GBPUSD LONG TERM SELLGBPUSD - very bearish as well as the ichimoku cloud tells me its a red bearish kumo twist for sells

Possible +1,000 Pip drop ??Risk : Reward
1 : 38
________________
You'll never regret developing patience in trading.
________________
Trading does not reward your system.
It rewards your Mindset.
________________
Trade Safe ✅

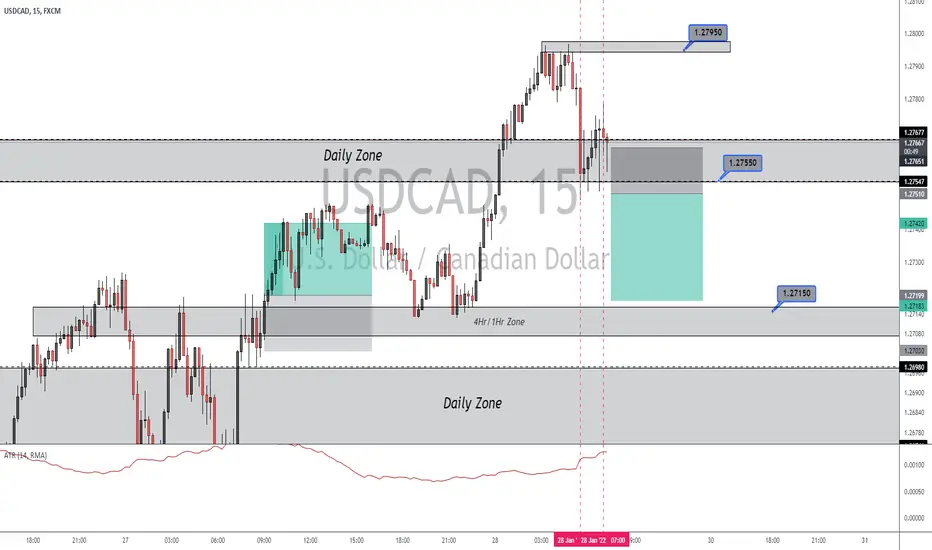
USDCAD Day Trade Idea // 15m TimeframeWe have Rejection from Daily Resistance that began during NY Open
This could just be liquidty for another Leg up in Trend Bullish.
However, I like Dollar weakness to finsh off the week.
This is a sell stop, SL about 14 Pips, same as 15m ATR
AUDUSD - DESCENDING PARALLEL CHANNEL
Good Afternoon People...
Today, I will be providing Technical Analysis for the AUDUSD
To begin I would like to provide a brief 'Top-Down' from the Monthly through to the H4
Although, being new to TradingView It is not possible for me to provide the necessary chart images for all the timeframes utilised.
Currently, I am only permitted to provide 1 chart image - Therefore, I will provide the Daily as I execute the majority of trades on this timeframe.
So, I am afraid you will have to use your imagination for the other timeframes - Unless you message me and I would be more than happy to provide :)
Now that's out the way - Lets get stuck in...
Looking at the Monthly Timeframe, I have marked out a Bearish Trendline - This connects the 2 highs
This particular Trendline is also respected on the Weekly Timeframe
Moving on to the Weekly - I have identified a Double-Top
What is quite compelling is that, this Double-Top met with the aforementioned Bearish Trendline and Horizontal Resistance
Now that's the type of confluence us traders are looking for right?
So, yeah - We have that, and the AUDUSD dropped in style - Printing Lower Lows/Highs for several weeks
Furthermore, we can see that price pushed through the 0.726 support zone and last week returned to the zone and rested with as Pin-Bar
With this bearish connotation in mind - I moved down to the Daily Timeframe and began to look for selling opportunities
Instantly, I identified a Descending Channel
Following this, I marked out additional S&R - identifying the confluence of the support @0.699
Price has recently bounced from this and began heading north
This being marked out as an Ascending Channel/Bear Flag - Which is also respected on the H4
Now this is where it becomes interesting and may I say exciting ....
For me - I have my eyes on the confluence of the multiple resistance at work @1.7316 [ Resistance of Horizontal Level, Descending Channel, Ascending Channel and not to forget the Weekly Pin ]
This is where I will be looking for short opportunities in the near future...
Alternatively - If price breaks down below the Ascending Channel/Bear Flag Support - I will still be looking for price to return to the confluence @1.7316 zone
Well that's about it for this one guys - I will be providing updates
And, if you need the Monthly, Weekly & H4 timeframe images - Let me know or just leave a comment for them and ill see what I can do
Thanks for tuning in - Its been a pleasure

XAUUSD Shorts I'm planning on shorting gold from this OB which was the source of the huge move down on the 5th of January. Got 1% risk on separated into two individual entries of .5% The levels marked are the open of the OB and a refined level within the OB which price could push up into for LQ and then reject off of. Time will tell!

GBPJPY OHLC (SELLS) MONTHLY STRUCTURE (Jan 2022)GBPJPY OHLC (SELLS) MONTHLY STRUCTURE
Please support this idea with LIKE if you find it useful.. Happy New Year..
Monthly Structure for GBPJPY in a Daily timeframe is OHLC (Open High Low Close) price setting up for monthly sells.
Current Priceline is also within the sell pressure zone. Patience, we currently waiting for a TDI cross. Priceline must cross below bloodline to confirm the presence of sellers in market.
Caution as this is the open of a new year hence price is bound to consolidate.
After the daily TDI cross plays out, switch to H4 and be on the lookout also for OHLC and a TDI cross to confirm sells before executing trades in M15.
Trade with Caution. Wait for valid entries.
Please support this idea with LIKE if you find it useful.
P A T I E N C E + D I S C I P L I N E

SELL EURUSDBeautiful setup for euro traders. Look out for spike to the upside when it touches 1.1340 we short some more. Good luck

Aud/Usd SellThis pair is bullish on the D1 but a BOS on H4
Entry in the FIb zone
1:3+ RR
Using SELL LIMIT

EUR/USD SellsEUR/USD is in a HTF downtrend. We had a massive sell off from 1.16850 with lows being reached of 1.15135. Drawing my Fib Retracement i am currently looking for a sell entry @ 1.16245- 1.16250 which aligns with the 0.618 fib. This area is also a massive rejection zone on multiple HTF's making it an area of interest for me. Price may drop before reaching this area but I only want perfect entries, 1.16150 may be a selloff zone... Trade Safe :)

Nzdjpy Sells 81.700 and 82.300nzdjpy: currently watching for sells here at two regions for me in nzdjpy at 81.700 followed by 82.300. Again, this does not mean to sell right away when price reaches to either of these two regions. Ideally, for price to reach up to my upper line at the 82.300 region for sells. Failure for price to come here then i would wait for further price action 👁

Eurchf Sells 1.07700eurchf: currently waiting for price to come up to my "line" here at the 1.07700 region and candle wick here before looking for sell opportunities. This does not mean to sell right away when price reaches here. Failure for price to reach here then i would wait for further price action 👁 2 simple lines for this analysis and trade setup for me personally and setup spotted and noted within 3 minutes. Reduce the confusion, complexity and know exactly* what and where you are looking for in the markets for entries. Thus, if price is not* valid at your region/zone...then it should be a trade avoided and not a trade taken...

Gbpchf Sells 1.27000gbpchf: watching for a spike and wick here to my yellow marked region at the 1.27000 before looking for sell opportunities here. Also where the 61.8 fib level is at. This does not mean to sell right away when price reaches here 👣 One thing to note with fib...fib is just an extra* confirmation for me and is not used in every* single trade setup. Know when to use it and apply it on the charts for a "projection" of the desired move and as an extra confirmation..

Audusd Sells 0.74400Currently waiting for price to reach up higher to the 0.74400 region here at my "line" before looking for sell opportunities here. Again, this does not mean to sell right away when price reaches here. Failure for price to reach here then i would wait for further price action

Eurjpy Sells 132.800eurjpy: updated with my analysis on Oct 11th..sell trade avoided here at the 131.000 region. Am now* watching for sells here at my "line" at the 132.800 👁 Note it is Friday, last day of the trading week and am still* waiting for price to align with my entry criteria before i do decide to take or avoid this trade setup here at the 132.800. Continue waiting, stay connected 🚶🏻♂️

