Will BTC continue its dump or it'll surprise everyoneHi dear community members, my lovely and loyal followers, I hope you are fine and make good trades.
I haven't published analyses for 2 months coz I expected #BTC to dump towards 26.5-27K as I mentioned in my tweets/ which you can check on my previous publications.
BTW I warned about this dump back on June 24th when BTC price was 31500/ almost at the top/ but I didn't expect that BTC will go below 26K in any case we haven't seen daily candle close below it)).
Now I'm looking at daily timeframe and as you see BTC cleared/swept all SSL and felt all imbalances below 28.5K, even it took out previous major swing low/EQL/ below 24.7K and hit daily bullish OB. If we measure the recent move from 31,850 to 24.7K it is below 100% projection of previous move from 31059 to 24.7K.
I'm sure BTC bottomed on August 18th at 24.5K and after some types of consolidation between 25-28K, which will last about 2-4 weeks, BTC will start its major impulse move towards 37-38K even higher. I marked upcoming move with pink line.
I also mentioned the most critical level on the chart /RED zone/, which has to be respected by bulls in the worst case to provide upcoming bullish movement otherwise game is over for bulls.
Sellsideliquidity

Market Makers Buy And Sell ModelThe market Makers' Buy and Sell Model is a strategy that reveals the market maker algorithm model for price delivery.
Basically, there are 3 things market makers' algorithms do with price in every trading session, day, week, and month
Those 3 things are; Accumulation, Manipulation, and Distribution.
AMD:
A: Accumulation
M: Manipulation
D: Distribution
1. Accumulation: They accumulate liquidity through the delivery of a ranging market.
The purpose of delivering a ranging market is to induce both buyers and sellers to enter the market thinking that price will go in their direction.
How to Identify a Ranging Market: You know price is in a ranging market when you see obvious relative equal highs and lows price range.
In a ranging market, price swing points have relatively equal highs and lows, that is, the price is neither delivering a higher high nor a higher low.
2. Manipulation: After accumulating both buy and sell orders, they then manipulate the market to further induce another set of traders which are breakout traders.
But, that particular manipulation move is not their intended direction for the day. They only use it to gather liquidity, Which will then lead them to the next action which is to move and distribute prices in their real direction for the day.
Usually, when price breaks out of a ranging market, the break-out is a manipulation to further induce a new set of traders to enter the market, further proving liquidity for market makers' real intended direction.
3. Distribution: After manipulating the price to a particular direction different from their plan, they then distribute the price to their original intended direction.
e.g to buy, they will first sell the market and then buy at the discount price level.
You know a price distribution through clean candles that left imbalances behind and then break market structure away from the previous manipulation move structure high or low to form a new structure.
Example of Market Makers Buy and Sell Model as described on the chart.
AMD:
A: Accumulation
M: Manipulation
D: Distribution
Accumulation: Price range for some time, accumulating liquidity on both sides of long and shorts.
Manipulation: Price broke the high of the accumulation to take out Buyside liquidity and then create a new higher high and higher low. But it's a manipulation move.
Distribution: Price moves away from the FVG leading to a shift in market structure, plus a short pullback, follow by a massive move to the downside to take out sell-side liquidity below.
Entry: Your entry should be inside the FVG created by price before the shift in market structure, you can set a limit order inside the fvg and place your stop loss at the high of the swing high created prior to the fvg and shift in market structure.
The same thing applies to a bullish market.
Basically, Marker makers push prices higher so they can sell the market at a premium, while they sell the market to lower prices so they can buy that market at very discount prices
This strategy can be used in any time frame and all markets including forex, crypto, stocks, future etc.
Follow me for more updates.
Feel free to ask me any questions in the comment.

SELL DOLLAR!!! Start of the Dollar downtrend. We seen dollar playing around in the bearish orderblock area for a while. After today we have an indication it will seek lower prices based on the 4h.

Gold Daily OutlookHey guys,
A technical outlook for the week ahead based on the Daily chart of Gold.
--------------------------------------------------------------------
Please, support my work with a like, thank you!

🛎🛎 EURGBP 1H PROJECTIONEURGBP has taken out The Sell side Liquidity and Then made Choch , And then created Eq Lows. Now we are Expecting the Marketing to take out those Eq lows and Enter the Zone where previously Manipulated and then Sharply Move upwards to Grab the Buy side Liquiidty

Bullish on Bitcoin sell-side liquidity cleared, it means that the existing supply of Bitcoin available for sale has been absorbed by buyers, and there is a potential for price appreciation due to increased demand and limited supply.

UJ Asian Session Model Example 3Hello Traders!
This is another great example of how I trade Asian Session

gbpusd expecting bullish gbpusd expecting bullish we are expecting market bullish from fvg area and judas swing is our high

gbpusd weekly forecastGBP USD weekly forecast are you ready for bullish wait for reversal we will loook bullish from fvg zone we will see confirmation in fvg zone

gold ready to big fly are you ready ?gold weekly time frame fvg is our interesting area we will look bullish after sell-side liquidity sweep .fvg zone is our interesting area we use confirmation in m30 wait for structure change


DAX SHORT (PAPER PRACTISE)Looked bearish after the middle green candle 10:15 couldn't push past the 9:00 open bear candle before the drawback (BSL) . The EMA's and the weakening of new highs gave me confluence that the internal SSL would be swept along with the 9:45 close SSL. Quick trade however should of waited for the imbalance to be filled ( double 1 m FVG) below the SSL and then close my positon to ensure that it is still a bullish market structure. Moved stop loss to 0 making it risk free after the 1m ticked past the first SSL. Entry and close marked at 11:45.

Probability for 07/01/23As you can see the following:
- weekly candle bullish
- daily candle bearish
- 4H candle - bearish
In my probability, I can see two options on Monday (I WON'T BE PLACING TRADES ON MONDAY). One will bounce off (red) and create a high of the day and two (blue) will go lower to take out sellside liquidity creating a low of the day and then will go up to create a high of the day.
After Monday I'll see where price action will go and what will most likely stay for the next two days which means I'll be looking for setups on Tue, Wed, and Thu.
Please let me know your thoughts.

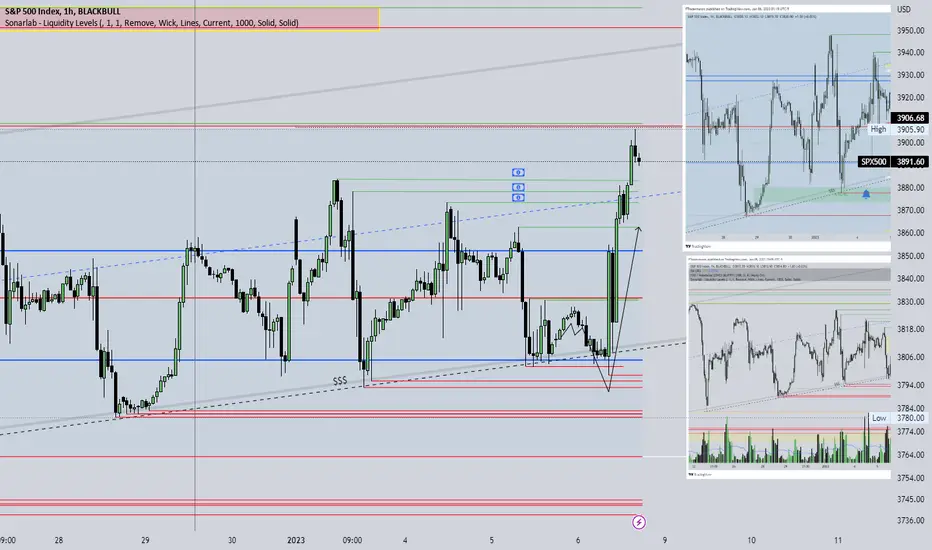
1/6/2023 SPXBig move today!
First taking EQL liquidity and then deliver price through buy side liquidity.
How did I know it will happen if I don't know what macroeconomic numbers we will get?
Liquidity is the answer.
If there are more retail traders in bullish positions, market makers will move price down.
If there are more retail traders in bearish positions, market makers will move price up.
This works regardless of the market you are trading, the news that is, or the data that is presented.
News, the economic calendar and earnings report are just volatility to take sell side and buy side liquidity.
So the next time you are questioning yourself why the price went down, when GDP numbers went up, the answer will be just liquidity.
Question yourself of what you have been taught of technical analysis is really what it works, if that "double top" or "geometric bullish figure" will work if 95% of traders are looking the same thing.
Probability for 22/12/22 After nice drop in GBP/JPY and makink 40% I'm wondering if that was more to do with luck or my analisis. I did predict price will go down and I saw the build up, I wasn't expecting it will take that long and funny enough I wasn't aware of BOJ intrest rates news.
However I got two posibilities, up or down ( like alwas). Main Sellside liquidity was taken out and I see another build up but there is another sellside liquidity and massive FVG which was created during BOJ Intrest Rate News. I'm more towards going up but this is what Smart money wants you to think about it.
Please share your thoughts.

Probability for 14/12/22 So far so good, the price reached Buyside LIquidity, and then during 8.30 News NY time, we had a massive sell-off to first Sellside Liquidity.
I believe the price will retrace to 50% on Fib and then continue to another Sellside Liquidity. But just in case anyone wants to trade that than please make sure you have your Stop Loss in place.
Please share your thoughts.

Probability for 12/12/22 No trades for me today. I'm waiting for what will happen. I need HH or LL to be formed above Sun or Mon opening candle .
Weekly candle - Bullish
Daily candle - Bullish
Common sense tells us to look for longs but if the price reaches Buyside liquidity then We can look for shorts.
What are your thoughts?

Probability for 05/12/22 I think the overall price will target Buyside Liquidity and then drop down to Sellside Liquidity but also I strongly belive that price will try to reach an Imbalance (4h TF)which is below Sellside liquidity.
During London Kill Zone I'll keep my eyes on setup to go Long and once price action reach Buyside Liquidity I'll be looking to go Short and exit at second Sellside LIquidity.
Please share your thoughts.

Analysis, Set Up and Taking Trade Part 1This Is part 1 on Market Analysis, Waiting for set up and taking trades.
Hope this help.

Trading with Children.I think this is one of the most distracting thing while you trade.
If you are in the "zone" and there is a dog, child or your spouse around it is very difficult to focus on your trades.
I did 5 trades altogether.
Initially, I end up with a 6.5% profit but due to continuous trading, I end up with a 2% profit.
Let's keep going.

Probability for 30/11/22 I got two ideas but also there is a third one. The price might go to consolidation today and If nothing happens during London Kill Zone I might change the pair and look for setups.

Long DayThis has been one of the longest days.
I took two trades, the first at a loss of about -3.5% and the second 3 x 3.5% win.

Probability for 29/11/22 Yesterday my prediction was correct however I did come out of the trade at 3% instead of 7%.
Today to me price will continue to go south.
