GBPUSD consolidates resistance zone and declinesPlan GBPUSD day: 16 June 2025
Related Information: !!!
The Pound Sterling (GBP) ticks up to near 1.3590 against the US Dollar (USD) so far on Monday, remaining inside Friday’s trading range. The GBP/USD pair is expected to keep trading within a tight range as investors have sidelined ahead of monetary policy announcements by the Federal Reserve (Fed) and the Bank of England (BoE), due on Wednesday and Thursday, respectively.
At the start of the week, the US Dollar Index (DXY), which tracks the Greenback’s value against six major currencies, edges down to near 98.00.
Investors will closely monitor the interest rate guidance from both central banks, while they are expected to leave those unchanged at their current levels
personal opinion:!!!
At the beginning of the week, there was not much important news. GBPUSD price was sideways and reacted to resistance and support zones.
Important price zone to consider :
SELL point: zone 1.35950
Sustainable trading to beat the market
Sellsignal

EURUSD BermundaHi guys, this is EURUSD short idea for make some pips...
I hope it will be interesting.

Testing Upper Channel Line || Eyes on 1.16 and Previous High📌 EURUSD 4H – Testing Upper Channel | Eyes on 1.1600-1.1666
🕓 June 12, 2025
👤 By: MJTrading
🔍 Technical Overview:
EURUSD continues its upward trajectory within a clean ascending channel, respecting both dynamic structure and EMA support zones. We're now retesting a key confluence area:
==============================================================
🔻 Bearish Setup Idea:
Entry Zone: 1.1570–1.1600
Stop Loss: Above 1.16666 (round number & psychological resistance)
Target: Channel midline (~1.1450) or lower band (~1.1380)
🧠 Why This Zone Matters:
🔺 Previous Swing Highs: Price is revisiting the April peak zone (~1.1570)
🧱 Round Number Confluence: 1.1600 & 1.1666
📉 Rising Channel Resistance: Upper boundary hit after extended leg
🔄 Potential Mean Reversion: EMAs are lagging behind price
⚠️ Invalidation:
A clean break and close above 1.1700 with follow-through may invalidate short bias and signal continuation toward 1.1800+
💬 Patience is power. Let the levels do the talking.
📎 #EURUSD #ForexAnalysis #TechnicalTrading #SmartMoney #PriceAction #RoundNumberLevels #MJTRADING

Adjusted down 3385 at the beginning of the week⭐️GOLDEN INFORMATION:
Gold prices (XAU/USD) climbed toward $3,445 during the early Asian session on Monday, marking their highest level in over a month as mounting tensions in the Middle East and growing expectations of a Federal Reserve rate cut bolstered demand for safe-haven assets.
Despite stronger-than-expected US economic data on Friday, investors remained focused on geopolitical risks. The University of Michigan’s Consumer Sentiment Index for June jumped to 60.5, well above the consensus forecast of 53.5 and May’s reading of 52.2. However, markets largely shrugged off the data.
Instead, attention turned to the escalating conflict in the Middle East, where Israel’s recent strike on Iran has intensified fears of broader regional instability. In response, Iranian authorities warned they would “respond firmly to any adventurism,” reinforcing gold’s appeal amid global uncertainty.
⭐️Personal comments NOVA:
At the beginning of the week, gold prices adjusted slightly down, returning to the liquidity zone of 3385, before continuing the uptrend.
⭐️SET UP GOLD PRICE:
🔥SELL GOLD zone: 3462- 3464 SL 3469
TP1: $3450
TP2: $3440
TP3: $3430
🔥BUY GOLD zone: $3390-$3388 SL $3383
TP1: $3400
TP2: $3410
TP3: $3422
⭐️Technical analysis:
Based on technical indicators EMA 34, EMA89 and support resistance areas to set up a reasonable SELL order.
⭐️NOTE:
Note: Nova wishes traders to manage their capital well
- take the number of lots that match your capital
- Takeprofit equal to 4-6% of capital account
- Stoplose equal to 2-3% of capital account

AUDJPY SHORT FORECAST Q2 W25 D16 Y25AUDJPY SHORT FORECAST Q2 W25 D16 Y25
Professional Risk Managers👋
Welcome back to another FRGNT chart update📈
Diving into some Forex setups using predominantly higher time frame order blocks alongside confirmation breaks of structure.
Let’s see what price action is telling us today! 👀
💡Here are some trade confluences📝
✅Weekly Order block rejection
✅15' Order block
✅Daily order block identified
🔑 Remember, to participate in trading comes always with a degree of risk, therefore as professional risk managers it remains vital that we stick to our risk management plan as well as our trading strategies.
📈The rest, we leave to the balance of probabilities.
💡Fail to plan. Plan to fail.
🏆It has always been that simple.
❤️Good luck with your trading journey, I shall see you at the very top.
🎯Trade consistent, FRGNT X

SHOT ON EUR/USDEUR/USD Has given us a nice double top at a major resistance level.
Since then it has broken the neckline of that double bottom, creating a new low, engineering liquidity, sweeping it and now getting ready to tap into supply before it should fall.
The Dxy is also getting ready to rise from a demand level so this should also aid in pushing EU down.
Looking to catch over 200 pips.

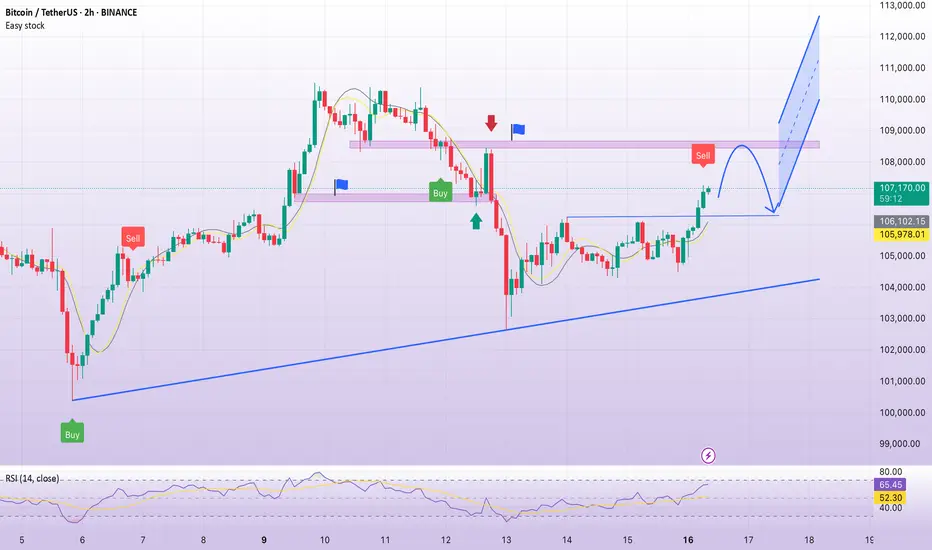
BTC accumulates, back to 108,500Plan BTC today: 16 June 2025
Related Information:
The price of gold is nearing its all-time high as tensions in the Middle East escalate, but analysts say they’re doubtful Bitcoin will do the same as investors prioritize other safe-haven assets.
The price of gold rose to $3,450 per ounce on Monday, just $50 shy of its all-time high of just below $3,500 in April, according to TradingView.
The usually slow-to-move asset has gained a whopping 30% since the beginning of the year, catalyzed by US President Donald Trump’s trade tariffs and, more recently, an escalation of military action in the Middle East following an Israeli missile strike on Iran on June 13, which caused Bitcoin prices to fall.
Gold prices have also been linked with inflationary pressures, as it is considered a safe haven and an inflation hedge by investors.
personal opinion:
The crypto market recovered at the beginning of the week after being affected by war news. It will almost certainly continue to maintain the 4.5% interest rate, so it will be difficult to break ATH this week.
Important price zone to consider :
Sell point: zone 108.400 - 108.600 SL : 109.100
Take profit : 107.900 - 107.000 - 106.000
Sustainable trading to beat the market
Why CSX Corporation CSX Could Reach $37.50 by the End of 2025If you haven`t bought CSX ahead of the previous earnings:
Now CSX Corporation CSX, a leading North American rail freight operator, is positioned for a meaningful upside in 2025, with a realistic price target of $37.50. This target is supported not only by strong fundamentals and industry tailwinds but also by recent options market activity showing significant call option interest at the $37 strike price, indicating growing investor conviction around this level.
1. Strong Options Market Signals at $37.50
Recent options data reveals a notable concentration of call open interest and volume at the $37 strike price in the CSX options chain, especially for near- and mid-term expirations.
This elevated activity suggests that institutional and retail investors are positioning for a rally toward $37–$38, reflecting confidence that the stock will surpass $35 and approach $37.50 by year-end.
The options market’s pricing and demand at this level provide a real-time, market-driven validation of the $37.50 target, adding weight to the fundamental bullish case.
2. Analyst Price Targets and Upward Revisions Support $37.50+
Several analysts have price targets ranging from $35 up to $38–$39, with recent upward revisions reflecting improving operational metrics and resilient demand.
Bank of America and Goldman Sachs, among others, have raised targets closer to or above $35, and the options market activity suggests investors expect further upside beyond these levels.
3. Operational Improvements and Network Optimization
CSX continues to address past network challenges, improving service reliability and operational efficiency, which are expected to drive volume growth in key sectors such as agriculture, minerals, and intermodal freight.
These improvements are critical for margin expansion and revenue growth, underpinning the stock’s appreciation potential.
4. Favorable Macroeconomic and Industry Tailwinds
The resilient U.S. economy and ongoing federal infrastructure investments support sustained freight demand.
Rail’s environmental advantages and cost efficiency over trucking position CSX to capture increased market share as companies seek sustainable logistics solutions.
5. Financial Strength and Shareholder Returns
CSX boasts strong free cash flow generation, enabling consistent dividend growth and share repurchases.
The company’s valuation remains attractive relative to peers, with a P/E around 15.5 and a dividend yield near 1.4%, making it appealing for both growth and income investors.
6. Technical Support and Market Sentiment
The stock has held solid support near $30–$31 and is trading near $34.60 as of mid-June 2025, showing resilience amid market volatility.
Positive sentiment from institutional investors and steady trading volumes reinforce the potential for a breakout toward $37.50.
Disclosure: I am part of Trade Nation's Influencer program and receive a monthly fee for using their TradingView charts in my analysis.

AUDJPY SHORT FORECAST Q2 W24 D13 Y25AUDJPY SHORT FORECAST Q2 W24 D13 Y25
Professional Risk Managers👋
Welcome back to another FRGNT chart update📈
Diving into some Forex setups using predominantly higher time frame order blocks alongside confirmation breaks of structure.
Let’s see what price action is telling us today! 👀
💡Here are some trade confluences📝
✅Weekly Order block rejection
✅15' Order block
✅1H 50EMA
✅Daily order block identified
🔑 Remember, to participate in trading comes always with a degree of risk, therefore as professional risk managers it remains vital that we stick to our risk management plan as well as our trading strategies.
📈The rest, we leave to the balance of probabilities.
💡Fail to plan. Plan to fail.
🏆It has always been that simple.
❤️Good luck with your trading journey, I shall see you at the very top.
🎯Trade consistent, FRGNT X

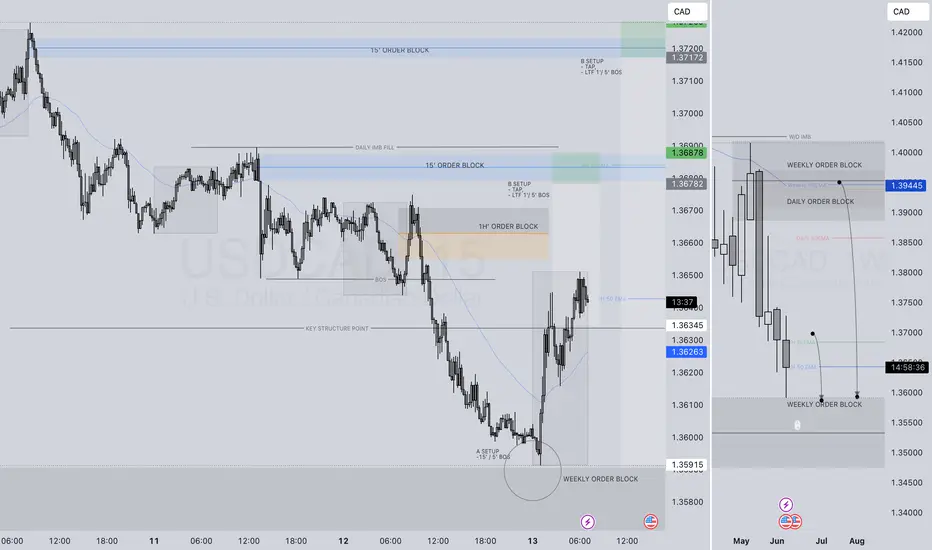
USDCAD SHORT FORECAST Q2 W24 D13 Y25USDCAD SHORT FORECAST Q2 W24 D13 Y25
Professional Risk Managers👋
Welcome back to another FRGNT chart update📈
Diving into some Forex setups using predominantly higher time frame order blocks alongside confirmation breaks of structure.
💡Here are some trade confluences📝
✅1H order block
✅HTF 50 EMA
✅Intraday bearish breaks of structure to be identified
✅15’ order block identified
🔑 Remember, to participate in trading comes always with a degree of risk, therefore as professional risk managers it remains vital that we stick to our risk management plan as well as our trading strategies.
📈The rest, we leave to the balance of probabilities.
💡Fail to plan. Plan to fail.
🏆It has always been that simple.
❤️Good luck with your trading journey, I shall see you at the very top.
🎯Trade consistent, FRGNT X
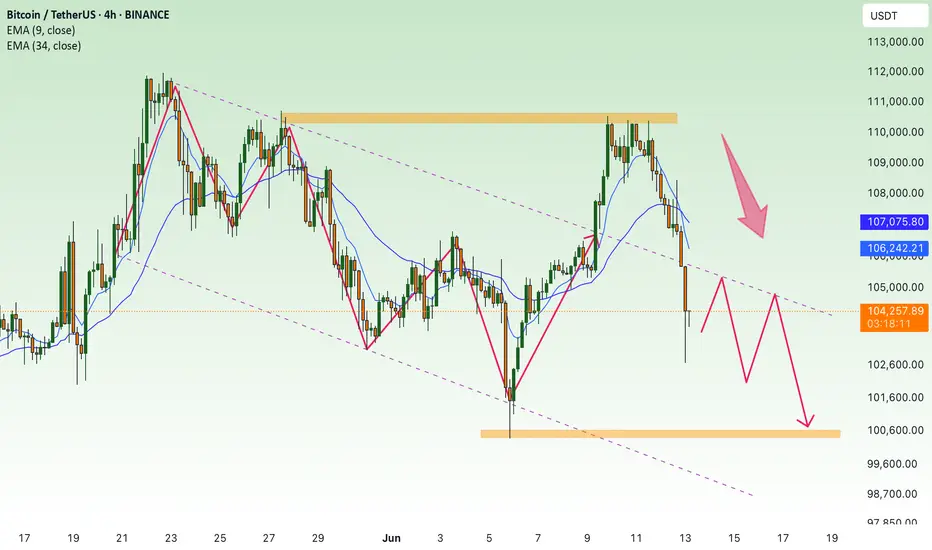
BTC Short-term selling pressure due to war news💎 BTC PLAN UPDATE (June 13)
NOTABLE NEWS ABOUT BTC:
Prices of Bitcoin (BTC), Ethereum (ETH), and Ripple (XRP) slipped as rising geopolitical tensions between Israel and Iran sparked a wave of risk aversion across crypto markets. As uncertainty deepens, the three largest cryptocurrencies by market capitalization are on track to close the week in the red, with current price action signaling the potential for a deeper correction.
Bitcoin bears regain control
After failing to reclaim its all-time high of $111,980 earlier in the week, Bitcoin lost upward momentum and began a steady pullback, slipping below key support at $106,406 on Thursday. As of Friday, BTC continues its downward trajectory, hovering near the 50-day Exponential Moving Average (EMA) at $102,447.
TECHNICAL ANALYSIS PERSPECTIVE:
We successfully identified the peak at the 110K resistance level. As predicted, BTC dropped $7,000 following disappointing CPI and PPI reports. Currently, the price has fallen back into a descending channel pattern and is expected to decline further.
Bitcoin’s upward trend is under threat as funding rates become more constrained.
Earlier this week, Bitcoin hovered near its all-time high of $111,980, but market sentiment remained alarmingly cautious—likely due to uncertainty in the macroeconomic environment.
The path of least resistance is gradually shifting downward, especially as the Relative Strength Index (RSI) falls to the midline at 50 from a recent high of 64 on the daily chart. Traders will look for bearish confirmation signals from the Moving Average Convergence Divergence (MACD) indicator—signaled when the blue MACD line crosses below the red signal line.
Watch for long positions around the 100K price area, with a target back to 103K. If the price breaks below the 100K support level, we should avoid holding onto a bullish bias.
At this time, whether you’re a newcomer or experienced trader, it’s advisable to spend time practicing and reinforcing technical analysis knowledge. Explore educational posts on the channel to build a stronger foundation and avoid potential losses.
==> This analysis is for reference only. Wishing all investors successful trades!
BEST XAUUSD M30 BUY SETUP FOR TODAYGold (XAU/USD) is showcasing strong bullish momentum after breaking above the key resistance zone near $3,404, now acting as fresh support. 🔄 The price formed a bullish structure with clean higher highs and higher lows on the 30-minute chart, confirming buying strength. 🟣 The marked demand zone around $3,392–$3,404 is critical—if price retests and holds this level, we can expect a continuation toward $3,420 and beyond. 🚀📌 Traders should watch for bullish confirmations on pullbacks to this zone for potential long setups. 🧠⚡

SHORT ON EUR/JPYOn the 1 min Timeframe EJ has given us a choc (change of character) to the downside with a nice break and retest to a major supply area.
The JPY index is bullish which should cause EJ to fall.
I will be selling EJ to the next level of demand looking to catch 100-200 pips.

BEST XAUUSD M30 BUY SETUP FOR TODAYPrice is showing signs of bullish strength after reclaiming key demand zones near 3,310.926–3,315.098 🟦. The recent CHoCH (Change of Character) and strong bullish reaction from the demand block suggests a potential move toward the 3,360 resistance area 🔼. Buyers are likely stepping in with momentum, aiming for a break above previous highs 📉➡️📈. As long as price stays above the 3,315 support, the bullish scenario remains valid — watch for continuation toward higher highs. 🚀💹

CPI, US inflation, gold price waiting to decrease⭐️GOLDEN INFORMATION:
Gold (XAU/USD) drew fresh bids in Wednesday’s Asian trading, reclaiming the $3,340 level and edging back toward this week’s high. A U.S. federal appeals court decision allowing President Donald Trump’s broad tariffs to remain in force—for now—added a fresh layer of trade uncertainty and stoked safe-haven demand. Heightened geopolitical tensions and growing expectations that the Federal Reserve will cut rates in September further bolstered the non-yielding metal. Even so, optimism surrounding ongoing U.S.–China talks has lifted broader risk sentiment, while a mildly stronger U.S. Dollar is helping keep gold’s upside in check.
⭐️Personal comments NOVA:
Gold price recovered, buying power increased gradually in Asian session, approaching resistance zone 3348
⭐️SET UP GOLD PRICE:
🔥SELL GOLD zone : 3373- 3375 SL 3380
TP1: $3360
TP2: $3350
TP3: $3340
🔥BUY GOLD zone: $3278- $3280 SL $3273
TP1: $3290
TP2: $3300
TP3: $3314
⭐️Technical analysis:
Based on technical indicators EMA 34, EMA89 and support resistance areas to set up a reasonable sell order.
⭐️NOTE:
Note: Nova wishes traders to manage their capital well
- take the number of lots that match your capital
- Takeprofit equal to 4-6% of capital account
- Stoplose equal to 2-3% of capital account

Selling pressure, bears active⭐️GOLDEN INFORMATION:
Gold prices (XAU/USD) edge higher toward $3,325 during the early Asian session on Tuesday, supported by a softer US Dollar as markets turn cautious ahead of key developments in US-China trade negotiations.
Delegations from the United States and China are set to continue discussions for a second consecutive day in London. President Donald Trump expressed optimism, stating the talks “should go very well.” According to US officials, discussions may lead to Washington lifting certain tech export restrictions in exchange for Beijing easing controls on rare earth exports — materials vital to sectors ranging from energy and defense to advanced technology. The outcome of these negotiations could provide fresh direction for the precious metal.
⭐️Personal comments NOVA:
The market is mainly sideways and accumulating, under selling pressure below 3300 due to the US-China trade negotiations taking place today.
⭐️SET UP GOLD PRICE:
🔥SELL GOLD zone : 3350- 3352 SL 3357
TP1: $3340
TP2: $3330
TP3: $3320
🔥BUY GOLD zone: $3276- $3274 SL $3269
TP1: $3285
TP2: $3300
TP3: $3312
⭐️Technical analysis:
Based on technical indicators EMA 34, EMA89 and support resistance areas to set up a reasonable sell order.
⭐️NOTE:
Note: Nova wishes traders to manage their capital well
- take the number of lots that match your capital
- Takeprofit equal to 4-6% of capital account
- Stoplose equal to 2-3% of capital account
SHORT ON NZD/JPYNZD/JPY has given us a CHOC (change or character) to the downside breaking a previous low.
I will be looking for NZD/JPY to retouch the supply area before dropping.
Aiming for 100-200 pips easy!

BTC Returns to Highest ATH💎 Update Plan BTC (June 10)
BlackRock’s spot Bitcoin ETF has made history, becoming the fastest-growing exchange-traded fund (ETF) ever by surpassing $70 billion in assets under management (AUM).
The iShares Bitcoin Trust (IBIT), launched in January 2024, has achieved this milestone in record time, reflecting surging demand for Bitcoin exposure through regulated, mainstream investment vehicles. IBIT’s exceptional growth trajectory has outpaced all previous ETFs, eclipsing even established funds like the SPDR Gold Shares (GLD) in terms of asset accumulation speed.
The ETF recently returned to net inflows — posting a $274 million single-day increase — following a brief period of outflows during a broader market pullback. This rebound signals renewed investor confidence, with capital flowing in from both institutional players and retail investors alike, underscoring Bitcoin’s growing role in diversified portfolios.
Technical analysis angle
Congratulations to investors when the Plan transaction has detected the bottom of 100k and is currently the highest at 110.5k. It is a prosperous signal for investors who are holding this power currency
Another good news is that the organizers have breaked out of the decrease price channel to confirm the trend of increasing and confidence in the price increase continues to be enhanced by the Buyer.
Currently, the BTC price area is slowed by the resistance level with Fibo 0.786 around the 110k price area. We expect the adjustment of the investors to collect goods before the price area goes further around 111.5k even 115k
At this time, whether new or old, should spend more time to practice, load more knowledge about the PTKT, as well as find knowledge posts at the channel ..., to strengthen the solid foundation, as well as avoid losing money at this time offline
==> Comments for trend reference. Wishing investors successfully trading

SHORT ON GBP/USDGBP/USD has just broken a uptrend line and has given us a nice break and retest to that same trendline.
The bearish have shown up and the dollar is currently looking bullish
I will be selling GBP/USD to the next level of demand for 50-80 pips

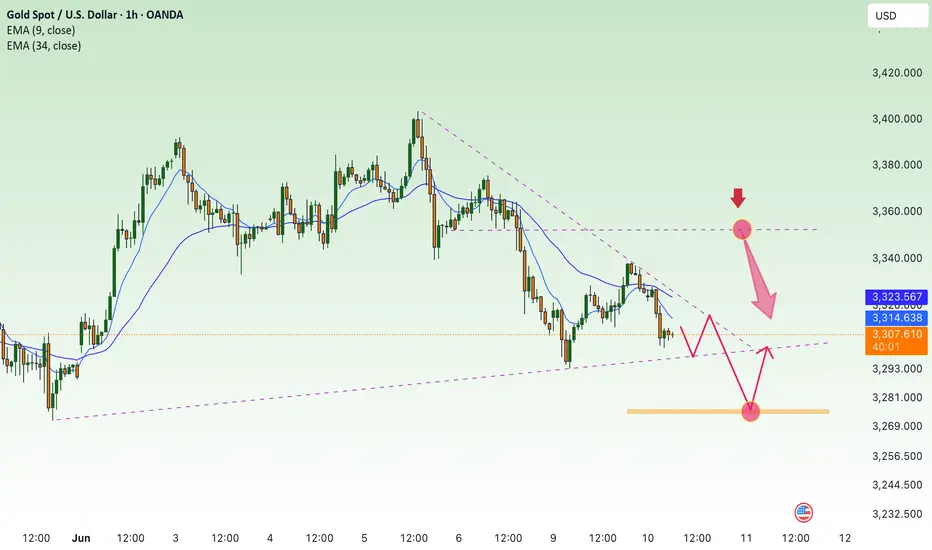
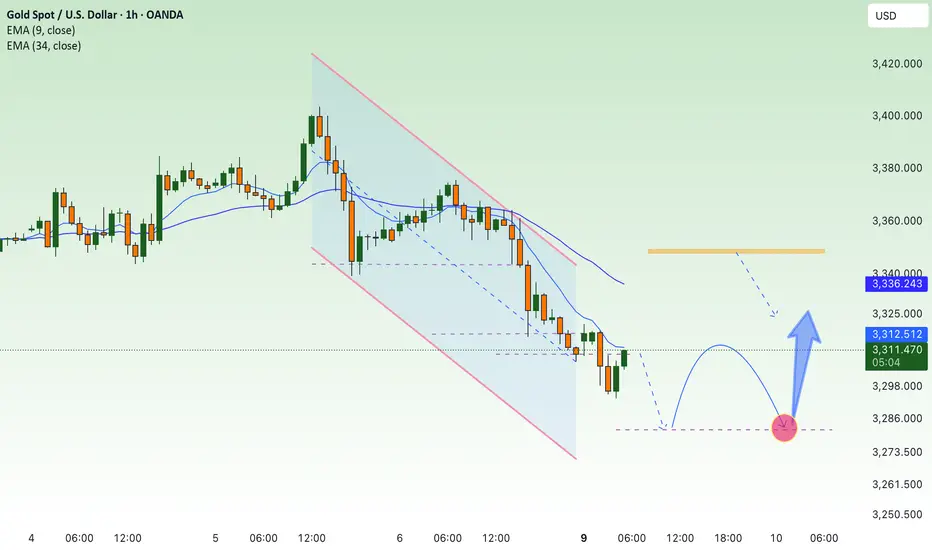
Gold price recovers, accumulates new week⭐️GOLDEN INFORMATION:
Gold prices (XAU/USD) hold steady near $3,310 during the early Asian trading hours on Monday, with the precious metal struggling to gain traction amid renewed strength in the US Dollar (USD). While a firmer Greenback poses headwinds for gold, lingering uncertainty surrounding President Donald Trump’s tariff strategy continues to offer some support.
On Friday, upbeat labor market data bolstered the dollar, pressuring dollar-denominated assets like gold. The US Bureau of Labor Statistics (BLS) reported that Nonfarm Payrolls rose by 139,000 in May, outpacing expectations of 130,000 and surpassing the previous month's downwardly revised figure of 147,000 (from 177,000). The stronger-than-expected jobs report has dampened hopes of near-term Fed rate cuts, weighing on bullion’s appeal.
⭐️Personal comments NOVA:
Gold price takes liquidity 3294, below 3300 GAP zone last week. Accumulate and react at lower support zones
⭐️SET UP GOLD PRICE:
🔥SELL GOLD zone : 3348- 3350 SL 3355
TP1: $3340
TP2: $3330
TP3: $3320
🔥BUY GOLD zone: $3281- $3279 SL $3274
TP1: $3292
TP2: $3300
TP3: $3315
⭐️Technical analysis:
Based on technical indicators EMA 34, EMA89 and support resistance areas to set up a reasonable sell order.
⭐️NOTE:
Note: Nova wishes traders to manage their capital well
- take the number of lots that match your capital
- Takeprofit equal to 4-6% of capital account
- Stoplose equal to 2-3% of capital account
SHORT ON ETHEREUM ETH/USDEthereum has created a lower high after a triple top and is currently looking very bearish.
Huge imbalance to the downside to be filled.
I will be selling eth to the next demand level looking to catch over 500-600 points.

Bitcoin Short to 97 K into cpi numbersIn this video I cover the recent drop and what might be a great short on the horizon . With the V shape recovery off the defended 100K level I anticipate that we continue the move up to 107/108K before hitting some resistance and pushing us back into the range leading into the midweek . With cpi news release this could be the catalyst needed to trap the late buyers and drop us into 96K zone .
This video provides context and theory for this short setup so I encourage you to watch .
Tools used Vwap , volume profile , Fibonacci pulls .
Thanks for watching
Any questions please leave in the comments
Safe trading

SHORT ON US30US30 Has given us a change of character to the downside with a nice retest creating a lower high.
I will be selling us30 to the next demand zone looking to catch 500-1000 points.
