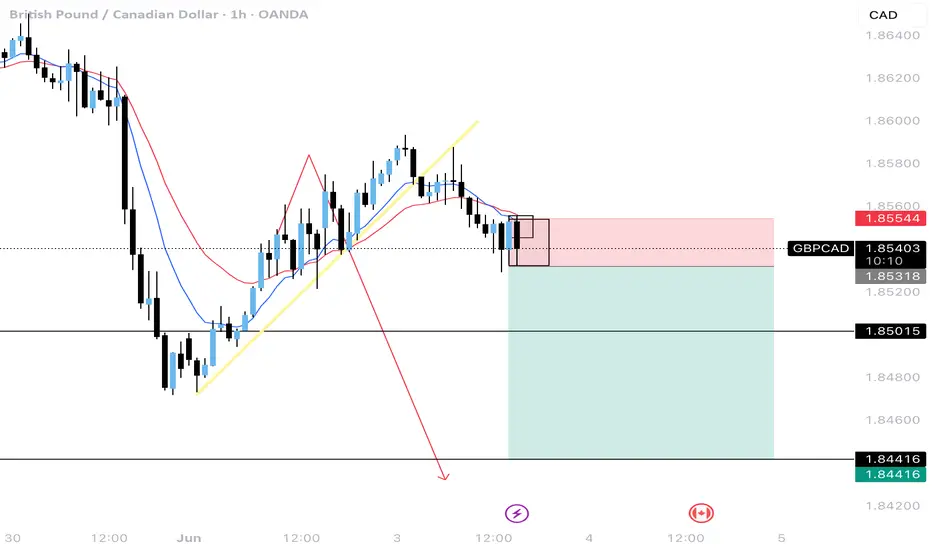
GBPCAD SELL OPPORTUNITY 5 MIN TIMEFRAMEClear trend breakout and retest has occured. Targetting for it to hit the large imbalance on the left before going down which it did. Targetting imbalances on 5 min tf. the 30 min and 4 hr 10 and 20 EMA on downtrend too
Sellsignal
SHORT ON EUR/USDEUR/USD has just swept a previous high and has plenty of liquidity to the downside to capture.
I will be selling EU to the next swing low looking to catch 80-100 pips.

BTC short term correction: zone 100k💎 BTC PLAN UPDATE (June 2)
NOTABLE NEWS ABOUT BTC:
Meta shareholders have decisively voted down a proposal to explore adding Bitcoin to the company’s balance sheet, signaling limited appetite for crypto exposure at the tech giant.
According to a regulatory filing dated May 28, the “Bitcoin treasury assessment” proposal garnered just 3.92 million votes in favor — representing a mere 0.08% of total shares — while nearly 5 billion votes against it.
Given that CEO Mark Zuckerberg holds 61% of Meta's voting power, as disclosed in an April filing, it is likely he played a pivotal role in rejecting the measure.
TECHNICAL ANALYSIS PERSPECTIVE
Bitcoin closed below the daily support level of $106,406 on Thursday and fell another 1.50% the following day. However, prices saw a slight recovery over the weekend. As of Monday's writing, BTC is trading below $105,500.
Assuming BTC faces resistance around the $106,406 daily level and continues correcting, it could extend the decline to retest the psychologically important $100,000 mark.
The Relative Strength Index (RSI) on the daily chart is at 53, trending down toward the neutral level of 50, indicating weakening bullish momentum. The Moving Average Convergence Divergence (MACD) also showed a bearish crossover last week. The increasing red histogram bars below the baseline further signal a potential correction ahead.
At this point, whether you are new or experienced, it’s advised to spend more time practicing and enhancing your knowledge of technical analysis. Consider exploring educational posts on the channel (…) to strengthen your foundation and avoid losses during this period.
==> This is a trend-based analysis for reference only. Wishing all investors successful trades!

BTC Trendline Breakdown? Bearish Setup Brewing!📉 #Bitcoin has recently broken its key trendline after making a new All-Time High (ATH). This could be the first major sign of a trend reversal. Here’s what we’re seeing:
🔹 Trendline Broken: The uptrend has been broken — a significant technical signal.
🔹 Retesting the Break: Price is currently retesting the broken trendline, a classic move before continuation.
🔹 Triple Touch Confirmation: The trendline was respected with 3 clear touches during the uptrend — increasing the validity of this break.
🔹 Support Still Holding: We’re watching a major support level below — a break here would confirm bearish momentum.
🚨 Strategy Plan:
If the support level breaks and #BTC retests it as resistance, we’re planning a short position with strict risk management. Patience is key — wait for confirmation before entering!
🛡️ Risk Management First. Always.
Don't rush into a trade — wait for a clean breakdown and retest for a high-probability entry.
📊 What do you think? Is #BTC ready to reverse, or will the bulls defend the trend?
👇 Drop your thoughts in the comments.
❤️ Like this idea if it helped you.
✅ Follow for more #BTC setups and real-time updates!
#BTCUSD #Bitcoin #CryptoTrading #TrendlineBreak #ShortSetup #TechnicalAnalysis #BearishReversal #PriceAction #TradingStrategy

NASDAQ Meltdown Incoming? The Calm Before the Crash…🚨 Get ready! The NASDAQ is about to take us on a wild plunge straight to the depths of market hell... 💥🔥
Yes, yes, I know—they’ll say it’s all "because of this" or "due to that," the usual play-acting we’ve seen a hundred times before. Just another scene in the never-ending economic theater. 🎭
But here’s the forecast for tomorrow’s news:
📉 United States Initial Jobless Claims – possibly lower than expected?
📈 United States GDP Growth Rate QoQ – higher than expected?
And then... yada yada yada. You know the rest.
What does that mean? A chain reaction in risk-on assets — stocks, indexes, crypto — all heading for a steep drop. 💣📉
If you’re still a believer, here’s your solid proof — laid out 24 hours before it happens. Don’t say we didn’t warn you.
The choice is yours:
💊 Red pill or blue pill?

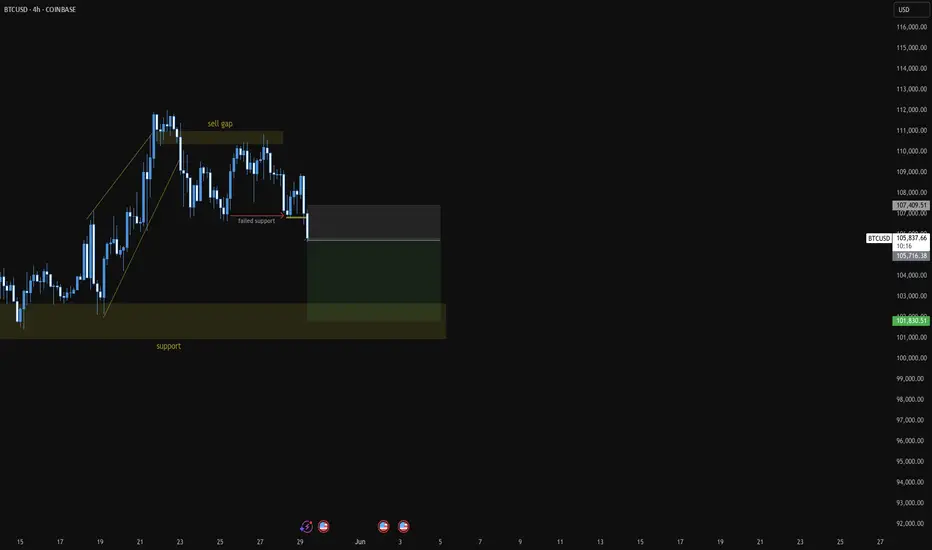
Sell to Bull supportbear pressure is established after the break of TL of the wedge channel. Followed by a strong bear BO that lead to a sell gap. Possible PB after current market made new low.
Selling pressure, gold price falls below 3300⭐️GOLDEN INFORMATION:
Gold prices continued to retreat during Wednesday’s North American session, slipping below the $3,300 mark after reaching an intraday high of $3,325 earlier. The pullback, amounting to a 0.27% decline, came as traders absorbed the implications of the latest Federal Reserve (Fed) meeting minutes.
During the May 6–7 policy meeting, the Fed opted to leave interest rates unchanged, highlighting growing uncertainty surrounding the economic impact of proposed tariffs. Officials maintained a cautious stance, citing heightened risks of both inflation and unemployment—potential consequences of trade disruptions.
The minutes also reflected concerns over stagflation, with policymakers noting that “the Committee may face challenging trade-offs if inflation proves more persistent while growth and employment expectations deteriorate.”
⭐️Personal comments NOVA:
The downtrend line remains intact, gold prices are trading around below 3300. The tariff backdrop remains largely unchanged.
⭐️SET UP GOLD PRICE:
🔥SELL GOLD zone : 3311- 3313 SL 3318
TP1: $3300
TP2: $3290
TP3: $3280
🔥BUY GOLD zone: $3205- $3207 SL $3200
TP1: $3218
TP2: $3230
TP3: $3248
⭐️Technical analysis:
Based on technical indicators EMA 34, EMA89 and support resistance areas to set up a reasonable SELL order.
⭐️NOTE:
Note: Nova wishes traders to manage their capital well
- take the number of lots that match your capital
- Takeprofit equal to 4-6% of capital account
- Stoplose equal to 2-3% of capital account

SHORT ON EUR/USDEUR/USD has pulled back to a major supply zone that previously formed a DOUBLE TOP in that area in the past. (This is technically the re-test)
I have placed a sell limit order in the supply area and I will be expecting EUR/USD to fall past the swing low for over 100 -150 pips.

BTCUSD UPDATE 29 5 2025This chart is a 30-minute candlestick chart for Bitcoin/USDT (BTC/USDT) on Binance, published by Mr_Zakrii. Here's a detailed breakdown:
---
Chart Details and Analysis
1. Asset & Timeframe:
Asset: Bitcoin (BTC) / Tether (USDT)
Exchange: Binance
Timeframe: 30-minute candles
2. Current Price:
Price at snapshot: ~108,420.51 USDT
The price is shown moving upwards toward a resistance area.
3. Key Zones:
Resistance Zone (Top Yellow Box): ~108,900 – 108,950 USDT
Minor Resistance Zone (Middle Yellow Box): ~108,400 – 108,500 USDT
Support Zone (Bottom Yellow Box): ~106,900 – 107,000 USDT
4. Trading Setup (Illustrated by Blue Arrows):
A short (sell) position is being suggested:
Entry: Around 108,420.51 USDT
Stop-loss: ~108,902.64 – 108,953.21 USDT
Take-profit: ~106,930.77 USDT
The setup aims to capitalize on a reversal from the resistance zone, expecting the price to reject and drop toward the previous support.
5. Risk-Reward Visualization:
Red Box: Represents the stop-loss zone (risk)
Green Box: Represents the take-profit zone (reward)
This indicates a favorable risk-to-reward ratio, assuming price respects resistance.
6. Market Sentiment:
The price has recently surged with strong green candles and volume.
The chart suggests potential exhaustion or resistance at current levels.
7. Additional Indicators:
News/Economic Event Marker (Purple Icon): Indicates a possible upcoming event which could add volatility.
Volume: Noticeable increase in buying volume during the upward move, which may suggest momentum, but also a potential blow-off if rejected.
---
Conclusion:
The chart anticipates a short-term bearish reversal from the 108,400–108,900 resistance area down to the 106,900 support zone. The trade setup is based on price action and zone rejection. It's a technical sell setup, likely based on supply zones and momentum exhaustion.
Would you like help evaluating the risk/reward further, or how this setup aligns with broader Bitcoin market trends or news?

SHORT ON SPY (SPX/USD)Spy has given us bearish divergence at a major supply zone.
I will be selling spy to the next support level.
Today is FOMC and I expecting it to influence spy move to the downside.

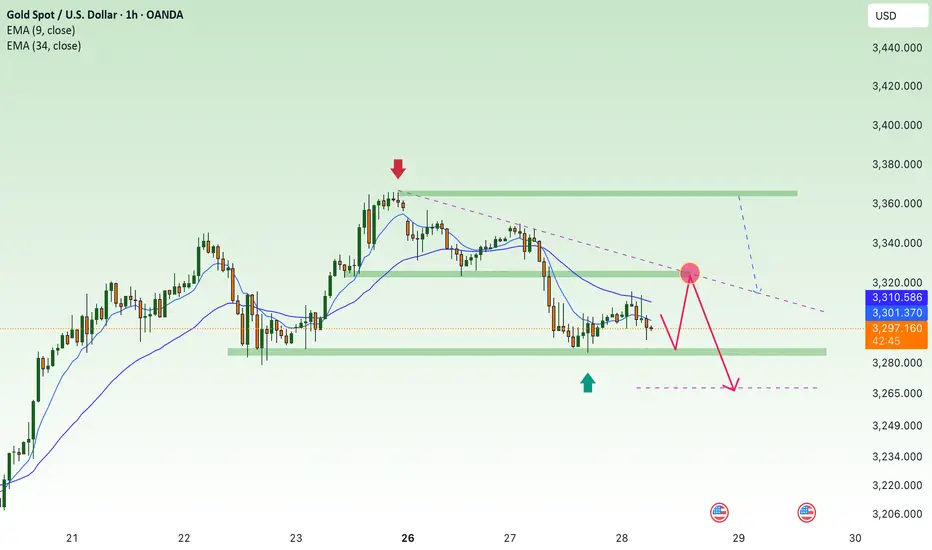
Selling pressure, gold price continues to fall below 3285?⭐️GOLDEN INFORMATION:
Gold prices declined by nearly 2% on Monday, slipping below the $3,300 mark, as investor sentiment improved following U.S. President Donald Trump’s decision to postpone tariffs on European Union imports. The renewed risk appetite, coupled with a modest rebound in the U.S. Dollar from last week’s losses, placed pressure on the non-yielding precious metal.
The move came after a weekend call between President Trump and European Commission President Ursula von der Leyen, which resulted in the U.S. deferring the planned 50% tariffs on EU goods until July 9. The development eased global trade concerns, prompting a shift away from safe-haven assets—excluding the Greenback—and helped propel global equity markets higher.
⭐️Personal comments NOVA:
Accumulated price zone around 3300, under selling pressure, mainly waiting for important economic news this week: GDP, FOMC
⭐️SET UP GOLD PRICE:
🔥SELL GOLD zone : 3363- 3365 SL 3370
TP1: $3352
TP2: $3340
TP3: $3325
🔥BUY GOLD zone: $3266- $3268 SL $3261
TP1: $3277
TP2: $3286
TP3: $3300
⭐️Technical analysis:
Based on technical indicators EMA 34, EMA89 and support resistance areas to set up a reasonable SELL order.
⭐️NOTE:
Note: Nova wishes traders to manage their capital well
- take the number of lots that match your capital
- Takeprofit equal to 4-6% of capital account
- Stoplose equal to 2-3% of capital account
SHORT ON US30US30 Has given us a nice pullback to a major supply area.
I am expecting price to rise a little higher into the supply are then give us a major drop to the previous swing low for over 1000 points!!!
I have placed a sell limit order withing the supply area looking to short us30 for the rest of the week.

SHORT ON SILVERSilver is coming off a lower high and looks like it will start its run push to go and break previous lows to the downside.

BTC/USD SELL SIGNALEntry Zone: 110400 to 110850
Stop Loss: 111100
Take Profit Targets:
* TP1: 109895 ✅
* TP2: 109403 ✅
* TP3: Open/Trailing 📉
Enter with the proper confirmation

Top M30 XAU/USD Trade Setups for Today – Buy & Sell Opportuniti📊📉📈 Gold (XAU/USD) is currently trading within a key support zone 🟣, retesting after a previous bullish breakout. If the price holds this zone and forms strong bullish candles, we could see a move toward the 3,366 resistance level 🔵 and potentially higher toward 3,389 📈. However, if the price breaks below this zone with strong bearish momentum, a drop toward 3,280 🔽 becomes likely. Watch the price action closely within this zone, as it could lead to a decisive move. ✅ Patience and confirmation are crucial to avoid false breakouts. 💡

SHORT ON AUD/NZDAUD/NZD has a double top that formed after sweeping the Asian highs.
I will be selling this pair looking to make 50-80 pips.

BEST XAUUSD M30 BUY AND SELL S FOR TODAYETUP Gold (XAU/USD) is currently trading in a tight **rising wedge pattern** 📈 on the 30-minute chart, just below a key **resistance level at 3,325** 🔼. The price action shows signs of consolidation, indicating that a breakout could be imminent. If the bulls manage to push the price above this resistance 🚀, we may see a strong upward continuation toward higher targets. However, if the wedge fails and price breaks downward 📉, there is potential for a retracement toward the **support levels at 3,304** and further down to **3,274** 🛑. This is a crucial decision point — traders should watch for a confirmed breakout or breakdown before taking positions ⚠️.

SHORT ON EUR/AUDEUR/AUD has swept the Asian high and am looking to short it to take out the Asian low as balance out a huge FVG from the higher timeframe.

BEST XAUUSD M30 BUY SETUP FOR TODAYThis 30-minute chart of Gold Spot (XAU/USD) reflects a strong bullish momentum 📈, marked by a clear Break of Structure (BOS) and Change of Character (ChoCH) signaling a market shift to the upside. Price recently broke above an equal high (EQH) and is now testing a resistance zone labeled as a “weak high”, suggesting potential for further upside toward the next key supply zone 🔴. The projection highlights two possible scenarios: either a continued bullish rally into the supply area around 3,340 🏹, or a pullback to the demand zone near 3,280 🟦 before resuming upward movement. Traders should monitor for price reaction at current levels and be prepared for either a breakout or a healthy retracement for optimal entry opportunities 🎯.

Gold back below 3200 today?⭐️GOLDEN INFORMATION:
Gold prices (XAU/USD) edged lower to around $3,230 during early Asian trading on Tuesday, weighed slightly by a modest rebound in the US Dollar (USD). However, lingering concerns over the health of the US economy—especially in the wake of Moody’s recent credit rating downgrade—may help limit further downside for the precious metal.
The Greenback’s recovery is curbing upside momentum for USD-denominated assets like gold. Still, heightened economic uncertainty continues to underpin safe-haven demand. Moody’s downgraded the US sovereign rating from "Aaa" to "Aa1" on Friday, citing escalating debt levels and interest obligations that now exceed those of other similarly rated nations. These developments are keeping risk sentiment fragile and lending underlying support to gold prices.
⭐️Personal comments NOVA:
Accumulate along the upper and lower trend lines, gold price will break and take more liquidity than the downtrend
⭐️SET UP GOLD PRICE:
🔥SELL GOLD zone : 3224- 3226 SL 3230 scalping
TP1: $3215
TP2: $3208
TP3: $3200
🔥SELL GOLD zone : 3276- 3278 SL 3283 scalping
TP1: $3260
TP2: $3250
TP3: $3240
🔥BUY GOLD zone: $3152 - $3150 SL $3145
TP1: $3165
TP2: $3180
TP3: $3195
⭐️Technical analysis:
Based on technical indicators EMA 34, EMA89 and support resistance areas to set up a reasonable SELL order.
⭐️NOTE:
Note: Nova wishes traders to manage their capital well
- take the number of lots that match your capital
- Takeprofit equal to 4-6% of capital account
- Stoplose equal to 2-3% of capital account
16 hours ago

SHORT ON EUR/USDEUR/USD is in a overall uptrend.
I'm just looking to catch the pullback as we continue to make downtrend market structure on the pullback itself.
Looking to catch 200-400 pips to the downside.

Gold price hidden 3200, waiting for opportunity to increase✍️ NOVA hello everyone, Let's comment on gold price next week from 05/19/2025 - 05/23/2025
🔥 World situation:
Gold prices dropped over 1.5% on Friday, poised to close the week with a steep loss of more than 4%, as improved risk sentiment drove investors away from safe-haven assets and toward equities and other riskier investments. At the time of writing, XAU/USD is trading around $3,187, retreating from a daily peak of $3,252.
The precious metal started the week on the back foot following reports of a significant de-escalation in the US-China trade conflict, including a mutual agreement to reduce tariffs by 115%, which triggered a sharp selloff in bullion. Despite fluctuating between $3,120 and $3,265 throughout the week, gold struggled to sustain bullish momentum, with fading buyer interest becoming increasingly evident amid stronger risk appetite and encouraging US economic data.
🔥 Identify:
Gold price is still in the accumulation phase waiting for a price decrease around 3200. Will be greatly affected by tariff news and Russia - Ukraine peace negotiations
🔥 Technically:
Based on the resistance and support areas of the gold price according to the H4 frame, NOVA identifies the important key areas as follows:
Resistance: $3265, $3357
Support: $3160, $3112
🔥 NOTE:
Note: Nova wishes traders to manage their capital well
- take the number of lots that match your capital
- Takeprofit equal to 4-6% of capital account
- Stoplose equal to 2-3% of capital account
- The winner is the one who sticks with the market the longest

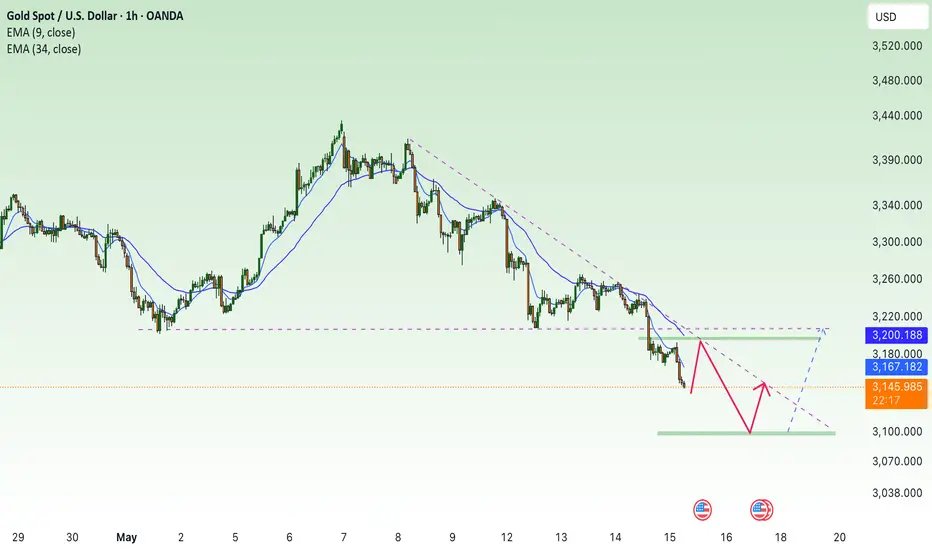
Gold price downtrend with PPI news⭐️GOLDEN INFORMATION:
Gold prices (XAU/USD) extended their decline for a second consecutive session on Thursday, marking the third drop in the past four days and slipping to a more than one-month low below the $3,150 mark during Asian trading hours. The sustained downward pressure is largely driven by renewed optimism following signs of a meaningful de-escalation in the US-China trade dispute — a development that has dampened demand for traditional safe-haven assets like gold.
The announcement of a 90-day trade truce between the world’s two largest economies has also helped ease recession fears in the U.S., prompting investors to scale back expectations for aggressive monetary policy easing by the Federal Reserve. This shift has supported a continued rise in U.S. Treasury yields, further weighing on demand for the non-interest-bearing yellow metal.
⭐️Personal comments NOVA:
Downtrend, bears continue to put downward pressure on the market, heading towards the 3100 price zone
⭐️SET UP GOLD PRICE:
🔥SELL GOLD zone : 3198- 3200 SL 3205
TP1: $3190
TP2: $3180
TP3: $3170
🔥BUY GOLD zone: $3101 - $3099 SL $3094
TP1: $3110
TP2: $3120
TP3: $3130
⭐️Technical analysis:
Based on technical indicators EMA 34, EMA89 and support resistance areas to set up a reasonable sell order.
⭐️NOTE:
Note: Nova wishes traders to manage their capital well
- take the number of lots that match your capital
- Takeprofit equal to 4-6% of capital account
- Stoplose equal to 2-3% of capital account