Gold price decreased at the beginning of the week⭐️GOLDEN INFORMATION:
Gold prices (XAU/USD) edged lower toward $3,310 during the early Asian session on Monday, retreating from last week's record highs amid growing signs of easing global trade tensions.
US Agriculture Secretary Brooke Rollins revealed on Sunday that the Trump administration is engaged in daily discussions with China regarding tariffs, according to Reuters. Rollins also emphasized that agreements with several other countries were “very close” to being finalized.
"Headlines hinting at possible partial exemptions from retaliatory tariffs further lifted market sentiment and contributed to gold slipping below the $3,300 mark," noted Yuxuan Tang, strategist at JPMorgan Private Bank.
⭐️Personal comments NOVA:
At the beginning of the week, gold prices were mainly sideways, without much news impact, trading around 3300 and gradually decreasing.
⭐️SET UP GOLD PRICE:
🔥SELL GOLD zone : 3368- 3370 SL 3375
TP1: $3360
TP2: $3350
TP3: $3340
🔥BUY GOLD zone: $3212 - $3214 SL $3207
TP1: $3225
TP2: $3240
TP3: $3255
⭐️Technical analysis:
Based on technical indicators EMA 34, EMA89 and support resistance areas to set up a reasonable SELL order.
⭐️NOTE:
Note: Nova wishes traders to manage their capital well
- take the number of lots that match your capital
- Takeprofit equal to 4-6% of capital account
- Stoplose equal to 2-3% of capital account
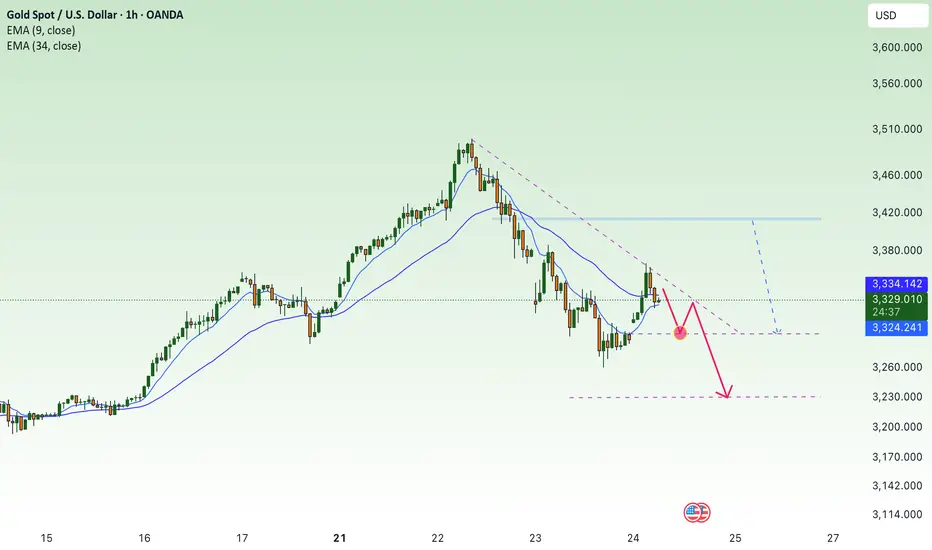
Sellsignal

H4 downtrend line, gold price cools down✍️ NOVA hello everyone, Let's comment on gold price next week from 04/28/2025 - 05/02/2025
🔥 World situation:
Gold prices reversed course on Friday, wiping out Thursday’s gains and slipping below the $3,300 threshold, as persistent US Dollar strength weighed heavily on the precious metal despite declining US Treasury yields. The easing of tensions in the US-China trade dispute further pressured bullion, with XAU/USD trading around $3,294, down more than 1.6%.
Market sentiment remains fragile, swinging sharply between risk-on and risk-off modes in response to comments from US President Donald Trump. Earlier, Bloomberg reported that China was considering tariff exemptions on some US goods, sparking optimism. However, the mood soured after Trump asserted that he would not lift tariffs on China without significant concessions.
🔥 Identify:
News about Russia-Ukraine peace talks this weekend will continue to put selling pressure on gold prices next week. Moving along the downtrend line H4
🔥 Technically:
Based on the resistance and support areas of the gold price according to the H4 frame, NOVA identifies the important key areas as follows:
Resistance: $3357, $3498
Support : $3228, $3155
🔥 NOTE:
Note: Nova wishes traders to manage their capital well
- take the number of lots that match your capital
- Takeprofit equal to 4-6% of capital account
- Stoplose equal to 2-3% of capital account
- The winner is the one who sticks with the market the longest

Gold price heading below 3300⭐️GOLDEN INFORMATION:
Federal Reserve (Fed) officials have signaled openness to potential interest rate cuts, a stance that could limit further upside in the US Dollar (USD) and lend support to the non-yielding Gold price. Additionally, growing concerns over the economic repercussions of President Donald Trump’s aggressive tariff measures, combined with ongoing geopolitical instability, continue to bolster the appeal of safe-haven assets. In this environment, the broader bias for gold remains tilted to the upside, urging caution for traders considering bold bearish positions.
⭐️Personal comments NOVA:
continue sideways, price range fluctuates around 3300
⭐️SET UP GOLD PRICE:
🔥SELL GOLD zone : 3382- 3384 SL 3389
TP1: $3370
TP2: $3360
TP3: $3350
🔥BUY GOLD zone: $3294 - $3292 SL $3287
TP1: $3300
TP2: $3310
TP3: $3320
⭐️Technical analysis:
Based on technical indicators EMA 34, EMA89 and support resistance areas to set up a reasonable SELL order.
⭐️NOTE:
Note: Nova wishes traders to manage their capital well
- take the number of lots that match your capital
- Takeprofit equal to 4-6% of capital account
- Stoplose equal to 2-3% of capital account

Gold's short-term decline continues⭐️GOLDEN INFORMATION:
Gold price (XAU/USD) regained strong upward momentum during the Asian session on Thursday, rebounding sharply from the previous day’s steep decline and ending a two-day losing streak near the $3,260 weekly low. The renewed buying interest comes amid lingering concerns over the protracted trade impasse between the US and China, following US Treasury Secretary Scott Bessent’s comments indicating that the standoff could drag on.
Compounding market anxiety is the persistent uncertainty surrounding President Donald Trump’s tariff policies and their broader implications for global growth. These factors have fueled a fresh wave of safe-haven demand, driving investors back toward gold.
⭐️Personal comments NOVA:
Still under selling pressure, gold price is consolidating below the downtrend line. Trading around 3300 and lower.
⭐️SET UP GOLD PRICE:
🔥SELL GOLD zone : 3412- 3414 SL 3419
TP1: $3390
TP2: $3380
TP3: $3370
🔥BUY GOLD zone: $3228 - $3230 SL $3223
TP1: $3240
TP2: $3250
TP3: $3260
⭐️Technical analysis:
Based on technical indicators EMA 34, EMA89 and support resistance areas to set up a reasonable SELL order.
⭐️NOTE:
Note: Nova wishes traders to manage their capital well
- take the number of lots that match your capital
- Takeprofit equal to 4-6% of capital account
- Stoplose equal to 2-3% of capital account
SHORT ON SILVER XAG/USDSilver is currently at a major level of supply and is currently respecting it.
it has swept liquidity and is also over brought on the RSI.
I will be selling silver to the previous swing low / demand zone.

Gold price stabilized again, trading around 3300⭐️GOLDEN INFORMATION:
Gold price (XAU/USD) found fresh buying interest during the Asian session on Wednesday, pausing its pullback from the previous day’s record high near $3,500. Attempts by the US Dollar (USD) to rebound from multi-year lows faltered, as investor confidence in the US economic outlook continues to erode amid President Donald Trump’s erratic tariff policy shifts.
Additionally, growing expectations of more aggressive monetary easing by the Federal Reserve (Fed) have triggered renewed selling pressure on the greenback. This, in turn, has reinforced demand for the non-yielding yellow metal, helping gold regain upward momentum as investors seek shelter from mounting economic and policy uncertainty.
⭐️Personal comments NOVA:
The slowdown and downward adjustment of gold are inevitable. Profit-taking psychology and cooling news of tariffs and Russia-Ukraine military forces caused gold prices to fall.
⭐️SET UP GOLD PRICE:
🔥SELL GOLD zone : 3410- 3412 SL 3417
TP1: $3390
TP2: $3380
TP3: $3370
🔥BUY GOLD zone: $3281 - $3283 SL $3276
TP1: $3290
TP2: $3300
TP3: $3315
⭐️Technical analysis:
Based on technical indicators EMA 34, EMA89 and support resistance areas to set up a reasonable SELL order.
⭐️NOTE:
Note: Nova wishes traders to manage their capital well
- take the number of lots that match your capital
- Takeprofit equal to 4-6% of capital account
- Stoplose equal to 2-3% of capital account

SHORT ON AUD/USDAUD/USD has given us a double top at a major resistance area/zone.
It has currently formed a lower high after giving us a change of character (choc) to the downside.
I expect price to drop to the next demand level for 200-300 pips.
Dxy News for the rest of the week should help fuel the move if positive for the dollar.

SHORT ON NZD/USDNZD/USD Is currently at a major resistance level/zone and has created a double top or equal highs.
Price has started to fall a bit, but I do believe price will rise to take out the equal highs in a "Liquidity hunt"
Overall I am taking a market execution sell on NZD/USD to the next demand level looking to catch over 300+ pips.

IM BEARISH ON NVIDIA WITH A TARGET OF $55.00. HERE IS WHY:NVIDIA (NVDA) Known for their GPUs, recently has experienced a decline in asset price. Trump tariff's may have been a bearish news catalyst, but do the technicals show a bigger bearish picture?
1 Day chart: While the RSI recently signaled oversold conditions, the RSI line looks to be crossing down the RSI based moving average. Furthermore the 200 Day EMA and 65 Day EMAs appear to be forming a death cross. DMI is still indicating bearish, and the ADX is still above 20.
With recent political news, the tech company has been working on bolstering their U.S based production. But with inflation cooling (6 month low) , I believe many high performing blue chip stocks may see a dip as traders and institutions price in deflation, new news and political events.
My opinion on a target is $55.00 , and there is significant open interest on long puts for this price that are expiring in the coming months.
Will NVIDIA pull out of this downtrend? Or will it become a great value buy for investors?
Disclaimer: Not financial advice.

SHORT ON NZD/JPYNZD/JPY is in a overall downtrend.
Price has completed its pullback phase to a key supply area and has created bearish divergence.
I expect price to drop to the next support level which was the previous low it created. (green line).
I am aiming to make 300-400 pips

Global Market Overview. Part 3 — Commodities / GoldPrevious context and analysis in the article:
Gold isn’t rising — it’s holding its breath
Gold has always served as a shock-absorbing safe haven.
It’s not a profit-driven asset — it’s a refuge. Every time the market starts humming with anxiety, gold silently braces.
Pandemics, geopolitical tension, trade wars, Fed rhetoric, or a poorly timed phrase from the President — they all trigger the same pattern: capital flows into the metal.
And 2025 is no exception.
With trade escalation between the U.S. and China, demand for gold has surged to new local highs.
The panic — skillfully inflated by headlines and press conferences — has done its job. We see gold near its peak, and it might not be done yet.
The real question is: why is gold here at all?
The answer is simple: gold didn’t climb on its own — it was lifted by a wave of fundamental instability, primarily fueled by U.S. policy.
Not a “safe haven” — a forced alternative
Investors didn’t move into gold because they suddenly believe in the metal.
They moved because they no longer believe in the market. Because what they see on screen is chaos — tariffs, threats, vague statements, disinformation, political pressure on the Fed — and no clear path forward.
And when the path disappears, they turn to what isn’t politically tied — or at least appears not to be.
Everyone knows gold doesn’t create value. It produces nothing, pays no dividends, funds no innovation.
It just sits. And waits.
But in uncertain times — that’s exactly what investors want: time and silence.
Bitcoin once again out of play
Yes, crypto enthusiasts still dream of the day when capital fleeing panic will head not for gold, but for Bitcoin.
But in today’s reality — it’s the same old pattern:
Big money moves to metal, not blockchain.
Institutions still choose an asset with thousands of years of trust, not a volatile instrument that could collapse after one regulatory hearing.
Gold at $3,000 — then what?
The target zone for gold in this panic cycle could well be $3,000 per ounce. And yes, it’s possible.
But only as long as fear lives.
The moment clarity returns — especially in the Washington–Beijing storyline — gold will lose its appeal.
And it will fall just as fast as it rose.
The market isn’t driven by fundamentals — it’s driven by perception.
And perception is fickle.
Today, everyone runs for shelter.
Tomorrow, there’s “positive progress in negotiations” — and capital runs from gold to equities, risk assets, buybacks, and tech.
Gold is not a goal. It’s a pit stop.
The financial theater under Trump’s direction
In my view, we’re not just witnessing a volatile phase.
We’re watching a deliberate manipulation.
The media noise rose in just a few weeks. The panic feels artificially inflated. Too many coincidences.
The stock market crashes. Assets depreciate.
And then, just days later, the very same voices behind the headlines begin buying the dip.
This isn’t a conspiracy theory.
It’s an obvious scheme:
Panic. Crash. Accumulate. Recovery. Profit. Repeat.
Trump and his inner circle aren’t conducting policy — they’re executing a financial operation.
And if anyone believes this market will fall forever — they don’t understand how cycles work in the hands of skilled manipulators.
Growth is fast. So is the illusion of control.
Understand one more thing:
As fast as the market rose — it can collapse just as quickly.
Especially when that growth is built not on fundamentals, but on fear-fueled liquidity.
Once tension breaks, gold will fall first.
Followed by stocks — particularly those overpriced during the rush into “safe” alternatives.
A market fueled by panic cannot grow for long.
It burns like paper.
Final thought
A deal between the U.S. and China is near.
The information noise is too loud to be real.
The stock market will again show how chaos can create opportunity.
And gold… gold will fade into the background.
Because safe havens are only needed while the sirens are sounding.
And in this theater — the sirens are already nearing their final act.

continue sideways, BTC accumulates below 88K💎 BTC PLAN UPDATE (April 18)
The recovery of the D frame shows the optimistic sentiment of the market, believing that in the second quarter of 2025 the market will heat up again. The FED lowers interest rates, the group raises tariffs.
NOTABLE NEWS ABOUT BTC:
Recent trends suggest that Bitcoin ETF sell-offs during price surges often foreshadow significant market pullbacks. Notably, substantial outflows were recorded from BlackRock’s IBIT and Ark Invest’s ARKB ETFs, each losing over $113 million in assets.
Should the sell-off by seasoned U.S. institutional investors persist into Thursday, cautious sentiment may spread to strategic retail and mid-tier traders, deterring them from initiating large bullish positions. This risk-averse stance could help explain Bitcoin’s current stagnation near $84,600, even as top-performing altcoins like Solana outpace it with stronger gains over the past 24 hours.
TECHNICAL VIEW
BTC price needs to surpass 92-93K to enter the next big growth period. However, political instability and tariffs are holding back BTC's breakout. Price will continue to sideway and accumulate around 82-86K
Short time frame, sideway around 84k, slow liquidity.
==> Comments are for reference only. Wish investors successful trading

SHORT ON NZD/USDPrice is in a overall uptrend but has started its pullback phase from the high.
Got a choc (change of character) to the downside as well as equal highs/ double top forming.
Dollar news just came out positive and there is a good chance this pair could fall 200-300 pips by the end of the week.

SHORT ON GBP/CADGBP/CAD is currently in the pullback phase of its overall uptrend.
Its has given a perfect BOS (break of structure) to the downside followed by a perfect retest of the supply area that created the BOS.
I will be selling GBP/CAD to the next demand level for a 500-600 pip move.

SHORT ON GOLD (XAU/USD)Gold has found a ceiling and has given a bit of a double top with a change of market structure from up to down.
Its currently retesting the supply area that provided the choc (change of character)
I will be selling gold to the next support level looking to make a $50 move which is 500 pips.

A double sell pattern on HK50 at price21000 to 21100
Why?
1) This pair is still in a downtrend both of H4 and D1
2) We can see the pair had a pattern earlier yesterday for a sell, now it is a type 2
3) There is another pattern forming for the sell off around the same area
We will observe for another 1 hour to get the best price to enter.
The target if everything falls again would be 1:10 Risk to reward.

Bulls recover, gold prices grow OLD ATH ⭐️GOLDEN INFORMATION:
Gold price (XAU/USD) climbs modestly toward the $3,080 mark during early Asian trading on Wednesday, buoyed by renewed safe-haven demand as trade tensions between the United States and China intensify.
In a fresh move, US President Donald Trump announced a 90-day delay on new tariffs—set at 10%—for most US trading partners to allow space for negotiations. However, he simultaneously escalated trade friction with Beijing, raising tariffs on Chinese imports to a staggering 125% “effective immediately,” citing China's "lack of respect for global markets."
⭐️Personal comments NOVA:
The rapid recovery and large fluctuations of gold prices show that the impact of Trump's 90-day tariff postponement news is very strong. The price zone of 3135 and 3167 will be under great selling pressure. There is not much momentum for gold prices to create new ATHs.
⭐️SET UP GOLD PRICE:
🔥SELL GOLD zone : 3164- 3167 SL 3171
TP1: $3150
TP2: $3140
TP3: $3130
🔥BUY GOLD zone: $3074 - $3076 SL $3069
TP1: $3090
TP2: $3105
TP3: $3123
⭐️Technical analysis:
Based on technical indicators EMA 34, EMA89 and support resistance areas to set up a reasonable SELL order.
⭐️NOTE:
Note: Nova wishes traders to manage their capital well
- take the number of lots that match your capital
- Takeprofit equal to 4-6% of capital account
- Stoplose equal to 2-3% of capital account

Gold price accumulates below 3038, waiting for FOMC information⭐️GOLDEN INFORMATION:
Gold prices break a three-day losing streak but remain capped below the key $3,000 level, as rising US Treasury yields dampen the appeal of the non-interest-bearing metal. Despite optimism surrounding potential trade agreements among global partners, lingering tensions in the ongoing US–China trade conflict continue to keep investors on edge. At the time of writing, XAU/USD is trading flat around $2,980 per troy ounce.
⭐️Personal comments NOVA:
Gold price moves with large amplitude, in a downward correction phase. Continues to trade below 3040 waiting for the FED's move on interest rates and agreements on tariff levels of countries around the world.
⭐️SET UP GOLD PRICE:
🔥SELL GOLD zone : 3038 - 3040 SL 3045
TP1: $3028
TP2: $3015
TP3: $3000
🔥BUY GOLD zone: $2958 - $2960 SL $2953
TP1: $2975
TP2: $2990
TP3: $3010
⭐️Technical analysis:
Based on technical indicators EMA 34, EMA89 and support resistance areas to set up a reasonable SELL order.
⭐️NOTE:
Note: Nova wishes traders to manage their capital well
- take the number of lots that match your capital
- Takeprofit equal to 4-6% of capital account
- Stoplose equal to 2-3% of capital account
Gold begins to stabilize, trading around 2990⭐️GOLDEN INFORMATION:
Gold price (XAU/USD) finds renewed upward momentum during Tuesday’s Asian session, appearing to end a three-day losing streak after dipping to a nearly four-week low around the $2,957–2,956 region on Monday. Investor sentiment remains fragile amid lingering concerns over a potential global trade war, triggered by US President Donald Trump’s sweeping reciprocal tariffs announced last week. Fears of a recession and heightened uncertainty continue to fuel safe-haven demand, helping bullion stabilize after its sharp pullback from last Thursday’s all-time high.
⭐️Personal comments NOVA:
Gold price is in a correction downtrend, will continue sideways around 2950 - 3040
⭐️SET UP GOLD PRICE:
🔥SELL GOLD zone : 3036 - 3038 SL 3043
TP1: $3020
TP2: $3005
TP3: $2990
🔥BUY GOLD zone: $2962 - $2964 SL $2957
TP1: $2975
TP2: $2990
TP3: $3010
⭐️Technical analysis:
Based on technical indicators EMA 34, EMA89 and support resistance areas to set up a reasonable SELL order.
⭐️NOTE:
Note: Nova wishes traders to manage their capital well
- take the number of lots that match your capital
- Takeprofit equal to 4-6% of capital account
- Stoplose equal to 2-3% of capital account

Nasdaq Enters Correction Territory Do we go Deeper
Monthly analysis done on the NQ with the ambition to connect with current price activity and gauge a deeper technical understanding on if this is just the start of a bigger correction for the year ahead . Tools used in this video Standard Fib , TR Pocket , CVWAP/ PVWAP Incorporating PVWAP and CVWAP into trading strategies allows for a more nuanced understanding of market dynamics used to assess trading performance and market trends.
Date and price range and trend line .
Some research below regarding the previous correction that I reference the technicals to in the video .
In November 2021, the Nasdaq reached record highs
However, concerns over rising inflation, potential interest rate hikes by the Federal Reserve, and supply chain disruptions led to increased market volatility. These factors contributed to a correction in the Nasdaq, with the index experiencing notable declines as investors reassessed valuations, particularly in high-growth technology stocks.
VS Today
March 2025 Correction:
As of March 2025, the Nasdaq Composite has faced another significant correction. On March 10, 2025, the index plummeted by 4%, shedding 728 points, marking its third-worst point loss ever, with only earlier losses during the COVID-19 pandemic surpassing this.
This downturn has been attributed to several factors:
Economic Policies: President Trump's announcement of increased tariffs on Canada, Mexico, and China has unsettled markets, raising fears of a potential recession
Inflation Concerns: Investors are closely monitoring upcoming consumer-price index (CPI) reports to gauge inflation trends, as higher-than-expected inflation could hinder the Federal Reserve's ability to lower interest rates, exacerbating stock market declines
Sector-Specific Declines: Major technology companies, including Tesla, have experienced significant stock price declines, contributing to the overall downturn in the Nasdaq
Comparison of the Two Corrections:
Catalysts: The November 2021 correction was primarily driven by concerns over rising inflation and potential interest rate hikes. In contrast, the March 2025 correction has been influenced by geopolitical factors, including new tariff announcements, and ongoing inflation concerns.
Magnitude: While both corrections were significant, the March 2025 correction has been more severe in terms of single-day point losses. The 4% drop on March 10, 2025, resulted in a loss of 728 points, marking it as one of the most substantial declines in the index's history.
Investor Sentiment: Both periods saw increased market volatility and a shift towards risk aversion. However, the recent correction has been accompanied by heightened fears of a potential recession, partly due to inconsistent government messaging regarding economic prospects.
In summary, while both corrections were driven by concerns over inflation and economic policies, the March 2025 correction has been more pronounced, with additional factors such as new tariffs and recession fears playing a significant role.

Selling pressure remains, gold price adjusts down⭐️GOLDEN INFORMATION:
Suki Cooper, an analyst at Standard Chartered, noted, “Gold is often seen as a liquid asset that investors turn to when they need to meet margin calls in other areas, so it's not uncommon for gold to decline following a risk event, considering its function within a diversified portfolio.”
On the data front, the US economic calendar showed a solid employment report, with private sector employers adding more than 200,000 jobs in March. Although the Unemployment Rate ticked up slightly, Bloomberg suggested this was “largely due to rounding.”
According to figures from Prime Market Terminal, money market participants have already priced in more than 1% worth of rate cuts from the Federal Reserve by 2025.
⭐️Personal comments NOVA:
Short-term downtrend, disputed price zone 3054 - 2975. Gold price continues to adjust down at the beginning of the week.
⭐️SET UP GOLD PRICE:
🔥SELL GOLD zone : 3084 - 3086 SL 3091
TP1: $3070
TP2: $3055
TP3: $3040
🔥BUY GOLD zone: $2973 - $2971 SL $2966
TP1: $2980
TP2: $2990
TP3: $3000
⭐️Technical analysis:
Based on technical indicators EMA 34, EMA89 and support resistance areas to set up a reasonable SELL order.
⭐️NOTE:
Note: Nova wishes traders to manage their capital well
- take the number of lots that match your capital
- Takeprofit equal to 4-6% of capital account
- Stoplose equal to 2-3% of capital account

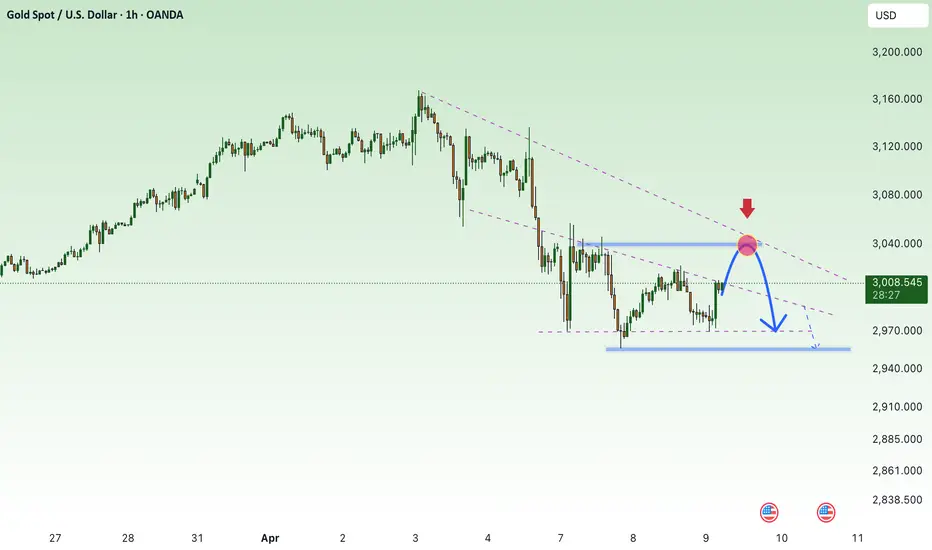
Gold prices start to cool down - back to 3000✍️ NOVA hello everyone, Let's comment on gold price next week from 04/07/2025 - 04/11/2025
🔥 World situation:
Gold (XAU) prices deepened their decline on Friday, sliding to a seven-day low of $3,015 before rebounding slightly, after remarks from Federal Reserve (Fed) Chair Jerome Powell suggested that inflation may accelerate again due to the impact of tariffs. At the time of writing, XAU/USD is trading at $3,029, representing a 2.70% drop.
Market volatility persisted as tensions escalated in the ongoing trade conflict between the United States (US) and China. In addition, Powell dampened hopes for imminent Fed rate cuts, stating that tariffs are expected to affect the US economy by slowing growth and pushing inflation higher.
According to a Financial Times (FT) report, hedge funds faced their largest margin calls since the Covid-19 pandemic, triggered by President Trump’s Liberation Day announcement.
🔥 Identify:
The FOMO increase in gold prices is starting to show signs of stopping due to concerns about economic recession. Gold prices will continue to decline back to the price range below 3000, stabilizing the market again.
🔥 Technically:
Based on the resistance and support areas of the gold price according to the H4 frame, NOVA identifies the important key areas as follows:
Resistance: $3054, $3076, $3105, $3135
Support : $2998, $2953
🔥 NOTE:
Note: Nova wishes traders to manage their capital well
- take the number of lots that match your capital
- Takeprofit equal to 4-6% of capital account
- Stoplose equal to 2-3% of capital account
- The winner is the one who sticks with the market the longest

SHORT ON EUR/USDEUR/USD has finally given a change of character to the downside and is currently pulling back into a supply area.
The dollar is gaining strength due to Tariffs and looks like it will rise.
I will be selling EUR/USD with a sell limit order looking to catch over 200-300 pips over the next few days.
