Sellzone

SBINIF SBIN CLOSE BELOW THE HORIZONTAL THAN YOU SHOULD SELL AND WAIT FOR THE GAP WHIC MAY FILL BUT THERE IS A BULLISH DIVERSION IN RSI


EURUSD-Weekly Market Analysis-Feb21,Wk3I'm waiting for a shorting opportunity withing the red box which is the immediate sell zone. Do note that all 3 timeframes namely the Daily, 4-Hourly and 1-Hourly are showing a different setup, trade this pair with caution.

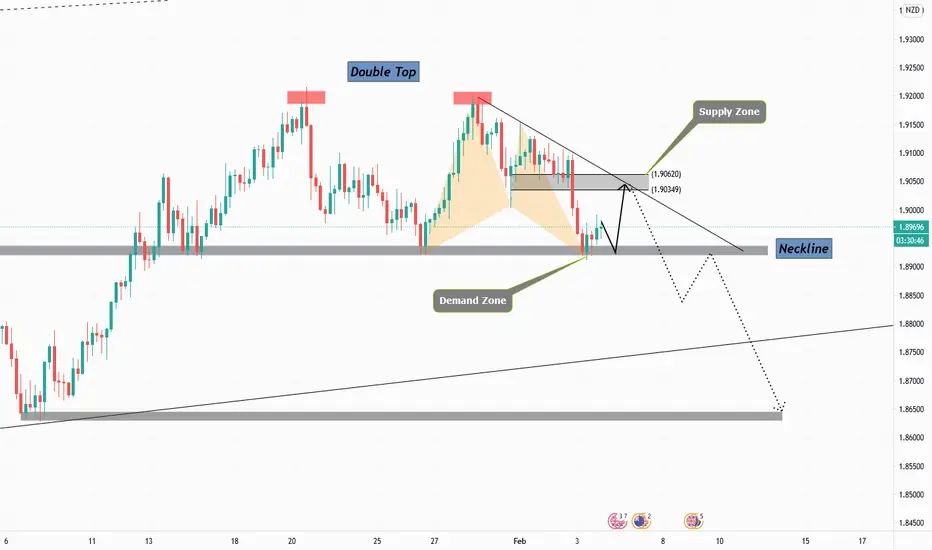
GBPNZD-4H-Long/ShortHi folks;
Price action forecast for Buy and Sell traders. For now,we are looking for a safe buy entry point which is marked as a neckline till supply zone after touched this zone,can get short position.
AUDCHF: SELL Based on our technical analysis on higher timeframes with AUDCHF, we see a potential for a SELL opportunity for the month of February.
Drawing a fib from October 2020's low to January 2021's high, we can see that price is hovering right in the possible SELL zone for Bears to enter. If price does not break the 6.18% level (on the fib drawn) then Bears can definitely enter for the month to take it down to our Take Profit (TP) area labeled "Possible Exit for SELLS" on this Trade Plan. The 21 EMA (hot pink line) was also added to this Plan for another confluence.
Let's see what February 1st brings for us.

EUR/USD, Head and shoulder formation. Eurusd to reach the 1.20 area with a deeper retracement to the golden ration 0.618. Based on the volume profile the POCs clearly are showing a deeper retracement since the value area failed to rise above the 0.5 fib retracement and we can definitely look at a strong USD for the next days.
In terms of structure we are seeing the formation of a head and shoulder pattern , also there is a high probability that the price will fall to the previous demand zone in order to trigger all the institutional orders left at this level.
From a COT perspective we are seeing an equal number of long and short positions added by hedge funds and investment companies on the dollar index, On the Euro institutions have added a huge amount of long positions during the previous week. With that being said we might see the price falling to the 1.20 area in order to trigger the long positions added by the smart money.
If you liked this analysis , subscribe and like for more daily content. If you have a different opinion I would love to hear about it so you can leave a comment. Thanks and have a great trading week.


USDCAD wait to break TLTo enter, we have to wait for the resistance line to break and the momentum to become positive.

USDJPY-Weekly Market Analysis-Jan21,Wk2My bias in shorting USDJPY still stands, in fact on Monday morning I may just engage a trend trading trade by shorting USDJPY on this Shark Pattern as long as the market didn't gap away from the current price. What's nice about this setup is that not only the shark pattern form within the sell zone it is on an RSI Divergence.

USDJPY SELL, just as I predicted ! Good Luck tradersWatch strong price action at the current levels for SELL. GOOD LUCK! Great sell opportunity in USDJPY..

AUD JPY SHORT TERM SELL OPPORTUNITY the AUD JPY is rejected multiple times by trend line resistance and looking bearish to touch down the broken resistance turned support a short term SELL expected
apply your own money management
always remember that
PATIENCE IS THE KEY


GBPUSD SHORT - 130 PIPSBased on my analysis and theory, GBPUSD will short this week to Target Area 1.
Confident level: 99%
Trade at your own risk.


AUDUSD - Sell Zone S&RShorted base on structure target, the first target goes to the previous low and extended target to the second target.


SETUP SHORT EURJPYEURJPY is on a nice sales setup, rejection of the daily bullish trendline with force, attention to potential economic news that can invalidate the setup, good luck to all.

EUR/USD SELL! 45 min chartAnalysis for EUR/USD touching in the resistance!
give the like if u enjoy !
