Slight adjust today, still in an uptrend⭐️ Smart investment, Strong finance
⭐️ GOLDEN INFORMATION:
The price of gold (XAU/USD) is attracting buyers and has surpassed the $2,000 mark in the early hours of Asian trading on Wednesday. This increase in demand for the precious metal is driven by the decline in US Treasury bond yields and the weakening of the US dollar (USD).
According to the minutes of the November Federal Open Market Committee (FOMC) meeting, all participants agreed that policy decisions would continue to be based on the complete set of incoming information. They also deemed it appropriate to maintain the target interest rate within the range of 5.25% to 5.5%.
⭐️ Personal comments NOVA:
After yesterday's strong price increase, surpassing the 2000 mark. Prices will tend to adjust slightly to gain liquidity before continuing to a new peak this year.
⭐️ SET UP GOLD PRICE:
🔥BUY GOLD zone: $1980 - $1982 SL $1975
TP1: $1990
TP2: $2000
TP3: $2010
🔥SELL GOLD zone: $2015 - $2017 SL $2023
TP1: $2008
TP2: $2000
TP3: $1990
⭐️ Technical analysis:
Based on technical indicators EMA 34, EMA89 and support resistance areas to set up a reasonable SELL order.
⭐️ NOTE:
Note: Nova wishes traders to manage their capital well
- take the number of lots that match your capital
- Takeprofit equal to 4-6% of capital account
- Stoplose equal to 2-3% of capital account
- The winner is the one who sticks with the market the longest
Sellzone

US30 - Sell ZoneLittle shy here on US30, and slight adjustments to the zone here, but we are into our sell region, lets see if we can see a bit of a dollar relief rally here.

Other see this as Coal, I see this as DiamondA retest of previous resistance on the daily chart combined with a strong bullish candle movement (an engulfing candle) is an intriguing setup. The observation of RSI Divergence at these levels serves as a significant indicator for a potential reversal.
Regarding the recent deviation from the PRZ zone of the crab pattern on AUDUSD, it seems it hasn't reached the HOP (Harmonic Optimal Price) level before reversing. This deviation could be a point of interest for observation on the H4 chart.
Your decision to take an aggressive shorting opportunity due to the attractive profit factor is noted. However, as you rightly mentioned, managing risk is crucial in such trades. Wishing you success in your trade management and strategy execution!

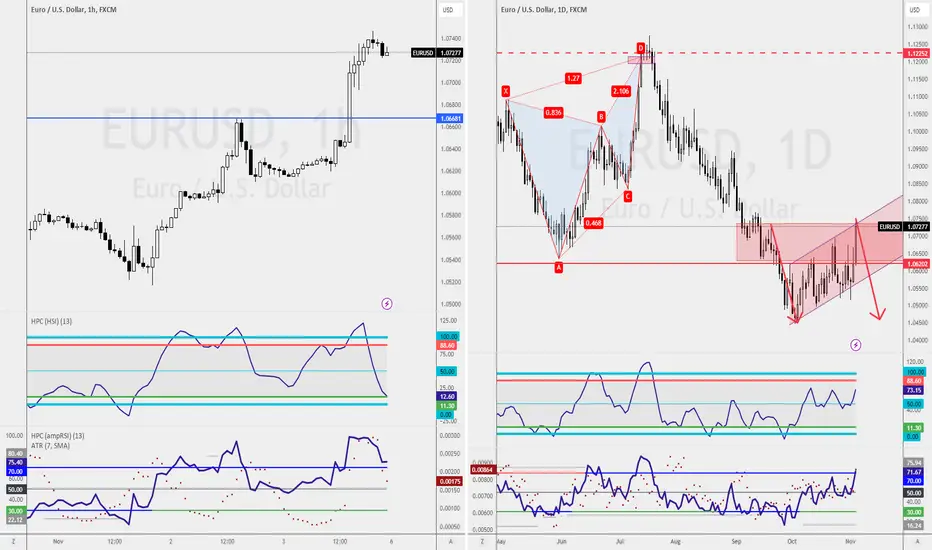
EURUSD IDEA 12-11-2023We traded into a monthly imbalance without fully closing it up top. the red lines indicate monthly weekly daily liquidity at the bottom and daily/weekly liquidity at the top. i dont expect pwh to be taken out this week, i expect price to go down and take out at least fridays 3 november low to then bounce back up from 1.06250 area or 1.05500 area.
On the 4h chart we can see impulsive move up from the 6600 area but once we got up to 7000 zone we had a big bearish rejection followed by a big impulsive move down which to me indicates the possibility to move further down. after the impulsive move down we started to have slow price action moving back up indicating a retracement, not a lot of strength, not a lot of willingness to go up, bringing price back to a balanced level to end the day and the week.
My expectation for monday is for price to return to the supply in the 7250 area that caused the ltf last break of structure down and then continue a short term bearish movement till we get to 6250 or 5500 area.
One other scenario i could expect to happen is to go up to take pwh, fully close the montly imbalance at the 8000 area, where there is also a h4 supply from 4 September, and then move down to fulfil the scenario I described above.
So for next week i will be waiting for price to get to this zones, see how it gets there, and wait for a confirmation to enter the trades.
I will be looking for sells from the 8000 zone and 7250, and I'll be looking for buys from 6250 zone and 5500.

btcusd small sellIm buying bitcoin at the bottom of the target, but see the opportunity to sell to the entry. Small head and shoulder pattern to sell verified on 2 tf and for the buy i see a violation. very quick market execution <3
- PGP

Potential Retracement Week AheadThe overall setup for EURUSD leans towards a Weaker Bullish stance. However, given the impact of Friday's NFP Candle, I anticipate a series of correction moves in the upcoming week. Therefore, I'll be ready to execute whichever trading strategy emerges.
Potential Strategies:
Daily Chart - Bearish Flag Pattern:
The Potential Bearish Flag Pattern is nearing the sell zone. You can opt to wait for candlestick confirmation, possibly during Tuesday or Wednesday's opening. Alternatively, consider heading to lower timeframes to await a double tops setup before entering a short position.
Support Retest - 1-hourly Chart:
Trend traders might want to keep an eye on the market's retest of the support level on the 1-hourly chart, signaling a potential buying opportunity.
Now, the crucial question: Which side of the chart aligns with your trading strategy? I'm eager to hear your perspective. Please share your insights below!
Xauusd-Down to 1845!As you can see, gold is bearish in the daily channel and at 50% Fibonacci + four-hour supply.
- One hour gold is bullish and suffering is forming.

NZDUSD Short Trade Setup A short trade opportunity recently presented itself on the kiwi-dollar trading chart 📉.
This is indicated by the bearish engulfing candlestick 🕯️ pattern just on the 0.60210 horizontal resistance level.
This indicates a false breakout (fakeout) of the same level, with potential price move in the downward 👇 ⬇️ direction.
Sufficient downward momentum should see price dumping towards the 0.59000 psychological level and possibly testing the strength of the 0.58590 horizontal support level.
As always, please apply appropriate risk management.
Happy trading!

Cashing In on Gold: Time to Go Short on XAUUSDHello everyone! We are currently eyeing a potential short opportunity on XAU/USD Here's why:
Fresh Supply Zone: We've identified a fresh supply zone that has recently been tested. This area often presents a strong resistance level, making it a favorable point for a short position.
Fibonacci Level 50%: The 50% Fibonacci retracement level aligns with our target zone, adding confluence to our trade setup. Fibonacci levels are widely watched by traders and can act as key support or resistance areas.
Nominated Order Block: The presence of a nominated order block suggests a concentration of orders in the vicinity of our target level. This can act as a significant obstacle for price movement, making it a compelling area to consider for a short trade.
Keep a close eye on this XAU/USD setup, and be ready to execute your trading strategy when the conditions align. Remember to manage your risk and implement proper risk management techniques to protect your capital. Happy trading!

Aggressive shorting opportunityI am looking at a shorting opportunity on the GBPUSD.
Based on the 4-hourly chart, I am waiting for a magic candle to form up at 1.2368 for a shorting opportunity. My initial stop-loss is at 1.2454 (-86pips) or 860usd. At this moment, my projected target is at 1.2234 (+134pips) or 1,340usd/lot.
Alternatively, you can wait for candlestick confirmation at 1.2405. The entry price is 37pips later, with the same stop-loss and target profit level. Your initial risk is now (-49pips) or -490usd/lot and target profit is now (+171) or 1,710usd/lot.
As you can see from this real-life example, it is better to miss a trade than to engage in a trade you shouldn't have. I believe this investment opportunity has great potential for profit.

XAUUSD SELLSell position in gold. Be sure to wait for the failure of the choch or flip structure and return to the supply area to confirm entering the transaction.

GCAD MASSIVE SELL Floating @ 1:17 RRR and CountingHey guys what is up, so gcad may be preparing to turn and go back up, I am closely monitoring it today as I do believe it is due for not just a big pullback or correction but I also feel like that most recent low (support) needs to be validated
Let me explain why I think so - If everytime a trader buys support that support is broken..don't you think eventually that trader will get smart and stop buying support? This is my reasoning I believe it is a mind game the dealer is going to play here. Continue to allow traders to believe that support still is very much a thing - keep them on the ferris wheel if you will
That being said worse case scenario for me I will close the trade around a 1:14 RRR there about which in my opinion is still worlds better than what the average trader aims to take home (1:3)
We need to remember we cannot win every single trade so due to that what I like to do is when I am winning a trade see how long I can allow it to continue winning for
This not only allows me to have a bigger buffer for when I inevitably lose but it allows me trade from a much more peaceful place as once you are in a winning trade you really just need to manage your stop loss (the work is done)
Have a great day guys :)

SELL XAUUSD XAUUSD SELL According to the presented analysis, if we hit this area in the London session, the liquidity of the Asian session will be collected and we will move towards the liquidity of the Asian floor.

XAUUSD SELLXAUUSD Update Gold is in a long-term downtrend. The gold sell order signal is placed at the time of very important news and is risky. According to our opinion, the price will continue in a downward direction by collecting liquidity in the time of the news by reacting to our entry order.
risk high

XAUUSD SELLEntry confirmation is definitely required in this transaction. Analysis of sales in gold due to the strong downward trend
XAUUSD SELL

GBPCAD SHORThello traders.in this pair ,price touched the supply zone in daily before.as you see in 4hr this channel broke and also we had a price range in 1hr that broken.so we can waiting for confirmation in pullback around FVG area for our sell entry.
r:r 1:73

nifty short at 19800-19890nifty can be short in the given sell zone
one already there is an island gap
second it has tried to test the 19200 level and gap fill remains vacant

SELL XAUUSDA trading idea to find the best entry point, be sure to use chuck and flip and confirm entry in less than 1 minute. XAUUSD SELL

XAUUSD SELLWe will do a risky XAUUSD Sall transaction but with good risk and reward according to the market movement at the entry point with the failure of the market structure and reversal of our transaction.
This approach to the entry point must take place in the London or New York session.

HDFC Sell * All the information shared in this chart is provided for strictly educational purposes only.
* This chart is sharing information are based on the theory of technical analysis .
* This is not an offer to buy or sell stocks, futures , options, commodity, forex, interests or any other trading security.
* Back test yourself before jump into live market consult your financial adviser and use proper risk management.
------------------------------------------
SMC selling area
------------------------------------------
____________________________________________________________
Visit Us for more details
Trading_Cafe24
Thank you :)

EURUSD Bearish Outlook Still IntactFundamental:
No high impact news release coming out in the next 20hrs for The Euro And The USD. Investors staying hopeful on the United States Dollar after Jerome Powell's speech last week at the Jackson Hole Symposium.
Further, increases interest rate for the euro might be bad for businesses at the moment due to inflation.... maybe
Technical:
Mild resistance around 1.0824 but should hold long as 15 mins 200 EMA should act as a strong support for buyers.
I'll be looking the resistance around 1.0852. The 1 hrs 200 EMA also stays as resistance at this point. The Dollar Index (DXY) should also rise and break above 104.44.

XAUUSD SELLIf the previous transaction is stopped, this area has enough credit for the sale transaction, the market decides whether it needs liquidity above the ceiling as fuel or not.

US30 - 21 to 25 July 2023 Hola !
Last week Friday we hit the sellside liquidity = 33+ day lows taken out
Anticipating a stronger correction before we go lower.. i will however be watching that sellzone carefully just to catch a few ticks
Remember always to follow your rules !
Cheers
