#NVDA ready for another push higher? Techs look sexyNvda.. couple of reasons why this is a big level and high probability to be long
(1) Divergence on RSI
(2) Test volume VPOC shelf and held
(3) Demark 9 exhaustion signal on daily
(4) Gliding off the 50dma
(5) Held 50% fib from most recent swing low and high
(6) Back above the Main Pivot
Putting this all together suggests there is a high probability setup here with a stop below the recent lows at 450. Initial targets 480, 500, then if we break out the channel , much higher..
Semiconductors

ARM: Good Share, Bad DerivativeOverview
Arm Holdings PLC ( NASDAQ:ARM ) recently had its IPO back in September 2023. Since then it has bounced around between $46-$78 and I think it's gearing for a rally. Unfortunately there is not much room for a confident technical analysis because of ARM's minimal chart history but I believe this company is definitely worth adding to the Watchlist.
ARM supplies semiconductor technology and has made it a company mission to lower carbon emissions. From my understanding they are attempting to lower their technology's carbon footprint by maximizing the processing power of their chips per every one watt of energy. Imagine this as the equivalent of increasing a vehicle's total miles per gallon (MPG).
I have come under the impression that their technology is delivered to a plethora of companies including NVIDIA and Google who, in turn, use it to develop A.I. projects. It is this aspect that makes me speculatively bullish on the company's outlook.
Speculative Projections
According to their official website ARM technology can be found in nearly every modern device and is used by "70% of the world's population."
ARM's market cap currently rests around $69 billion USD which places it around 1B shares. Since its technology is fueling what is essentially an artificial intelligence bubble within the stock market, it is my personal opinion that a $500B market cap is reasonable if not conservative. This would place ARM's share price around $500 which is a 631% upside from the current share price of $68.34.
If you read my other idea on NVIDIA, I've mentioned that outsourcing may become an issue for NASDAQ:NVDA and so I believe that ARM may be able to fill that vacuum should a semiconductor crisis ever occur. A catalyst like this would definitely have the potential for propelling the stock to new highs.
Risk Management
If picking a good company out of a lineup wasn't enough, now the potential gains to losses needs to be considered. For every dollar risked, I believe at least three dollars should be the reward. With ARM I believe those types of gains are possible however this is the one of those exceptions where I would consider holding shares instead of trading derivatives.
I picked through several option contracts, specifically Calls, and noticed that Open Interest was severely lacking on most contracts except for a few expiring within 90 days. Typically 90 days would suffice however with the lack of trading patterns -- and a sense of direction -- I believe this makes derivative trading too risky for ARM. To top matters off, the contracts with high open interest (>1000) would potentially only deliver 1:1 at best case scenario.
All that said, the lack of direction and amount of share value that would have to be gained within a short period of time leads me to believe that investing in ARM Calls would be reckless. The Calls worth owning and that have an expiration greater than 6 months out have a near non-existent Open Interest. While that could always change if ARM starts getting some attention from the market, this may lead to illiquidity and an inability to unload the contract.
Fundamental Analysis
Current ratio (current assets / current liabilities) = 4.33
* Any ratios under 1.00 are considered a financial risk.
Retained earnings = $2.440B which was a slight decrease from $2.457B in March 2023.
* Allows the company to invest in itself (repurchase shares, expand, etc)
Net income 6 Months Ended September 30 = ($5M) loss
* The majority of the loss appears to have come from escalated operating expenses
within the second quarter. This is a drastic 101.5% decrease from September 30,
2022 which had a net income of $339M.
I'm experiencing some difficulty interpreting the Q2 Earnings Call. I am a self-taught analyst and learn on-the-go so I will need to process this information more before coming to a confident conclusion on the fundamental analysis. However, it does seem that operating expenses increased significantly (approximately by 171.8%) in the second quarter alone.
I will make sure to provide any updates to my findings as a comment on this idea.

The SOLID State Battery Revoloution is upon us - QuantumScapeTarget 1: $15.32
Major Resistance Level: $18.48
Target 2: $26.77
Target 3 / Resistance Level: $36.10
Long Term Target 1: $53.92
Long Term Target 2: $79.65
Major Resistance Level: $95.82
(Disclaimer - After today's massive jump on Volkswagen news, it's likely we will see at least a small pullback. But in the grand scheme of things if this technology is actually what we are hearing, this is just a drop in the grand bucket)
Investing in the Future: QuantumScape Corporation and the Solid-State Battery Revolution
In the fast-evolving landscape of electric vehicles (EVs) and renewable energy, QuantumScape Corporation (NYSE: QS) is emerging as a trailblazer with its groundbreaking solid-state battery technology. Recent developments have sent the company's stock soaring, underlining the potential transformative impact of QuantumScape's innovations on the future of energy storage.
Milestone Achievement with Volkswagen Collaboration
QuantumScape's recent surge is attributed to a significant milestone achieved in collaboration with Volkswagen. The company successfully tested its anodeless solid-state lithium-metal cells technology, confirming its capabilities through an A-sample test. PowerCo, an independent entity, validated the test results, revealing that QuantumScape's solid-state cell not only met but exceeded the requirements of the test.
Impressively, the solid-state cell completed over 1,000 charging cycles, equivalent to a remarkable half a million kilometers of travel for an electric car with a WLTP range of 500-600 kilometers. Even more compelling is the fact that the cell demonstrated minimal aging, retaining an impressive 95% of its capacity or discharge energy at the end of the test.
PowerCo CEO Frank Blome expressed his optimism, stating, "These are very encouraging results that impressively underpin the potential of the solid-state cell." The successful completion of this test positions QuantumScape as a frontrunner in developing a battery cell that could offer extended ranges, rapid charging capabilities, and minimal degradation over time.
Technical Advancements Driving QuantumScape's Success
QuantumScape's technology addresses critical challenges faced by traditional lithium-ion batteries, which are approaching the limits of their energy density. The company's innovations include an anodeless architecture and a proprietary solid ceramic separator, leading to notable improvements in energy density, charging speeds, and safety.
Key advantages of QuantumScape's solid-state battery technology include:
Energy Density: Significant increase in volumetric and gravimetric energy densities by eliminating graphite/silicon anode host material.
Fast Charge: Enables less than 15-minute fast charging (10-80%) by eliminating the lithium diffusion bottleneck in the anode host material.
Extended Life: Eliminates capacity loss at the anode interface, thereby extending the useful lifetime of the battery.
Enhanced Safety: Replaces the organic separator with a solid-state separator that is nonflammable and noncombustible, significantly improving safety.
Cost Efficiency: Lowers costs by eliminating the anode host material and associated manufacturing costs.
Investment Considerations
QuantumScape's recent success and technological advancements position the company as a key player in the future of energy storage. The collaboration with Volkswagen further strengthens its industry standing, and the positive test results underscore the viability of its solid-state battery technology.
Investors should note that QuantumScape's stock has experienced a notable uptick, reaching its highest level since early August. However, with short interest at 15.6% of the total float, some volatility may be expected.
As QuantumScape continues to perfect and scale its manufacturing processes, investors have the opportunity to align themselves with a company at the forefront of revolutionizing energy storage. The upcoming Q4 earnings report, expected in the middle of February, will be a key indicator of the company's financial health and growth trajectory.
In conclusion, QuantumScape Corporation presents a compelling investment opportunity for those seeking to participate in the transformative shift toward more efficient, safer, and longer-lasting energy storage solutions. As the world increasingly embraces electric vehicles and sustainable energy practices, QuantumScape stands poised to play a pivotal role in shaping the future of the industry.

EOY review $AMD explosive move up, still inside year NASDAQ:AMD what a move, bright green year, but still inside year
outside quarter, inside year
extended? maybe, who knows, but....
always room for a further move up, especially given the highs of '22 and '21
both, not taken out yet....
let's see how semi conductors will move from here, in the A.I. era

Symmetry in LRCX - BullishUpdate to a previous idea I posted recently, this is more accurate.
385 post earnings (by 10/21)
525 by end of Nov 2022
Pullback to 385-400 by Jan 2023
Retest All Time High @ 731 by June 2023

AVGO TO HUNG IT SELF CAP"(What goes up must come down some how)"
Will let see it for real
But we must watch the red leves (targets and support) and when the correction start we also must consider the 0.5 and 0.618 retracment
As always wish me luck
Good luck to me 😁
Please not financial advice

$NVTS showing technical strength into Q4.$NVTS:1W
Small cap semi-conductor company and Seeking Alpha darling NASDAQ:NVTS is showing signs of strength, holding the 0.5 Retrace with a bullish outside bar on the weekly time frame.
For NASDAQ:NVTS to breakout from the downward wedge being formed on the weekly chart, I would need to see strong consolidation above the 1.382 (9.12) price level and for an extended period of time (4-6 weeks)
After a prolonged and recent selloff, I believe market clarity stemming from the ‘fog of war’ will provide a catalyst for NASDAQ:NVTS to reclaim the 1 Ret (7.46) which is roughly 20% higher than the current price at time of publication. It is also quite possible that this could be the beginning of a longer cycle 3rd wave on the weekly time frame.
The technical risks that I see here are the bearish price to RSI divergence (dotted trend lines) that is emerging on the 1 week time frame. This comes on the heels of the recent rally in price that came directly after a bullish price to RSI divergence (solid bottom trend lines) and provides me an element of technical confliction in the analysis that warrants caution. As a result, I’m cautiously bullish here with a minimum price target of 7.46 and a secondary target of 9.12 before the end of the year.
Not financial Advice. All stocks can go to zero.

Pullback in $NVDA forthcoming.$NVDA:1D
+27% since June 1, 2023 and well positioned for a pull-back down to the 460 price region (yellow horizontal line).
Signal is just coming out of overbought on 1D RSI.
Bear tombstone doji followed by bearish outside bar.
Volume flows (vfi) remain positively constructive which could blunt the extent of downside price action.
Not financial advice.

$ON poised to fill the upside gap...Update: NASDAQ:ON +177% since the start of 2020. Signal comes back in line at 73.32 and fills the gap at 80.51. I would look at an upward retrace to the 0.5 (81.38) the same as an upside gap fill.
Given the depth of oversold on the 1D RSI in combination with an extremely high central tendency illustrated by the Pearson's R^2 of 0.94, a 'dead cat bounce' to the upside is not unreasonable to expect in the near term.
As long as price remains above the RET 1 (61.47) I believe NASDAQ:ON will retrace the 0.5 at 81.38 by the end of the year.
If price does not remain above the 61.47 level and further selling pressure is applied to the 'EV economy', a spill down to the 1.382 (46.26) is not out of the question.
130 day volume index flows (bottom indicator) remain constructive despite the recent sell off, implying a market willingness to absorb price at these levels.
Not financial advice. All stocks can go to zero.

AMD - The Trend Is Your FriendHello Traders, welcome to today's analysis of Tesla.
I will only take a trade if all the rules of my strategy are satisfied.
Let me know in the comment section below if you have any questions.
Keep your long term vision.

INTC: Bullish Shark and Breaking Back Above The 200 Month SMAIntel has made a full reset down to the PCZ of a perfect Bullish Shark Harmonic on the Monthly Timeframe and it went below the 200 Month Moving Average to do so but it was short lived as price only a month later managed to get back above the 200SMA and close above it. I now believe that we could atleast see price test the 50% - 61.8% Retraces above but if the Dow reaches all time highs as i am somewhat leaning towards then we may see Intel make an even more surprising and extended move to the upside from here beyond the .618 retracement.

Semis for the comebackThe semiconductors ETF NASDAQ:SMH is already making new highs, NASDAQ:NVDA is looking great again and NASDAQ:AMD is near a pivot buy
But I'm looking at these two stocks, NYSE:ONTO and NASDAQ:MTSI , both are making a double bottom pattern and haven't breakout yet
The thing is that NYSE:ONTO has been outperforming NASDAQ:MTSI since 2021, so depending on what happens this week I'd be more or less aggressive with $ONTO.

$NVDA downside gap-fill potential!NASDAQ:NVDA ,1D: Price dipped just below the 50% line and popped back up over the line after coming off the local lows at 403. Given the 'uncertainty' around the level and duration of a 'higher for longer' rate environment along with the market's general preference for 'clarity' over 'uncertainty', it would not be unreasonable to expect the 'increased volatility' that comes with 'uncertainty' until some level of 'clarity' can be established around the duration of the current 'higher rate environment'.
Further adding to the potential for 'market uncertainty' and 'lack of clarity' are the tenuous and ongoing negotiations between the U.S. and China around access to semi-conductor IP. NASDAQ:NVDA utilizes the cost benefits provided to its model from the 'cost efficiency' of both Chinese and greater Asia's manufacturing and production capacities. Were trade relations around semi-conductor IP between China and the U.S. to become 'less amenable', the deterioration of that relationship could adversely impact NASDAQ:NVDA 's margins.
If NASDAQ:NVDA had to re-establish production/manufacturing supply chain relationships elsewhere this could inject 'uncertainty' into the price discovery process. These are 'unknown unknowns' at this point and hard to factor into analysis, but at a minimum, they would increase the potential for 'market uncertainty' and the subsequent 'lack of clarity', which often leads to 'price volatility' until some level of 'certainty' could be re-established.
Looking at our 1 day RSI against price I am seeing a 'bearish divergence' whereby price makes 'higher-highs' and 'higher-lows' while the RSI prints 'lower-highs' and 'lower-lows'. This can be taken as a 'leveling off' of momentum that often precedes a change in price direction or, at a minimum, a significant pull back within a constructive trend. (see light violet curves)
I would expect that a downside 'gap fill' could be a 'necessary evil' at some point in time across the next 6 weeks or so, and before further gains to the upside could probabilistically be portended from a structural standpoint. The bottom of the gap fill is roughly in confluence with the YTD VWAP (peach).
NOT FINANCIAL ADVICE. ALL STOCKS CAN GO TO ZERO.

$ON: The EV downside is already priced in.$ON:1D
With the earnings forecast providing downside price pressure on the longterm trend, NASDAQ:ON hits the lowest level on its1D RSI in over two years.
Needless to say, our trend has been weakened from a Pearson’s R^2 of 0.91 down to a Pearson’s R^2 of 0.88 while losing a little more than 3% of the longterm trend strength in the process.
While there are significant headwinds facing the EV market at current, from supply constraint’s on graphite to scaling EV’s across our shaky electrical grid system, it seems as though NASDAQ:ON has those concerns ‘overly priced in’ and could be poised for a rebound along with the broader semi-conductor market.
I would expect NASDAQ:ON to make an attempt at coming ‘back in line’ with its long term trend and to make a move up to the lower 3rd standard deviation line at 76.49 and possibly higher before year’s end.
Not financial advice. All stocks can go to zero.

$ON: EV headwinds are priced in.$ON:1D
With the earnings forecast providing downside price pressure on the longterm trend, NASDAQ:ON hits the lowest level on its1D RSI in over two years.
Needless to say, our trend has been weakened from a Pearson’s R^2 of 0.91 down to a Pearson’s R^2 of 0.88 while losing a little more than 3% of the longterm trend strength in the process.
While there are significant headwinds facing the EV market at current, from supply constraint’s on graphite to scaling EV’s across our shaky electrical grid system, it seems as though NASDAQ:ON has those concerns ‘overly priced in’ and could be poised for a rebound along with the broader semi-conductor market.
I would expect NASDAQ:ON to make an attempt at coming ‘back in line’ with its long term trend and to make a move up to the lower 3rd standard deviation line at 76.49 and possibly higher before year’s end.
Not financial advice. All stocks can go to zero.

ASML Holding Options Ahead of EarningsIf you haven`t sold the top here:
Then analyzing the options chain and the chart patterns of ASML Holding prior to the earnings report this week,
I would consider purchasing the 140usd strike price Calls with
an expiration date of 2023-10-20,
for a premium of approximately $16.
If these options prove to be profitable prior to the earnings release, I would sell at least half of them.
Looking forward to read your opinion about it.

The Semiconductor Industry and Texas Instruments Long TXN
Company Overview: Texas Instruments (TXN) is a prominent and long-established semiconductor company headquartered in Dallas, Texas. Founded in 1930, TXN has evolved into a global leader in the semiconductor industry, with a diverse portfolio of analog and embedded processing products. Here are some key aspects of the company:
Product Range:
TXN specializes in analog and embedded processing semiconductors. Analog chips are designed to process real-world signals such as sound, light, temperature, and motion. They are used in a wide range of applications, from industrial and automotive systems to consumer electronics.
As tensions between Taiwan and China continue to rise, it is a good idea to consider the semiconductor business as an industry to invest in. The largest chip manufacturer in Taiwan by far is Taiwan Semiconductor Manufacturing Co (TSMC). Although TSMC focuses on digital semiconductors, the hype alone could lead many investors to add TXN to their portfolio simply because they don't understand the difference. TXN is also in a unique position, where in the event of a China-Taiwan conflict, it could certainly garner increased government funding.
We are currently watching three main price points.
1. $156.00
2. $167.00
3. $186.00
We are currently hitting the direct top of our Ichimoku cloud.
If we bounce here i anticipate All targets being hit within 2 months.
Especially if we see geopolitical events continue in their current manner.

AMD opening @ reversal zone with max dip ~97-98Watch AMD for a bounce at 97 on a market open fakeout.
I already alerted puts (bearish) @ 108 and the stock is already down -8%. That's a large gain in 3 days. Watch for key reversal. If it doesn't reverse, can see a lot of volatility.
Tagged the puts idea.

NVDA opening @ reversal zone with max dip ~417Watch NVDA at this opening reversal zone. Potential to keep dipping to 417 on a market-open fakeout.
I will add more insight later. But watch this play.

ARM: Short setupARM IPO was one of the most obvious short play this year. The one-day pump was it and now time to short it out. So far, the bounce has been steady and choppy. I think $56.78 will be the local top for now. Right now, price has broken below the channel support, but there might be a bear trap rally back up around at $54. From there if price breaks below $53, it will be the next short setup. Stop loss right above the upcoming spike. Ultimately, I think it is a $25 stock, but will re-evaluate when time comes. Above $56.78, there might be another push up higher up to $62 level before it turns down again...

Fundamentals from Technicals: AMDThe NASDAQ:AMD Weekly Chart shows that the stock had attempted to complete the long term bottom at 104.
But over the past few weeks, it dipped below that bottom completion level.
This week it has started move up. This provides a level of fundamental support.
If it had continued downward, then fundamentals would be lower. For now, it appears fundamentals are within the outlined range, an accumulation zone.

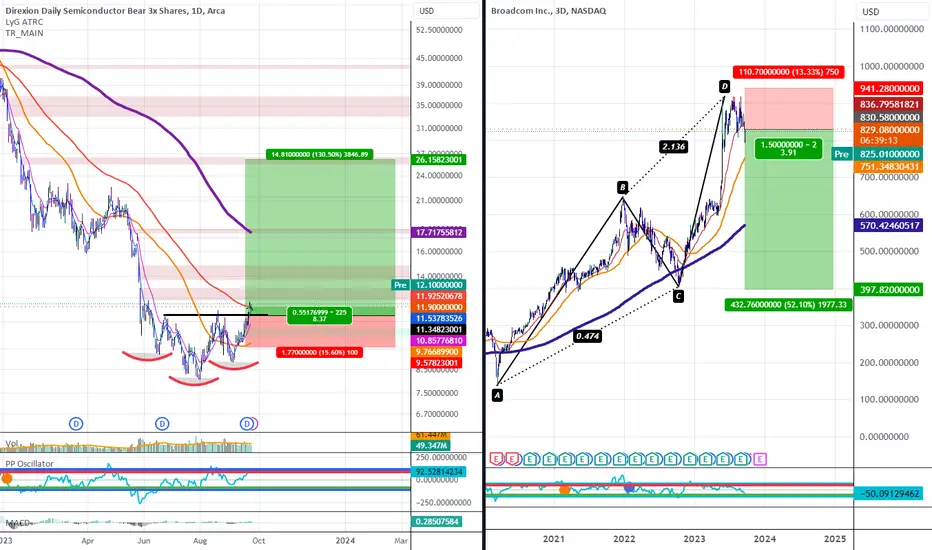
AVGO and SOXS Preparing to Move BigSOXS the 3x Inverse ETF for Semiconductors, has broken out of a Bullish Head and Shoulders and now sits at the 89EMA. If things go as expected, SOXS should be clear to at least give us a 60-150% rally. At the same time, we also have a Bearish AB=CD on AVGO and what looks to simply be filling of a gap it made at $830 after breaking below its own slanted Bearish Head and Shoulders neckline as seen here:
If things go as I expect them to, we will see AVGO open the week to aggressive downside with minimum overall targets as deep as 50% below current prices.
#SMH Looks like a Double Top...smells like a double top
walks like a double top
#SMDH
Goblin town given time is the destination.
