one minor hickup for broader marketssemiconductors have been a lead bear in this downturn since december, and a lead bull on the monthly bounce from the lows since july. if we roll over here setting a lower high on this etf around the first upper horizontal i would look for broader markets to consolidate on the daily. if we treat pivot as support i would target the upper horizontal and look for continuation in broader markets. most likely scenario is a gap down followed by a rally to close with price action after to be determined.
Semiconductors

Is AMD due for a correction?NASDAQ:AMD
AMD had a good run into the earnings season however
news is that with the expected or present recession
semiconductors as a subsector will fall a bit heading
into the third quarter.
The chart shows buy order blocks as a support are
far less than sell order blocks.
The MACD , a lagging indicator, shows the K/D
lines crossing over the histogram.
My idea is to take a call option contract for
a strike 5% below the present price.
Setting a stop loss at 10% of the option price
taking profit when the AMD stock approaches
above the closest buy order block at about
$ 98.45.
Do you have call options to suggest?

semiconductors could be in for a huge bull moveif we stay above pivot, there is nothing stopping the top of the sss supply zone from being reached, and qqe rsi signaling bull with a green sss on the weekly. if we pivot higher i would aim for upper horizontals, if we fin ourselves making a bear cross at this key resistance i would aim for lower horizontals if sss stays red.

SOXS to SOXL ratio DAILY CHARTAMEX:SOXL
This chart strives to setup a trading plan where the SOXS and SOXL
are oscillated. They are 3X leveraged ETFs with great range.
SOXS was up 400% YTD at its peak. The new CHIPS
ACT is a catalyst for US semiconductor manufactures
Right now the ratio is on a downtrend, meaning Sell SOXS
or BUY SOXL or a combination of each.
I believe that this strategy could yield 5X annually
to investors or long-term swing traders with little effort
especially if an alert is employed to notify the ratio
is changing trend direction at a pivot.
The timeframe could be lower but then the number
of trades is likely to increase as is the amount
of profit. This could be backtested by those
familiar with the mechanics of doing so.

Are Semiconductors Stalling?The Philadelphia Semiconductor Index ripped about 29 percent between early July and early August, but now it may be showing signs of fatigue.
The first pattern on this chart is last Thursday’s peak of 3087 -- slightly below the early June high of 3159. That lower high is potentially noteworthy when compared with the broader Nasdaq-100, which pushed above the respective level on its chart to the highest since early May. It could be sign of relative weakness for chips.
Next is Monday’s doji candlestick, a potential reversal pattern. Also notice how SOX appears to have broken a rising trendline.
Third, the Relative Strength Index has retreated from near an overbought condition.
Finally, you have an increasingly mediocre news flow . Nvidia’s warning yesterday, combined with similar news from Intel and Western Digital , may reflect less-than-stellar fundamentals in chip stocks.
Given the market’s healthy bounce and falling volatility, SOX may not retest the 2022 lows. But it may have lost its mojo and chop around for a while as investors seek outperformance in other corners of the market.
TradeStation has, for decades, advanced the trading industry, providing access to stocks, options, futures and cryptocurrencies. See our Overview for more.
Important Information
TradeStation Securities, Inc., TradeStation Crypto, Inc., and TradeStation Technologies, Inc. are each wholly owned subsidiaries of TradeStation Group, Inc., all operating, and providing products and services, under the TradeStation brand and trademark. You Can Trade, Inc. is also a wholly owned subsidiary of TradeStation Group, Inc., operating under its own brand and trademarks. TradeStation Crypto, Inc. offers to self-directed investors and traders cryptocurrency brokerage services. It is neither licensed with the SEC or the CFTC nor is it a Member of NFA. When applying for, or purchasing, accounts, subscriptions, products, and services, it is important that you know which company you will be dealing with. Please click here for further important information explaining what this means.
This content is for informational and educational purposes only. This is not a recommendation regarding any investment or investment strategy. Any opinions expressed herein are those of the author and do not represent the views or opinions of TradeStation or any of its affiliates.
Investing involves risks. Past performance, whether actual or indicated by historical tests of strategies, is no guarantee of future performance or success. There is a possibility that you may sustain a loss equal to or greater than your entire investment regardless of which asset class you trade (equities, options, futures, or digital assets); therefore, you should not invest or risk money that you cannot afford to lose. Before trading any asset class, first read the relevant risk disclosure statements on the Important Documents page, found here: www.tradestation.com .

Intel Classic Cup and HandleHello,
Thoughts on technical chart analysis on Intel.
Cup retracement 83% for a deep bowl for good long term returns if the pattern plays out.
In the short term thinking about the handle we see a ~38.2% retracement.
Adding a Gann Fan to help time the movements.

MU will test resistanceIn regards to comparing net income to market cap between the big semi-conductor teams, MU looks the best. TSM is awesome but if there's a war with China I don't want to deal with blockades while US semi-stocks sour out the sky after we subsidize when we lose Taiwan.
Test 70 resistance
Probably purchase 50-55 c calls deep in the money and sell 70-80 c calls and collect off the volatility

Strong Buy AVGO:547.27We consider a strong buy for Broadcom Inc, rating the company as the absolute leader in semiconductors

$AMD still on top of things We are still above diagonal trendline. Although there was an overreaction after yesterday's earnings, AMD recovered fabulously. Also still holding above 100SMA. Company has the best female CEO ever.

Bullish Cypher/Shark on IntelIntel has Recovered a Downside Gap on the Daily and in the process of doing so has also created a Gap down and left a huge Gap yet to be Recover to the Upside. Suspiciously this has all happned near the Pattern Completion Zone of this Potential Bullish Cypher and leads me to believe that this is where intel will begin a Bullish rally to take us to the $50-$60 area.

looking for signs of temporary bull exhaustionthe rally has been very strong for a week, and im looking toward the resistances carved out over the last few days to find a bear entry scouting hourly rsilevels and sss signal to turn red qqe making a short entry

AMD Earnings UpcomingDepending on the markets reaction to AMD's earnings after the close today, we could see AMD show confirmation of a breakout from this downwards channel. Relative strength sitting at resistance levels in respect to historical "tops", looking to see if a breakout in relative strength can also provide confirmation after ER. Directional movement also positive.
Negative ER reaction I believe would continue AMD back within its downward channel to look for support near $87

$AMD - meeting resistance at the diagonal trendline again Sellers again overwhelmed the buyers on a diagonal down trendline. Earnings this week. Perhaps that can help to get over the trendline and claim uptrend.

some continuation followed by consolidative move in semissemiconductors are on an upward trajectory,and a sell the news event has marked new highs in 3x leveraged semiconductor bull etf SOXL. as long as we remain in this uptrend the market will have no trouble with a third drive to the upside, but during which i would be looking for signs of exhaustion, as some kind of daily topwick could form around rhe $20 area. if we get movement above this supply zone the chart will look more bullish, but closing the gap and pivoting to an hourly equillibrium in an overbought area rsi. that being said a higher supply could take a day or two so as long as sundays numbers are positive or negligible loss nq1! semiconductors should find a local extreme to the highs early or mid next week and consolidate. upper horizontals are stiff resistance, and lower horizontals are areas to be explored for short candidacy.

Easy Long - THIS IS NOT ADVICE!!!congress providing fundamental promise with passing a bill that could influence markets to buy this ETF, Technicals are setup to look for a return to previous levels off the backs of a strong Bulldiv rally from oversold levels, setting a stop below the recent swing low allows for a technical trade plan that removes emotion. The simple R/R lines up with the bottom of the recent range making it conservative, too. if the position is large enough, it could be managed through selling calls and use the premiums to hedge against a drop, just close out any short calls before dumping shares and make sure any short calls are sold with a strike above entry.
NOT ADVICE, SIMPLY FOR FUN AND THEORY

Double whammy of demand contraction and political leverageSummary
The semiconductor sector is expected to enter a difficult period with demand contraction due to recession and crypto winter. As the US government is increasing the effort to use semiconductors as a leverage to put pressure on China, companies in the sector might be forced to prioritize the national political agenda against profit and growth , which further amplifies the negative impact from slowing demand.
Demand contraction
The US economy officially entered a technical recession as the GDP figure announced this week unexpectedly shrank again by 0.9% , making a 2 quarters consecutive decline. Large employers such as Amazon are also announcing their layoff plan to better weather the worsening economic outlook. Companies downsizing will reduce the demand for office electronics such as laptops and work phones.
Although the commonly reported U3 unemployment rate remains stable at 3.6%, the U6 unemployment rate has actually increased for 2 consecutive months from 6.6% to 7% . With states continuing to pair back the covid unemployment benefit, more people are forced to re-enter the job market which in some cases the pay are not even as good as the unemployment benefit they have been receiving. The reducing disposable income of the US consumers is likely to negatively impact the demand for goods, especially for the non-essential durable consumer product such as electronics. High food and energy prices also contribute to such change in spending allocation.
Political leverage
Semiconductor chips are one of the most critical building blocks for most electronic products. The new product trend such as electric vehicles further push up the demand for chips. To put it into perspective, a Ford Focus uses roughly 300 semiconductor chips, whereas the electric Mach-e utilizes almost 3,000 semiconductor chips. The US government has been using national security reasons to block companies from selling gears for fabricating advanced chips (<10nm) to China since the Trump era. This week, the Biden administration has notified equipment suppliers such as NASDAQ:KLAC and NASDAQ:LRCX that the restriction is further tightened to <14nm , and it will also cover fabrication plants run by non-Chinese companies such as NYSE:TSM in China. Semiconductors will continue serve as a tool to slow Chinese growth at the cost of industry profitability.
Earlier this week the US Congress had passed the chips act and approved $52 billion in funding for domestic semiconductor manufacturing. While there is definitely a strategic necessity to rebuild the US fabrication ability given the political tension between China and Taiwan , the difficulty to establish a fabrication facility should not be underestimated, if you look at how hard even for Samsung to catch up TSM on defect rate especially for the <7nm advanced chips. For most semiconductor companies it is not just about the funding but also if there is a profitable way out for domestic production, or it is going to be a capital blackhole that keeps sucking investment without meaningful outcome.
Technical discussion
The US equity market is currently rebounding as rate expectation cooled off due to increasing risk of recession. S&P500 and Nasdaq100 have already broken through the 50 days moving average and are now challenging the Jun rebound peak. The 20 days moving average is also catching up and is about to sit on top of the 50 days moving average. In fact, the sustainability of this rebound will depend on how long can the 20 days stay above the 50 days moving average, as (1) upward pointing 20 days and 50 days moving average, with (2) 20 days higher than the 50 days moving average are the basic forms of a bull market.
S&P500
NASDAQ100
In this regard, by comparing SOXX and QQQ, one can visualize the sector discount due to the double whammy discussed above. Although SOXX has also broken through the 50 days moving average, the 20 days moving average is still further away from the 50 days moving average , which makes it a better short candidate compared to QQQ for those who believe the recent uptrend is a bear rebound but not the beginning of a bull.
Here are the levels SOXX trader should pay attention to:
Downside Resistance
370 - 385: 20 days and 50 days moving average levels
326.7: Jul-05 52 weeks low
270-280: Post-covid bull breakout level in 2020-Jun
Upside Resistance
433.99: Jun-02 rebound peak
455-465: 250 days moving average level
501.09: Mar-29 rebound peak
While our view toward the semiconductor sector remains bearish, shorting too early in a rebound can be very costly to traders. It is recommended to scale in the position either when SOXX itself, or at least until the border markets show sign of momentum decline (e.g. reverse hammer candlestick pattern)
Note: For traders who wish to trade leveraged ETF such as AMEX:SOXL (3x bullish) or AMEX:SOXS (3x bearish), it is still recommended to use the non leverage version SOXX for technical analysis purposes. As the daily 3x process sometimes will shift the resistance level and make the reading less accurate.

SMH - TECH Welfare @ $282 Billion / $25B Tax Credit PerNancy and the Gang anxiously await the Senates Taxpayer handout to the Industry.
Po Nancy, $107 Million simply is not enough for her and Pablo the Shark Tank Drunk.
Nancy had to gobble $341K in losses on NVDA after exiting her 25K Shares in a loss due
to slime lights a shinning.
Bravo, add 3 zeros and it's all good.
Everyone should lose a hand.
Preferably, a head.
__________________________________________________________________________
They'll need to expedite this Grift Gift as China's warned off the Carrier Group as well
as Fancy - show up and it's going to be "A Dangerous Moment"... Nancy risks our young
men and women in the Navy with harm's way...
Don't give it a second thought.
Saddle up and please take the rest of the House and Senate with you.
Create a Threat to National Security... Risk Lives, Profit from it as a matter of course.
Shut up Hoi Polloi, we didn't ask you, we decide - you obey.
___________________________________________________________________________
The insiders in and outside the Beltway can't wait to get this Theft to the House and wrap
it up for August recess.
Qui Bono, you ask?
Intel, TSMC, and Texas Instruments - direct Jing.
Fabless chipmakers like Nvidia and AMD will not be left out in the cold. They will receive
"Scientific Grants out of the $230 Billion in free money for "Innovation."
It is quite likely the following Companies will join the Grift eventually:
Micron Technology Inc. (MU)
Amkor Technology Inc. (AMKR)
Camtek Ltd. (CAMT)
Analog Devices Inc. (ADI)
Although these ladies doth protest too much, it's an irresistible deal... free money.
We'll see $175B in Tax Credits gifted when everyone joins the Semi-Orgy.
You and me - we get the Bill @ $457 Billion.
Enjoy or do something.
ps. - IMF: Russian economy doing better than expected

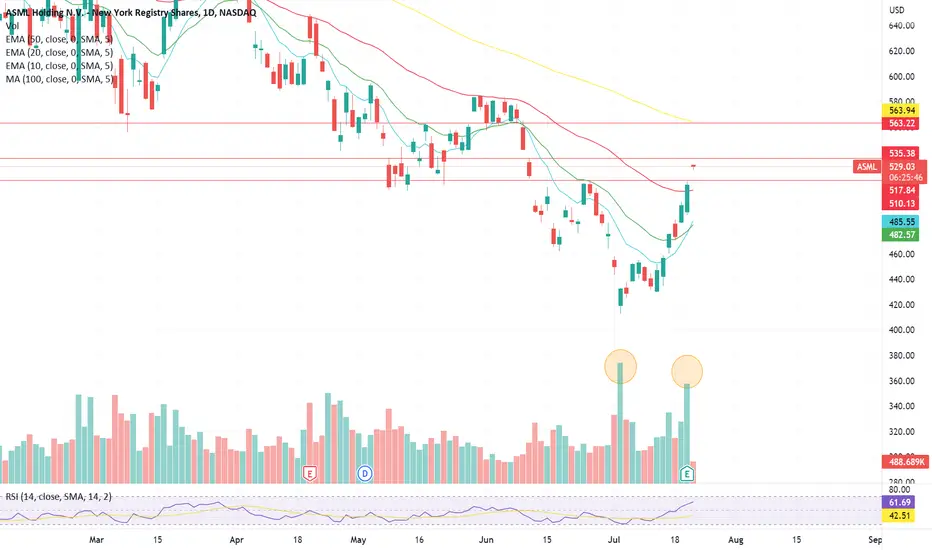
ASML - great earnings, might go up to 100SMAASML had good earnings on 7/20 and showing strength and volume. Some gaps to fill to the upside and the next resistance level around the 100SMA and supply zone also around $665. I like this one!
NVDA up to 100SMAGap fill to the upside on NVDA, and some supply zones but I can see the stock reaching 100SMA around $200 perhaps even this summer.

my view on the (tech) marketI still don't think it is over and it can get very bloody. There are a lot of companies affected by the still not perfect again working supply chain on one side and decreasing demand because of cost of living. This will affect the whole hardware and software industrie IMO, even cloud and advertisers (will happen later) and we can alright read that some manufacturers of consumer products have full stocks (graphic card manufacturers for example which get supplied by NV). I think this can take up to one year before we see this everywhere in the tech market. This little dip does not reflect the real impact. Just my point of view, no financial advice.

Taiwan Semiconductor Manufacturing (TSM) LONG!! Semiconductor industry is poised for a decade of rapid growth, with many end products relying heavily on the essential supply of semiconductor chips and products. Automotives, mobile phones, laptops, tablets and the like all require chips to work. Amongst this industry lies a semicon giant poised to rear its head: TSM.
TSM is the main supplier of chips for AAPL, with a huge backlog of stocks yet to be supplied.
Fundamentals:
- TSM is poised to produce 2NM chips by 2025.
- Chips are price inelastic, demand normally has to contend with rising costs imposed by suppliers.
- Innovation is strong in the semiconductor industry with huge capital spend on R&D for better and smaller chips
Technicals:
- MACD oversold with MACD line slopping upwards
- MACD selling momentum weakening with histogram shortening
- Prices have reached and bounced from the 200 TEMA + 61.8% fibonacci retracement levels
- Price action show huge BULLISH ENGULFING candle
TARGETS:
108.4
96.3

$AMD headed towards the top of the channel into earnings?AMD could get to the top of the channel around $98 before earnings, which is supposed to be on 8/2/2022. There're some gaps to be filled to the upside and the 50DMA could stay in the way. To me it looks interesting and worth to watch.

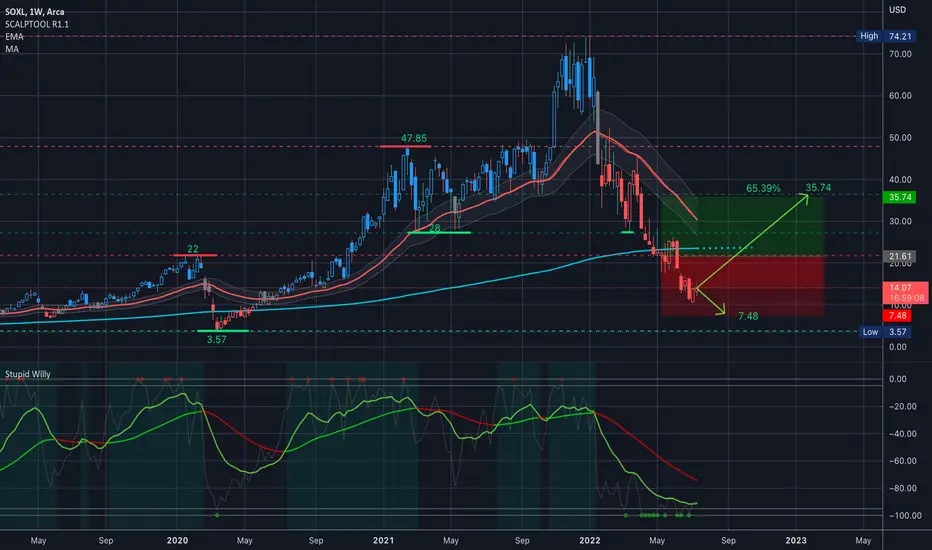
$SOXL Analysis, Key levels & Targets $SOXL Analysis, Key levels & Targets
This, without a doubt has been one of the most exhausting positions I have on right now…. But that is the nature of 3x leveraged instruments….
I have 310 shares, with an average of 21.61 and I am 34.72% down.
SO, for anyone that remembers this strategy from last year… the next add will be to double my position at 7.48. I don’t have the 7.48 order set yet, but I have alerts at $10 and once it hits 10 that order will be in…
From here my sell target is 35.74 —> looking for a 65.39% profit…. And of course that target will change if the 7.48 double target triggers….
Looking at stupid Willy, there is still room and I can see a real possibility of 7.48 hitting… but it doesn’t have to…. Looking at some semi companies, a lot of them are looking to test their 200MA on the weekly, but also they are hooking upward at their weekly 180EMA so I’m comfortable with my position here.
If you’re playing this one with me - now you know how insane my tolerance for volatility is….
Happy trading, y’all…
On a side note: what's your favorite Semiconductor company? I trade AMD and ON, and I track NVDA
—-
I am not your financial advisor. Watch my setups first before you jump in… My trade set ups work very well and they are for my personal reference and if you decide to trade them you do so at your own risk. I will gladly answer questions to the best of my knowledge but ultimately the risk is on you. I will update targets as needed.
GL and happy trading.
IF you need anything analyzed Technically just comment with the Ticker and I’ll do it as soon as possible…