AMD Short Setup - With Timing Lines This RoundFor those that followed the original idea, the look of the path seems correct, but the unexpected super-parabola was not. Even now, this chart looks wrong when zoomed out, due to the excessive price action at vertical levels.
This next leg will probably be more than your average mean reversion, which is the only reason why I would ever follow up such a poorly-timed idea with the same exact idea. This line of thinking is something I try to avoid under most circumstances because it is the same concept as "averaging down" your cost basis when immediately proven wrong.
I'm a permanent pig with few morals and no time for averaging against a whipsaw. But this is no whipsaw (unless you seriously cannot see the forest for the trees here).
-Semi-Correct-Pig
NASDAQ:AMD
NASDAQ:NDX
CURRENCYCOM:US100
NASDAQ:SOX
NASDAQ:IXIC
Semiconductors

12/12/21 RMBSRambus, Inc. ( NASDAQ:RMBS )
Sector: Electronic Technology (Semiconductors)
Market Capitalization: 3.156B
Current Price: $28.86
Breakout price: $29.30
Buy Zone (Top/Bottom Range): $28.50-$27.00
Price Target: $29.70-$30.20 (1st), $30.70-$31.20 (2nd), $34.40-$35.60 (3rd)
Estimated Duration to Target: 18-19d (1st), 39-41 (2nd), 104-110d (3rd)
Contract of Interest: $RMBS 1/21/22 29c, $RMBS 2/18/22 30c, $RMBS 5/20/22 30c
Trade price as of publish date: $1.20/contract, $1.30/contract, $2.20/contract


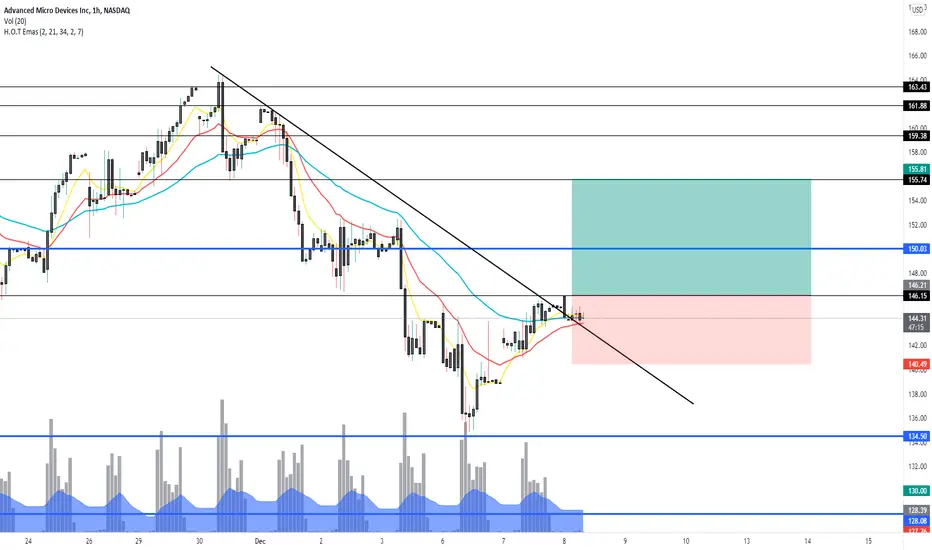
AMD approaching pibotAMD is trying to break out of a descending channel.
Yesterday we saw NVDA ripping, and it feels like AMD is lagging behind.
I am watching P.A above 146.15 for an entry.
NVDA IdeaPrice is at the first trendline / resistance.
Confirmation is a candle closing above 312.45
There are quiet a few resistance in the upside, however this name has been beaten, could see some reversal from the lows.

two different directions for NVDAthe thought that NVDA could bear flag is upsetting to some, but the price could be lower, in which case rsi, stoch, macd would diverge bullishly. like wise a gap down that is bought, and confirms 4hr higher lows could be another trip to overbought levels on multiple timeframes

$MU sniper edition #4*This is not financial advice, so trade at your own risks*
*My team digs deep and finds stocks that are expected to perform well based off multiple confluences*
*Experienced traders understand the uphill battle in timing the market, so instead my team focuses mainly on risk management*
Recap: My team entered $MU at $72.92 per share. Our first take profit is $92.
My team averaged up on our position today at $82.5 per share bringing our share average up to $77.71.
OUR FIRST ENTRY: $72.92
OUR 2ND ENTRY: $82.50
FIRST TAKE PROFIT: $92
2ND TAKE PROFIT: $103
If you want to see more, please like and follow us @SimplyShowMeTheMoney

NVDA sell climax nearthe indication is that NVDA will continue to find support near $301 and move toward the $315 area

AMD Short Downside RotationAMD currently at 144.01.
Looking for the semiconductors to begin rotation.
AMD targets "Areas"
T1 136.88 - 135.75
T2 109.34 - 108.46
T3 105.32 - 104.64

MRVL: Incoming Sell OffIt's possible that MRVL is reaching the completion of its third wave after a multi year run where prices continue to increase with reason. After earnings the price shut up to the Fibonacci resistance level that would typically correspond with profit taking - that coupled market wide reflection on valuations may lead to a steady sell off over the next few months before MRVL will continue the final leg of its bull run

Buy $SOXS - NRPicks 12 NovSeeks daily investment results, before fees and expenses, of 300% of the inverse of the daily performance of the PhLX Semiconductor Sector Index. The index measures the performance of domestic companies engaged in the design, distribution, manufacture and sale of semiconductors.

Buy $SOXS - NRPicks 29 Oct$SOXS is an index that seeks daily investment results, before fees and expenses, of 300% of the inverse (or opposite) of the daily performance of the Semiconductor Sector Index.

Buy $SOXS - NRPicks 15 Oct$SOXS is an index that seeks daily investment results, before fees and expenses, of 300% of the inverse (or opposite) of the daily performance of the Semiconductor Sector Index.

TINTINTINTINCheatsheet for Tin. Tin futures plus the only three 'real' equity postions one can consider


$TSM nice reversal setup$TSM nice reversal bouncing back from $107 support and took conformation after breaking $112 next step to break $125. wish it is on a trend now target $125 $127 big level will be $136 before going to $136 sure it need strong support to fill the huge gap.

$NVDA | Watchlist #3 | 11/22-11/24 $NVDA +$333
(Over $333 for calls)
Price targets: $335, $337, $340
Technical analysis:
- Bull flag on the daily chart
- All time high breakout

Micron (MU)Global growing trend and strong penetration of a local resistance trend line is a good signal for further growth of MU. Nearest resistance is $81 - upside ~ 8.5%. Stop limit is $70 (-4%). Profit/loss ratio is 2:1. Reaching first target recomend to close 70% of positon and hold other one to rqach $84, $88 and $94 closing 10% of initial volume every point.


$RMO we hit and quit for a 18% gain*This is not financial advice, so trade at your own risks*
*My team digs deep and finds stocks that are expected to perform well based off multiple confluences*
*Experienced traders understand the uphill battle in timing the market, so instead my team focuses mainly on risk management*
Recap: On November 2, 2021 my team entered lithium-ion battery company Romeo Power $RMO at $4.45 per share. Our first take profit was set at $5.25.
$RMO released their 3rd quarter earnings report today after market close. In this report they reported a loss of $0.20 per share on revenue of $5.8 million. After this announcement $RMO experienced a very brief price jump to $5.70, but since then it has trickled back down to $4.78 per share.
My teams first take profit was hit post-market at $5.25 per share today. We sold all of our shares at $5.25 as we anticipate $RMO to stay within the $4-$6 range until they get around to announcing their 4th quarter earnings. We believe that this price range is a fair estimate, however this could change on the drop of really good or bad news.
We still believe in $RMO long-term, however we did not have enough sentiment to continue holding once our first take profit was hit today.
My team has made a gain of 18% from this trade.
Congrats to those of you who took this trade with us.
ENTRY: $4.45
TAKE PROFIT 1 (HIT): $5.25
TAKE PROFIT 2: $7.00
If you want to see more, please like and follow us @SimplyShowMeTheMoney

LRCX: THE NEXT FACE RIPPER LRCX is your next chip rip. Creating huge demand and should dip back to 600 before continuing its trip. Over 627.76 has a big day to 640.47 ahead of it soon. Over that $660 area. Ultimate target is $717. Yes you can quote me. December 31 target for that number.

DNEX Techincal AnalysisMany gurus & group have already done their analysis on the future prospects of the company so let's talk about the technical part of the share movement of the company for the past 8 months.
From 0.20 to highest 1.05 in just 2 months with return of approx 450% during early of the year 2021, I believe many investors and traders have benefited from the drastic share movement of the company especially from the company warrant WD. Sky rocketing of a company share price in short period usually will draw market attention hence triggered profit taking from investors and traders. This is not the case similar to Genetec company with share volume of only 52m made easier to push the company share price. Dnex is a extremely heavy on its share volume of 3,090m especially after conversion of the company warrants and Private Placement. Hence, the company share price needs time to digest after shooting 450% in just 2 months.
I've seen many groups and gurus keep shouting on this company recently in telegram with their analysis of breakout from the triangle chart pattern (although I expect them to do thorough and meaningful chart analysis instead of just saying breakout from triangle chart pattern as I think most traders also know how to see lol). I don't know they are real investors or just want to speculate on this counter since the company share volume is real heavy but hopefully the market will soon treat it as a company with fundamental but not penny stock.
For the past 8 months, the share movement have went through 5 contractions/sell-down and every contraction kept narrowed as follow (refer to chart as well):
-39.41% in 56 days
-29.56% in 27 days
-17.73% in 22 days
-12.84% in 12 days
-6.14% in 4 days
The figures shown above are showing diminishing supply characteristics with decreasing volatility (refer to volume based on 20 MA showing downtrend line since March 2021) and it fulfill the characteristics of Volatility Contraction Pattern or VCP.
Characteristics of VPC
1.) Strong Underlying Demand;
2.) Overbought comes with Strong Selling Pressure; (Demand < Supply)
3.) Diminishing Supply Characteristics;
4.) Decreasing Volatility;
5.) Explosive Breakout (Demand > Supply)
Also to notice the chart pattern kept forming higher low and also with lower high but recent chart pattern seems want to form higher high which is a good signal for the share movement.
Nobody will know how's the share price movement in future but in order to in tact with the ideal chart pattern, the share price must be supported at 0.82 & 0.80. VCP is a very common theory in share market and everyone in share market also knows it. Most of the time the movement of a share price will not follow exactly the theory (sometimes the chart pattern too perfect I will scare also haha) we learnt so do your risk management before enter a trade but hopefully it will works this time (been tortured for so many times in counter as an investor haha).

LG Display is Looking UndervaluedFundementals:
P/E ratio at 3.5
OLED Sales gonna be higher since the holiday season
LCD Prices remain high
LG beat Q3 expectations
OLED growth going to be lucrative as LG position itself as the leader.
Technicals:
14day MA cross 50 Day MA
Bullish Reversal Pattern Formation
