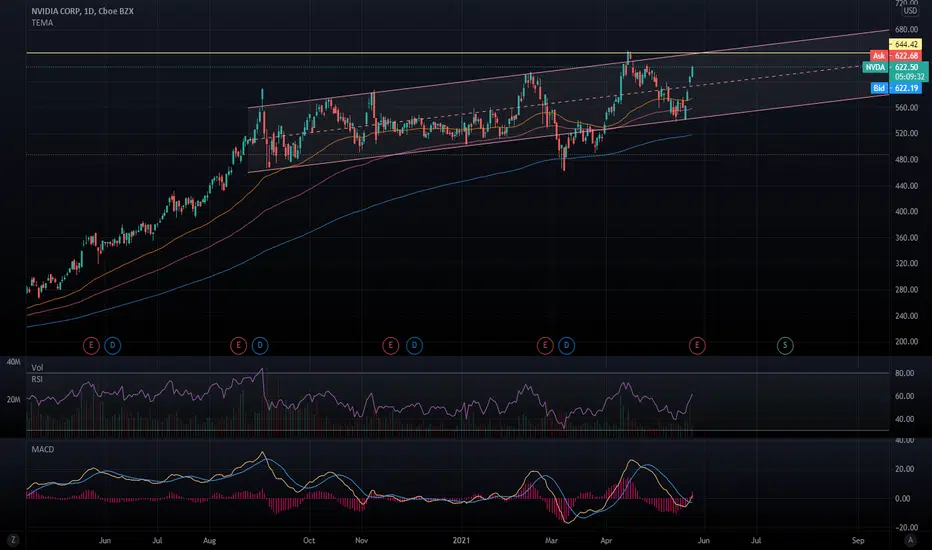
Time to Finally Sell NVDA?After a beautiful runup past all time highs weeks ago, NVDA has found itself in a similar position as the Nasdaq by hitting and getting rejected at the first fibonacci extension level.
I closed my long in this last week as I saw this level approaching and now it appears that a legit pullback may be coming into reality.
So I am bearish.. or am I?
Truth be told Nvidia is one of my favorite stocks, so I am aggressively watching for lower levels of re-entry and have been anticipating doing so for weeks now even as it ran up in price. I intend to load up and so I will be watching this closely over the coming days and weeks.
The best case scenario short term for Nvidia is that bulls can bullishly engulf and break above the key fib level and hold it as support on the weekly.
Until then, shorts or put options seem the most attractive bet in the immediate short term.
Semiconductors

IBM More Downside?This is a short-term possibly bearish post within a longer term bullish play. Last week IBM closed out with a big 4.5% drop in one day after news of the CEO resigning. But was this the cause or was something larger perhaps in the chart in play here?
Well when we zoom out on the monthly chart, we see back in April this year IBM broke aggressively bullish out of the downward sloping green trendline and went straight to the 0.5 fib level around $153. What was missing on this move however, was a confirming retest of the green trendline. It appears the bulls were front runners of the price, and now the retest of the green broken trendline is still well in play. There is lots of bullish confluence where the price currently sits, however. So it will be interesting to see how IBM's price will behave both this week as well as the remainder of this new month. Right now is a decent area to nibble on a long but be on the lookout for a retest of the green trendline and keep stop losses tight as this has been a roller coaster of an asset.


$AMD my team continues to win*This is not financial advice, so trade at your own risks*
*My team digs deep and finds stocks that are expected to perform well based off multiple confluences*
*Experienced traders understand the uphill battle in timing the market, so instead my team focuses mainly on risk management*
Recap: Steadily increasing semiconductor demand due to current shortage will leave $AMD with fat profits during the next few market quarters. After correcting from its all time high of $99.23 $AMD now sits at $93.93 per share.
My team entered into $AMD on 6/10/21 at $81.10 per share. We averaged up on our positions at $81.64 on 6/21/21.
We trimmed our positions before close to secure profits at $93.93 per share due to our first take profit being hit.
Congrats to those who took this trade with us.
ORIGINAL ENTRY: $81.10
AVERAGED UP AT: $81.64
TRIMMED AT: $93.93
2ND TAKE PROFIT: $111.00
STOP LOSS: $76.00
If you want to see more, please like and follow us @SimplyShowMeTheMoney

$AMD bullish again? Here's the analysis.Hello everyone,
AMD has been an outperformer since it tested the 73 support multiple time earlier this year. It broke out of a 6 months long downtrend line in 2020 November and is currently backtesting it (thick yellow line). This may indicate the strong hyper momentum semiconductor stock is ready for another powerful rally.
Disclaimer: I personally hold AMD shares so this analysis is biased toward the bull side.
Pros:
- Downtrend line broken and currently holding the ratest
- Lightning bolts price action, a classic bull flag that points toward 89-91 areas.
- Tech and growth being in favor again with the easing of inflation fear.
- Trading lower than my valuation of 96 - 110, note that this valuation is subjective and priced in with a high PE ratio.
Cons:
- R/R ratio for the trade right now is not favorable to the bull until it clears 89 - 94 resistance
- Slight bearish divergence on the RSI
- Change in monetary policy could have a negative impact on tech stocks again.
- Market breadth across shows bearish signs as not most stocks are above 50EMA
Summary: Technicals of AMD are favoring the bulls and stock outperformance has not changed for the short term.
For holders: Monitor price action around 89 - 94 resistance, you should up your expectation with recent technicals
For non-holders: Buy around 81 - 83 as the previous resistance areas are likely becoming support.

$SOXL - semiconductors Bull 3x gonna explode soon $SOXL #SOXLAs we expect the boom in the sector in the upcoming years related to the worldwide shortage of semiconductors I thought it could be a good idea to buy this ETF instead of specific stocks. This way I can track what's going on in the industry and stay with the position without the need to rebalance all the time.
Keep in mind:
1) NVDA (which is 7% of ETF) will have a split in June (typically bullish)
2) AMAT, LRCX - other strong companies of the sector are on the edge of a breakout
3) Technicals are strong, above all SMAs except 20 (this gonna happen soon as well)
4) Crazy runners like LEDS also related to semiconductors

$AMD June Update *This is not financial advice, so trade at your own risks*
*My team digs deep and finds stocks that are expected to perform well based off multiple confluences*
*Experienced traders understand the uphill battle in timing the market, so instead my team focuses mainly on risk management*
Recap: Steadily increasing semiconductor demand due to current shortage will leave $AMD with fat profits during the next few market quarters. After correcting from its all time high of $99.23 $AMD now sits at $81.64 per share.
My team entered into $AMD on 6/10/21 at $81.10 per share. We have adjusted our first take profit which previously was $90 to $92. Our stop loss remains at $76.
We're averaging up today at $81.64 per share.
ORIGINAL ENTRY: $81.10
AVERAGING UP AT: $81.64
FIRST TAKE PROFIT: $92.00
2ND TAKE PROFIT: $111.00
STOP LOSS: $76.00
If you want to see more, please like and follow us @SimplyShowMeTheMoney

JHM Going Reversal?JHM has been down trending for awhile. Will we see a new uptrend in the nearest time?

NEW POSITION $ON Target 44.34 for 19.71% $ON Target 44.34 for 19.71%
Or double position at 29.74
—
On the far right of the chart is my Average (Grey) Current Target (Green), and Next Level to add (Red) Percentage to target is from my average.
I start every position with 1% of my account and build from there as needed and as possible.
I am not your financial advisor. Watch my setups first before you jump in… My trade set ups work very well and they are for my personal reference and if you decide to trade them you do so at your own risk. I will gladly answer questions to the best of my knowledge but ultimately the risk is on you. I will update targets as needed.
GL and happy trading.

Advanced Micro Is Challenging a Trend LineBelieve it or not, Advanced Micro Devices has been little changed for 10 months. But now the semiconductor stock may be getting ready to move.
This chart shows how AMD is stuck between a falling trend line and its 50-day simple moving average (SMA). Our Moving Average Speed custom script shows how the 50-day SMA only turned positive two weeks ago.
Next, Average True Range has narrowed to its tightest level since July 10, shortly before AMD’s last big surge.
Third, notice how MACD has been rising since late May. The 8-day exponential moving average (EMA) has also climbed above the 21-day EMA. Both of those suggest the short-term trend is turning more positive.
Finally you have the $73.90 level, the top of the gap from July 29. AMD has held that level several times, including mid-May. Interestingly, the chart somewhat resembles Facebook in March , when the bears made one last assault before going into an all-out retreat. Traders may watch the trendline for evidence of something similar taking place in AMD.
TradeStation is a pioneer in the trading industry, providing access to stocks, options, futures and cryptocurrencies. See our Overview for more.

INTEL LONG!Hey friends!
Today we have beautifull news.
Biden-Harris Administration Announces Supply Chain Disruptions Task Force to Address Short-Term Supply Chain Discontinuities FINAL REPORT.
The Administration recommends that Congress support at least $50b in investment in domestic semiconductor manufacturing.

KOPN ($KOPN) for huge breakout with potential long-term swingKOPN. Semiconductor (!!!) name.
NASDAQ:KOPN
Done:
above 10day SMA
above 20day SMA
above 100day SMA
huge vol on last Friday
Waiting:
breakout of 50day SMA
breakout of trend line formed since Feb 21
Distribution stage seems to be over. Time for new pump!
Entry on PB with low vol and higher low after break of the trend line
target $10-13

Copper Trend intactCopper has a strong uptrend with a stair-step behavior.
With pent-up demand for semi-conductors, copper mining has been increasing to help suppliers.
For in depth analysis, please check my last charts on CPER.

$AQMS Very low debt and a 9 month cash-burn runway$AQMS Sustainability and green energy penny stock with very low debt and a 9 month cash-burn runway. Technical setup looking great for a swing. Will be looking for $5.

MPWR somehow still above 300.000.618 fib level has been tested repeatedly, and holds for now despite continuing to trade below MA100 and MA200. Selling pressure apparent from CMF and acc/dist. Most recent earnings tending toward pre-pandy levels, so perhaps overvaluation is becoming more difficult to ignore. Though I could reasonably see MPWR bouncing again within the current sideways channel, I tend to favor a continuation of the downtrend, if only for the complete dearth of bullish signatures at the moment.

$AMD Channel Breakout?AMD Looking very strong here breaking out of its resistance trendline heading higher, I expect this to head towards $90 soon. Very Bullish

AMD back in the game to lead the semicon mega cycle?Recently Bloomberg interviewed the CEO and President of AMD, Dr. Lisa Su. She shared her views on the future of semiconductor industry and how AMD intends to navigate through the current tough times.
youtu.be
Dr. Su mentioned that semiconductor industry is undergoing a mega cycle in 2021. This has been buoyed by extremely strong demand due to surge in gaming products, PC and data centres and almost everything now has a chip component in them. She thinks that the chip shortage situation is just part of the cycle and the semiconductor industry is really good at managing the supply fluctuation over the years. AMD has chosen to invest in the more resilient industry of computing to overcome the challenges ahead.
So far, AMD has very good synergistic relationship with TSM, who's the best in the industry in manufacturing.
AMD would be facing lots of challenges ahead, such as companies like Apple and Amazon bringing chip design in-house, Intel is extending its dominance in the industry. Dr. Su shared that specialisation of chips is inevitable but AMD is prepared to focus in high performance computing sector and is in the process of acquiring Xilinx. She believed that by having good strategy, working closely with customers to resolve their problems and strong execution, AMD would continue to grow strong.
Looking ahead for the semiconductor industry, Dr. Su shared that Moore's law (doubling transistors in microchips every 2 years) is changing rapidly. Chips are unlikely to get smaller due to physical limitation. Instead, AMD is pioneering a concept of chiplets, where the chips are broken into little chips that can be packaged together or put on top of each other to bring more capability to take technology to the next level.
It is reassuring that AMD has a CEO that understands the industry, and has the experience and vision to further expand the company. Semiconductor industry is very competitive but the demand is much higher than before. Looking forward to a good run on this mega cycle.
From price movement wise, AMD has broken $80 last Friday. If uptrend continues, next target is $83, then $90. Nearest support at $73.50.

LONG Gap fill ideaCRUS along with many other semiconductor companies has been in a slump from the highs over the past couple months. As we see other semiconductor stocks such as AMD, TSM rebounding with the money that is rotating back into the tech space, we should see CRUS make a strong move to follow the sector.
TECHNICAL Analysis: The main things I see are RSI Creeping back up over 50 on the daily timeframe coupled with a squeeze momentum shift to the upside as the Bollinger bands move back outside the Keltner channels Volume profile tells us that this is a historic area of volume and it will likely hold unless some bad news hits the market or semiconductors.
FUNDAMENTAL Analysis: With companies like NVDA reporting blowout earnings I think it is plausible that many other semiconductor companies are raking in the cash right now as prices for semiconductors have skyrocketed across the board. This type of environment is a great opportunity for semiconductor companies to jack up prices and they know that whatever they produce will likely be purchased very fast. The one common discrepancy across most businesses right now is the labor shortage, If the labor shortage and price of labor increasing continues, CRUS may be unable to hire enough work to meet demand, this could significantly cut into their profits.
BIDEN Infrastructure plan: CRUS may be a candidate to receive money to start producing fabricators in the US should they want to do so. If they receive money from the government to do so this could mean a major jump in stock price, however it is unlikely.

$INTC Update - Reversing NicelyINTC showing a strong bullish reversal back to fill the gap near $62, which is my first target. Letting this one ride out

SMH is getting ready for a rallyFor me both tech QQQ and Semiconductors SMH are forming bottom. Any dip would be a good buying opportunity in my opinion.

$NVDA Earnings Anticipation Nvidia cruising towards the top of its trading range as the company reports earnings this Wednesday May 26th, the report could definitely allow a breakout to happen near $700 if expectations and future projections are strong. High demand for graphics cards within not only the crypto community, but gaming community as well. Nearly impossible to get your hands on a 30 series card near MSRP these days. Watching closely.
TSM Opportunity along with Semiconductors.$TSM: Currently in a falling wedge pattern, demand zone at 103-109 has been key support for this name. Break above 114 with good volume/momentum will see this one move into the upper Fib extensions in the supply zone. Targets around 120-124 within the next 1-2 weeks. We are bullish on Semiconductors tactically with this inflationary climate. Setup is invalidated if it breaks/consolidates below 107.

5/20/2021 AMDAMD undercut important lows and reversed back into its range. Tech & Semiconductors have been weak and beaten down for a while, so a short term bounce is not out of the question.
In @ $77.00
Stop @ $72.10
2:1 Target at $86.90
