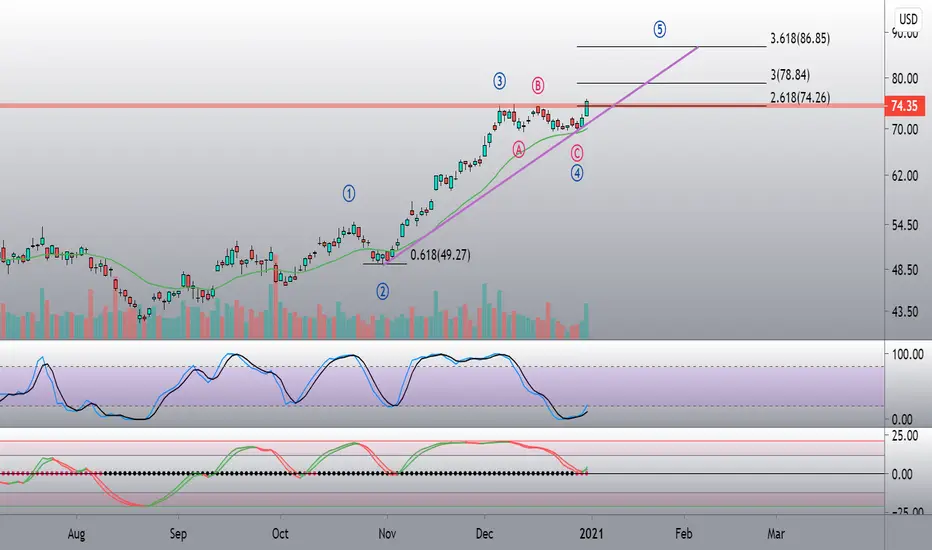
Bullish On Semi's? Go Long $SIMO.I'm bullish on semi-conductor stocks. Especially small & mid-cap names. Check out Silicon Motion Technology. I like the set up here.
P/E = 17.73
EPS Growth = 483%
Nice entry point IMO.
New to charting. Let me know what you think?
Thanks.
Semiconductors


TSM over 127.58After a nice climb TSM has pulled back and looks to be breaking from this descending channel. Entry over recent high shown here will confirm a breakout.

Update on AMD. Load the boat!Load up, you won't see this stock below $90 often in the future.
The MACD is signaling buy. When the red signal line rises above the MACD line, it's a buy signal.
The RSI is signaling buy. As highlighted, an RSI around 30 signals it is not overbought.
It held the previous support level of 87.52. This is a tremendous sign.
I expect it to carry on in the channel I have created with trend lines. It won't be a straight line up, but it is going up.

Semiconductor sector (SOXX) seem ready to turn its trendSemiconductor sector seems ready for a trend change. Since the March low, the sector has ran up more than triple digit percentage. As much as the sector is damaged less than retail and hospitality, it is very cyclical sector and it does get affected by business cycle. Semi is the canary in a coal mine of the tech sector (XLK), so when this turns, it will be a headwind for the entire tech sector as a whole. When the tech breaks, the market breaks for its heavy weight on the indexes.
Recently broke the minor yellow up trend line and reversing right at the long term trend line since last spring.
Initial target is the bottom of the trading range. $404ish depending on when it hits it.
2nd target is the horizontal support right below the channel. $384.46
As how bullish the overall sentiment is in the market recently, once it turns, it will be pretty quick move downward. Potential long term targets are listed but SOXX will not going to fall double digit without if XLK and indexes are resilient.
Only the time will tell but it will be prudent and be cautious. Scaling down on aggressiveness won't be a bad idea and have some hedges.
Have a good trade everyone,
T.

AMD has underperformed peers but not for much longerAMD seems to be the contrarian play in the semiconductor field right now so I'm going to go ahead and suggest starting a position at these levels around $90 a share. It has been outperformed by its peers to a great degree recently for no apparent reason. I assume profit-taking attributed to taking it down from nearly $100 a share.
Buy under $93.
Sell half at $110.
It will retest the $100 level, breakthrough, and hit resistance at about the $110 level from profit takers. Slight chance it has more legs than that but I'd say $110 is a fair price target for this stock.
The SMH is up 11% in the last month and a half and AMD is down nearly a percent. Easy 10% return on this trade if not 20% if it hits my estimated price target.

$NVDA - Bull Setup PrebreakoutApproaching upper band of channel once more. May break this time, may not - here's my targets if it does.
Target 1 - $545
Target 2 - $552
Target 3 - $563
Invalidates bull bias under $528.50
Like & follow if you want more of these :)

$INTC obvious bull trap???I have my doubts on long $INTC given the 2020 performances, but with the recent leadership change, I'm a bit more optimistic. Chart showing really interesting trend. I guess i'll cover my short call tomorrow morning...

A new SPAC, great potential, risk vs rewardAll SPAC IPO's have seen great gains before they even merge. This one is a company that was founded in 2004 in silicon valley. It supplies field programmable gate arrays, the electronic components used to build reconfigurable digital circuits for use in 5G equipments and cloud computing. Among its competitors are Intel Corp. and Xilinx Inc.
It is a great play and the consolidation is almost over as you can see the declining volume. You may enter with a small position and keep an eye on it. There is no guarantee will touch support but if it does you can increase your position there. The upside if patient will pay off.
I am not a financial adviser and this is not an advise to buy.
Disclosure: The writer has a position open in the company.

Trouble Ahead for AMD?As we can see, an ascending wedge pattern has clearly formed on the AMD 1 YR chart. This means we could be in for some bearish movement going forward.
After having traded in a tight range between $89-$99 for over a month now and constantly getting rejected at the $99 level, it is hard to say we might breakout over $100 after the next earnings report which is to be released on the 26th of this month.
Fundamentally, the company could give out some great news and a stellar earnings report, but I would ask for you to trade this cautiously considering the technical analysis shows otherwise.
That being said, if you are bullish;
BTO Feb 5th $97 Call ($6.13) (Do not hold into earnings, I say this with experience, unless you want to gamble)
But if you're bearish;
BTO Feb 5th $90 Put ($3.7)
Good luck trading!

INTC looks readyINTC could be setting up for a big move.
The dip below the 50 mark was eaten up fast. Usually INTC is not a fast mover, also closed above the 200 ema today.
Watching for a break and hold of 52.76 to go long.
PT1 54.67
PT2 56.23
PT3 58.70
PT4 gap fill over 61

ATOM Sign Joint Development AgreementAtomera and Market Leading Semiconductor Company Sign Joint Development Agreement for Use of MST in Future Devices.
entered into JDA with a leading semiconductor provider for integration of Atomera's Mears Silicon Technology (MST) into their silicon fabrication process.
Atomera's MST is a patented, quantum-engineered material that enhances transistors to deliver significantly better performance in today's electronics.
New collaboration will leverage Atomera's transistor enhancement technology to develop improvements across the manufacturer's production lines
finance.yahoo.com

SiTime makes the digital world go roundIf you have ever done an electronics project, you probably either built your own large timing circuit or utilized a quartz-based crystal oscillator in a square silver package with four legs. An oscillator is used in some form in most every electronic device you use.
Think of the computer in front of you. It likely has a dozen or more oscillators integrated into the core processor, memory, wireless radio, LCD screen, trackpad or mouse, and all the components that coordinate between these parts. Each needs an accurate way to generate frequencies and measure time.
Beyond the computer are devices as simple as a stylus for a tablet computer, the tiny wireless earbuds for music, a smart watch and programmable lightbulbs. And there are devices as complicated as new all-electric autonomous-driving cars, airplanes, satellites and rockets. All of these devices are requiring smaller and smaller components.
And that's the whole game with the semiconductor industry. Smaller. Faster. Cheaper. And with timing solutions it's also about More Accurate. Timing solutions are tricky, because they have always been very sensitive to vibration, temperature, and other jitters that cause inaccuracy. Quartz has been able to handle most of these applications up to a point, but its running into several limitations:
1) Quartz is sensitive to extreme temperature and vibration
2) It requires a ceramic container that increases its size
3) They are built for a specific purpose and lack programmability for new uses
MEMS Timing Solutions
That's where MEMS timing solutions come into play. MEMS stands for MicroElectroMechanical System. A MEMS solution is anything that combines mechanical moving parts with electronic signals in a very small device. MEMS circuits that you see every day include displays, tiny microphones (in your phone), accelerometers.
MEMS timing solutions have been in research and development since the 1960s, but the first commercialized product was sold by SiTime in 2006. Since then, SiTime has been 'chip'ping away at quartz oscillator solutions to gain market share. But recently, there has been increasing demand for MEMS solutions. Here's just a few:
1) Smaller and smaller devices
2) Devices used at extreme temperatures
3) Industrial devices that endure high vibration
4) High frequency radios required for 5G
5) Low latency for things like natural stylus writing
SiTime
1) First Commercialized MEMS Oscillator in 2006
2) Competitive strengths in Performance, Size, Low Power, Programmable, Quality/Reliability, Rapid TTM
3) Market Cap: $1.9 billion
4) Shares in Float: 5.4m (of 16.9m)
5) 143 Employees at end of 2019
6) 59 patents for MEMS manufacturing and design
7) EPS last three quarters: -0.14, -0.14, +0.23
8) YoY Sales last three quarters: 47%, 36%, 29%
Technical
1) Up 590% since IPO in November, 2019
2) 5.5% down from all-time high on December 17
3) Deep cup and handle formation from early November
ATR Buy Point
Buy Point: 114.56 (last daily high + 10)
Stop Loss: 97.58 (14.82% based on 10d ATR x2.7)
Position Size: R6.75

MU Wave 5Micron Technology Inc. (MU) broke out of wave 4 consolidation. Bullish engulfing candle with an association of high relative volume is key signal this a true breakout. Indicator confirm breakout with cross in StochRSI, TMO, and daily squeeze breaking out. Prior to breakout, Micron held the 21 ema with a hammer candle. Earnings at 1/7/21, so look for run up and momentum continuation.
potential breakout off an earnings baseNASDAQ:IPHI Solid fundamentals with a very constructive base forming. It recently made a small move up while finding support. The ATR is showing a vey tight trading range with well below average volume and good relative strength. I will be looking for a break out entry through 162.20 area against the 157 area.

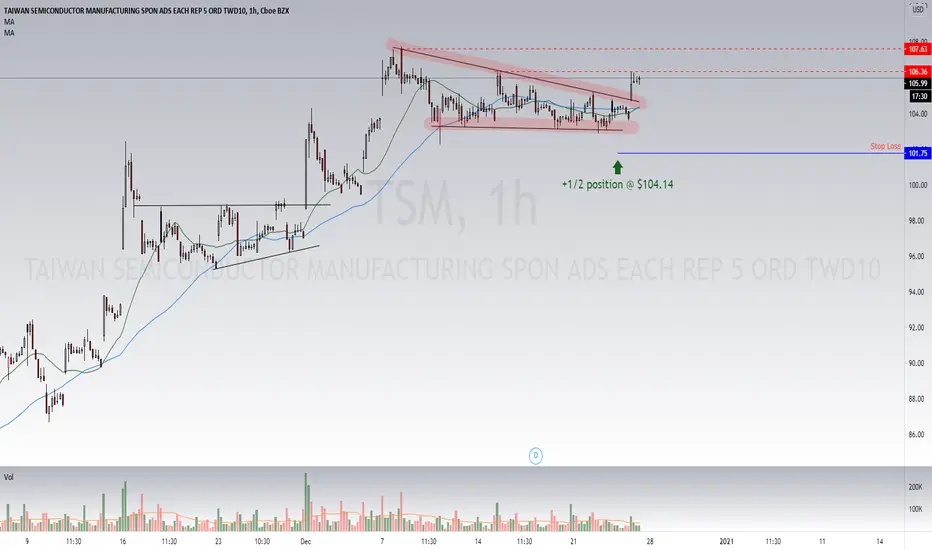
TSM Long 12/23/2020TSM is a leading chip maker for some of the largest tech companies on the planet, including Apple, Sony, Huawei, Qualcomm, and others.
It is pushing new all time highs & I bought in anticipation of a breakout to those new highs. I got long half of a position @ $104.14 with a stop @ $101.75. I didn't feel comfortable putting on a full sized position going into year-end, but if the trade continues to work for me, I am looking to add. With an initial stop loss of ~2.3%, I am looking for at least a 5% move from my initial entry price, which is roughly the $109.50 level.
Copper Outlook /long-term Technical Analysis
We have broken the long-term resistance trend that had been in place for almost 10 years.
RSI is very overbought, but this market has proven overbought can stay overbought for a long period.
In the chart there is 3 potential targets for Copper in the long-term picture.
There are several place to take profits and/or add on pullbacks. (These are the orange segment lines)
Fundamental Analysis
Industrial metals have been rallying strong; and are likely to continue with expected infrastructure investment for 2021 and further.
Copper is also used in Semiconductors, which is the basis of all technology hardware.
Steel is behaving in a very similar fashion, adding to the idea of industrial metals outperforming precious metals.

$NVDA with the same pattern as $TSLA. VC by MinerviniIf you missed the $TSLA VCP, here's one more $NVDA.
Same pattern as $TSLA before the big breakout with higher lows and supply dry up indicating that most of the selling is done.
Volatility contraction Pattern by @markminervini 📈

Taiwan Semiconductor Manufacturing. A Must Have for 2021.TSM has continued its bullish uptrend since March following the rest of the stocks in its sector. In the past month, it has swerved past the $90 resistance that has been holding it down and continued an even steeper uptrend. The uptrend channel looks strong and has only shown weakness back in July. Surrounding the stimulus news and the fact that it has been a major player in helping Apple produce its own chips is what is moving this stock upwards.
TSM has room for upside in my opinion but taking a long position right now might not be sustainable. The Fibonacci retracements show the closest support level is between $89-$93.
Given the current market conditions along with vaccine news and stimulus, I would wait and see if the current uptrend holds.
A drop to $89-$93 is what I am looking forward to in order to take a long position and set a stop loss limit at $80.
My PT for 2021 is $130.

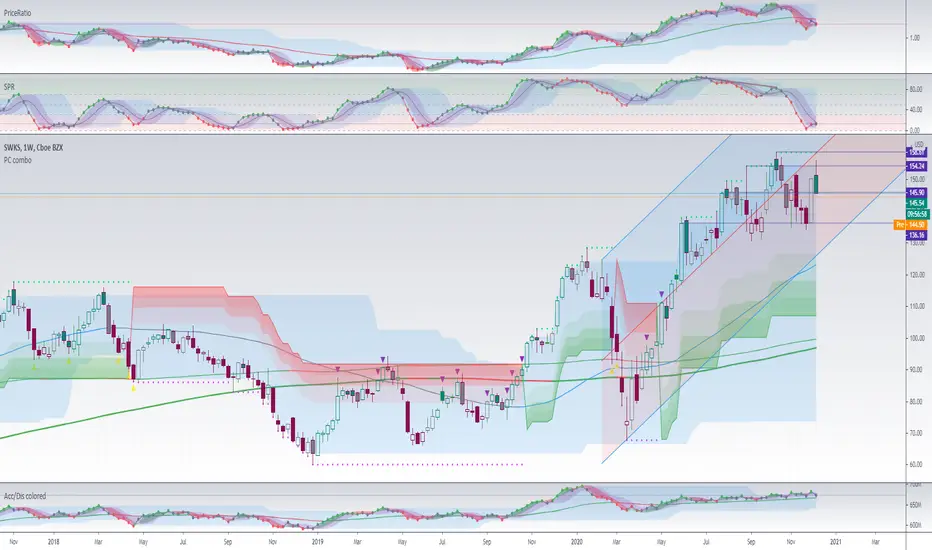
Skyworks makes higher lows during its consolidation.higher lows during a consolidation after a big rally is a sign of a healthy bull!
I am buying the dip!
AMD - option trade of the week by Argusbuy-to-open calls strike at 100 expired Jan 15,2021.
quote from Argus: "Over the past month, the AMD shares have rallied back to the top of the four-month price range near $94. A strong breakout above the top of the range could lead to a significant rally well above $100 based on the size of the sideways consolidation."
