Skyworks: Momentum Chip Stock Pulls Back to Old HighSkyworks Solutions has been flying on strong demand for smart phones and hopes of a big 5G buildout. Now it's pulled back to a level where traders might want to take a look.
SWKS broke out to new record highs in December, above the $115 zone where it peaked in November 2017 and March 2018. As often happens, it was a case of "buy the rumor and sell the news." Earnings last Thursday were good, as expected, and traders responded by taking profits.
Several analysts raised their price targets, including Raymond James, Needham, Canaccord Genuity, Citi and Craig-Hallum.
SWKS continued its slide Monday as coronavirus fears dragged on the broader market. But now that the stock is trying to stabilize at the old resistance zone, some momentum players might get interested. It's also making a slightly higher low than its earlier pivot on January 6. Traders may want to use that same area for risk management.
SWKS could also move on Apple's earnings report this afternoon because it's an iPhone supplier.
Semiconductors

$ENPH Enhase Energy - Semiconductor Strength (First Stock Idea)$ENPH continues to be on a tear in recent trading sessions, helped both by technical and macro factors.
On the macro front, the headline risk of a trade war has finally receded as the US and China signed their trade deal in January 2020. This has helped to roll back some dark clouds as it relates to global trade flows, especially for geopolitically sensitive products such as semiconductors.
On the technical front, both the RSI and price level for $ENPH continue to be moving higher, within the Rising Channel, which bodes well for this stock. The final "Cherry on Top" from a technical perspective, is the fact that prices appear to have broke higher out of a "Bear Flag" pattern, which is a good sign that prices have more room to run.
If these factors hold, we could see prices reach $35.11 ("Orange Weekly resistance Line") in the next coming days and weeks. However, if these bullish factors run out of steam, traders should be prepared to see prices fall back down to $27.70 level.

MU strong stock trend in stronger On a yearly performance, MU did better than 77% of other electronic components stocks. Now it is currently trading near its 52 weeks high so it is performing in line with the broader markets.
On a mid-term based daily chart, we could see a strong wedge uptrend pattern with momentum, and a few minor pullbacks occurred due to some broader geopolitical impacts such as the trade war and global 5G development uncertainty. But the stock is kept showing higher lows signaling the investors' passion for it.
MU is about to consolidate at the 56.8 support level which is lying underneath the price as the chart indicated above. Since the ATR volatility risk has not packed in too much yet at the current high, DMI overall trend indicator is still heading up and bull-side trend strength is still controlling the directional momentum, I would go long with it. My target is simply at the prior all-time high resistant area which is indicated by the red band above the stock price roughly at 60, any pullbacks that break below its bollinger bands middle band could be seen as a stop-loss trigger.
Besides, on the order flow side, there were over 2.9 million valued long calls detected from the options chain today with a strike at 60, expire in March.

AMD "in lisa su we trust" lolSemiconductors rallied after news the U.S. will remove currency manipulator tag from China. Trade tension between the U.S. and China has been easing which likely to give another boost in the chips industry. Among those 137 stocks, AMD outperforms 97% of them. Currently, it is trading near its 52 weeks high and however S&P is also trading near new highs, which makes AMD's performance in line with the market.
AMD is currently showing a bull flag pattern. There was a flag pole right left to its first bar as the chart shown, after a consolidation AMD appears to have broken out from the first bull flag pattern. And now it seems has been shaping another bull flag pattern with a consolidation range which is indicated above(support roughly at 47.6 and resistance roughly at 49.1).
The outside range indicated by red lines were the expected move that options market priced in for this week, means we are supposed to be inside of this range with 3.05 higher or 3.05 lower of AMD and it should stay in this range about 68% probability of the time for this week.
ATR indicator is about to trend downside means the risk of the stock starts to be compressed and consolidation may need. So I think the stock will come back to test the upper edge which is the breakout area roughly at 49.1with a few sessions moving forward then once the momentum been fueled it will break out to show another bullish trending to upside.
Besides, the overall trend indicator DMI is heading upward as the long trend strength(blue line) is still dominating the directional momentum. And today there were 174.42K, 186.93K, 136.71K with strikes of 49.5, 48, 55 long calls bets set on Jan, Feb 14th and Mar respectively which also is signaling the quite bullish view from the investors.
So I will consider buying a pullback until the price edging close to the lower edge of the orange line as a second entry and target a 55 stop gain for this setup.

QRVO - Bullish SetupQorvo gapped up on an earnings announcement & has held the level. The RSI seems to be bouncing off the 50 level as the slow stochastic exits an oversold condition. The recent low candle had a higher than average volume accompanying it which I noted on the chart. Good relative strength in this name too. This is a tech company within the semiconductor industry, which never hurts in this market.

Amd Bounce coming upI know a lot of you guys are probably confused why AMD played you for a fool this morning with the pop and drop.
But with two new products out and all these hype, it may as well just be a opportunity to double down instead lol.
Small Entry $47.50 area,
may add more at 47.10
Stoploss 46.75
Exit 48.50

AMD trend line breakAMD has just made a bullish trend line break. It hasn't surged across with strong volume, so I suspect we'll see a bit of a pullback before it moves higher. However, AMD should be bullish for the near term.

MRVL - Reverse H&S - MacD good - RSI great - easy trade or longHello! - This is a textbook chart for the bulls.
1) Notice the perfect reverse head and shoulders forming in order to test the 28$ highs in the coming month.
2) Notice the MACD signaling a strong buy with the RSI signaling there is more room to run until overbought. - Good volume too.
3) Notice the overall trend in both MRVL and the SnP 500 - there are similar moves only exemplified with the market.
4) semiconductor stock post china phase 1 trade deal and pre 5G phones has major tailwinds and in my opinion - these tailwinds will push mrvl above the $28 price resistance in the next couple months (by March 2020) and once we close above 28 for a couple of trading sessions - we are off to the races.
--I am long mrvl and I expect this stock to double (only 18b market cap now) by the end of 2021

Intel bulls are betting on a breakoutIntel options interest is highly bullish today as call-buyers bet on a last-minute trade deal ahead of the December 15 deadline for new China tariffs to go into effect. Intel is definitely one of the safer bets in the semiconductor space, with a 9.5/10 analyst summary score and an attractive P/E of just 13. The stock's valuation is rated 95/100, or extremely undervalued, by S&P Global Intelligence. Intel pays a dividend of over 2% and may be a good buy-and-hold stock for 2020.

Key Chip Stock Has Pulled Back After Monster QuarterChip stocks are the best performing major industry group so far this year, and Applied Materials has been one of the strongest in the index. The provider of semiconductor equipment has scored double beats (earnings and revenue) all four quarters of 2020. AMAT spiked to a new record high above $63 after its last report in mid-November, followed by a pullback into the mid-50s.
Buyers have returned to defend its previous consolidation zone between $55 and $56.50. Now the stock is pushing higher along with the Philadelphia Semiconductor Index and challenging another key zone: AMAT’s November 25 and 26 high of $58.42. Momentum buyers may look to add if the stock clears this level.
Finally, a fundamental note on semiconductors in general: While orders slowed for most of 2019, data from the Semiconductor Industry Association showed them turning positive again in September and October. Furthermore, economic growth estimates have ratcheted up lately – especially after last week’s non-farm payrolls report. That typically favors chips because they’re cyclical.
On top of that, 5G networking is expected to drive growth for several years into the future.


Semiconductors look poised to move toward new highsOn today's trade optimism and extremely positive jobs data, the SOXX semiconductor fund moved up through a trend line and looks to be ending its day right atop a volume support node. This should bode well next week, although with the SPY at a resistance level, we will need the news to stay good over the weekend in order to move higher Monday.

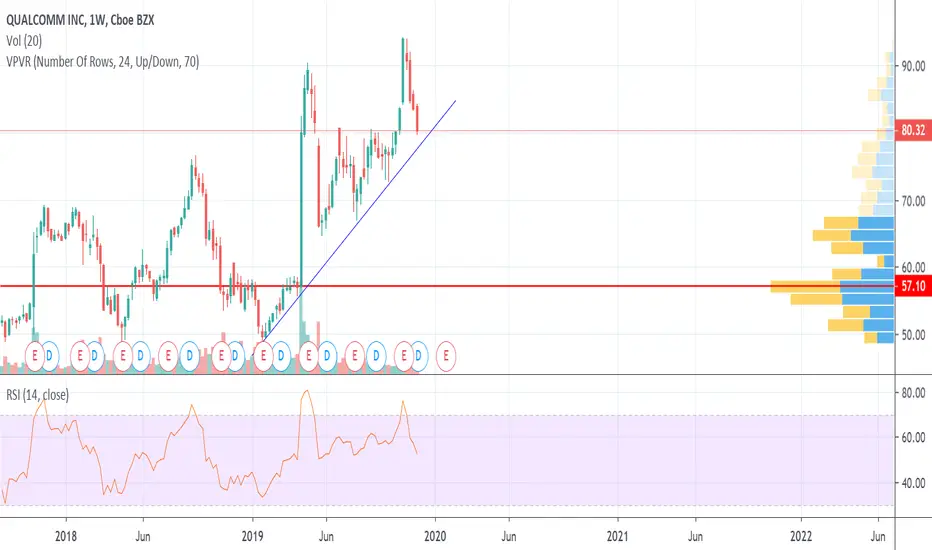
QCOM entry 79After a stellar earnings report a week or two ago, I am extending my Qualcomm trend line and looking to buy the dip to the trend line around $79 per share tomorrow.
A scaled entry plan for SOXLOne of the best long-term performers in the stock market is the semiconductor sector. With a strong likelihood that AI will change the world in the next 10-20 years and disrupt every other industry, there are big profits to be made in semiconductor companies that are heavily invested in AI research and provide the processors to power it.
That said, the current price point on SOXL is pretty high, so it makes sense to look for a lower entry. With the market (and especially the Nasdaq) turning downward this week on China trade war news, I've developed a scaled entry plan for SOXL. There are four entry points: the recent highs around 198, the high-volume node at 159, and the recent lows near 131 and 90. Normally I triple my position at each level, but I doubt we'll hit the bottom two targets on the current trade war news, so I'm weighting my entries a little more toward the two upper ones. I already made my first entry this morning near 198.

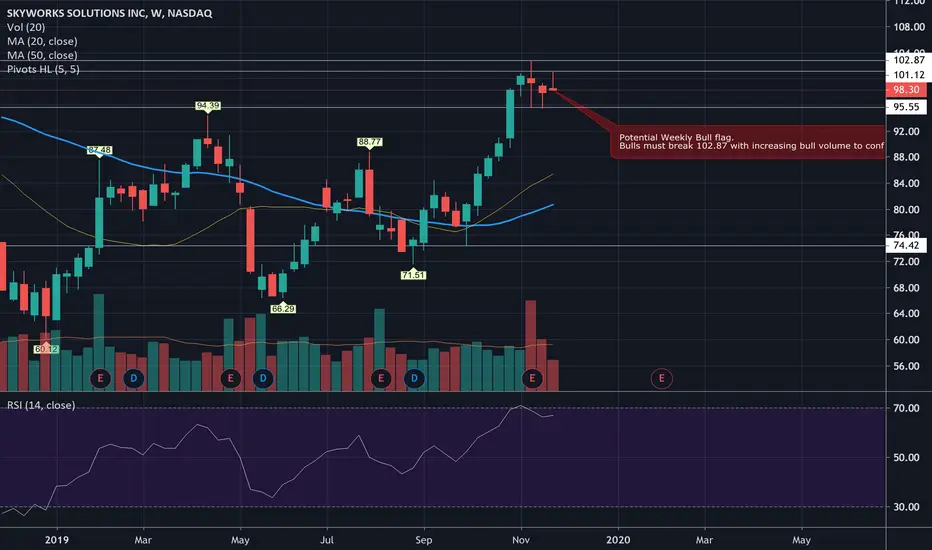
SWKS Weekly Bull Flag WatchSWKS forming a weekly bull flag.
Bulls must break 102.87 with increasing bull volume this coming week to give confidence that we are going up.
Daily time frame is a clear equilibrium pattern. I expect low trading volume until a break.
If we do not break bullish, expect daily consolidation and a weekly higher low to form.
I would also watch for correlation with QQQ and SPY. We all know the market has been very bullish for the past weeks. If we get any pullbacks in the market, I expect the bears to take over for SWKS.
XLNX BearishXLNX Look for it to continue following the channel down. Look for it to gap up again and then probably follow the same channel down. Might be a base build long term but I would keep short term positions bearish.

Semiconductors bounced downward from top of parallel channelSOXX has been making two parallel channels, and the other day it bounced off the top of the blue one. It's still within the green channel, however, so it's approaching a decision point soon where it will have to choose one or the other. If the fall continues, there could be a good buying opportunity near the bottom of the green channel and an even better buying opportunity near the bottom of the blue one. SOXX and its leveraged counterpart SOXL are my favorite trading instruments, so you best believe I'm going to be watching this closely.

Semiconductor and Industrial 4.0Most people don't understand don't get it when it comes to market.
Because they think that by just looking at charts, that is more than enough to beat the market.
Remember, market are moved by whales and smart money.
Whales and smart money have COMPREHENSIVE PLAN on the market.
They are not obsessed or focused on SHORT TERM and INTRADAY moves. That's why seconds chart on trading view is a joke.
Whales and Smart Money knows about the presence of Industrial Revolution 4.0
If you are not aware, these books should already be on your reading list:
www.amazon.com
www.amazon.com
Remember, Schawb wrote this book in 2016 and then the next one in 2018, if you read the book in 2016 and you know that blockchain will be the next big thing, you are already know that Bitcoin and Crypto will be huge back then.
Also, most semiconductor stocks gave massive gain in 2017, all due to I.R 4.0
Here are the list of 4.0 theme:
1. Blockchain and Distributed Ledger Technologies
2. The Internet of Things
3. Artificial Intelligence and Robotics
4. Advanced Materials
5. Additive Manufacturing and Multidimensional Printing
6. Biotechnologies
7 Neurotechnologies
8 Virtual and Augmented Realities
9. Energy Capture, Storage and Transmission
10. Geoengineering
11. Space Technologies
Semiconductors play roles in blockchain, iot, ai, robotics and manufacturing. So, considering all of these multiple catalyst, shouldn't the semis go higher?
Anyone who just bought the dip from 2013 has been making a lot of money while those people who try to long and short and time the market are net loser.
This trend will continue until we reach peak expectations and when they are euphoria amongst the retailers and businesses, then that's the peak.
As long as everyone keeps calling for market to crash, then, market will grind higher in a wall of worry.
That's how market works. Deal with it.
Industrial 4.0 will overcome all the economic issues and economic policies. The catalyst is big enough that it will keep climbing and grinding higher.

XLNX - Another Semi Looking To Hit The RoadPrice has been within a bearish channel since the end of April. The primary trendlines are the solid purple lines but there is an intermediate bullish pattern forming which is illustrated by the dashed purple line which is creating a bullish falling wedge pattern. Look for the breakout around $95 on the falling wedge then we would wait for confirmation on the retest of the previous resistance line.
Based on the Fibonacci Extensions I would target $102.79 & $106.89. These are the 38.2% & 50% extension levels along with previous support/resistance zones.

Elmos : the next giant in the semi conductor industryHello there,
This chart is heavily based on fundamentals and we will talk about it:
Elmos is about to go big. I mean really big and this is related to the automobile market. As the automobile market evolves, so does its functions and use cases to. Electrical/ Hybrid cars are a thing now, and there's no doubt that the semi conductor market is going to explode, just because of supply/demand.
While I was working on an application, I stumbled upon an Elmos product. Prior to this I never heard of it. They created a chip that is incredibly intelligent and works very well with drivers, allowing you complex functions that you usually need other components to do such as : PWM, PWM shifting, timeout mode, output gains, amplifiers, reductors, derating, and 16-32 outputs : ALL IN one component.
This is revolutionary, and its going to be massively used in vehicles, airplanes, trains.
It's already picking as we can see on the chart. I expect a dump towards 16-19$, this will be my buy area
Best regards

Pay attention.. $SPY $SOXX #TRADINGIDEASFour times was rejected at the same area, and volumen has been drying when it wants to resumen the uptrend, i don’t have a position but in a macro view and don’t like this type of action.

Possible post-earnings bounce levels for Taiwan SemiconductorsWith industry-leading technology and low exposure to China tariffs, Taiwan Semiconductor is poised to thrive in the trade war era. The stock soared to overbought levels ahead of earnings, then blew away analyst estimates on its earnings report. However, the stock has been dropping after earnings because the price had gotten too high, too fast. Its current P/E of about 24 is about average for the semiconductor sector, but it's well above TSM's five-year average of 16. TSM is bound to bounce at some point and resume its uptrend; the question is when.
If this were any other other sector, I'd expect to plummet right through our first support level. However, semiconductors have absolutely defied gravity lately, so it's fully possible that the first support will give us our bounce. Here's one possible scenario, in which we get a mini-bounce from the first support and then a stronger bounce from the first trend line:
Here's another likely scenario in which we fall to the second trend line and bounce from there:
Even if we do break the second trend line, we've got a nice, strong volume node right underneath it at 44.17 to act as a secondary support. Best case scenario for buyers is that we head all the way down to about 42, where another strong volume node is located.
My strategy for playing this is to buy at the first trend line, with a stop loss right beneath it in case the stock breaks down further. If it does, then re-enter at the second trend line and just hold, with no stop loss. If it falls further to 42, triple the size of my position. As always, this is just an idea as to how the market will move and is not intended as investment advice. Happy trading!

SOXL trend lines to watchSemiconductors have been in a fairly strong uptrend and broke above their parallel channel yesterday, and they could cycle up again later today. However, watch out for the possibility of a breach of the lower trend line, especially if Taiwan Semiconductors earnings are bad tomorrow.
