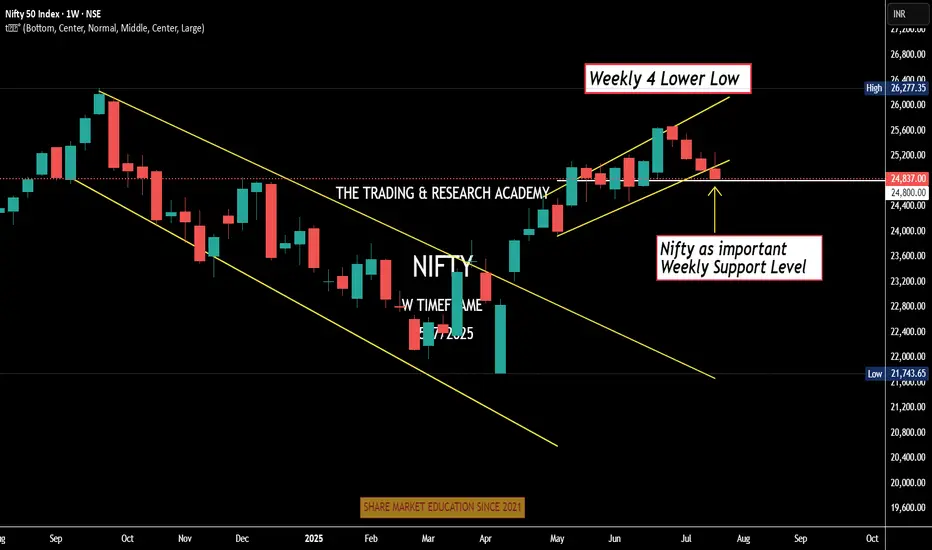
Weekly Nifty Analysis Next week, can we have a small bounce in #Nifty?
4 Lower Low
Daily channel Breakdown
Index at crucial weekly support level
Can one bullish week / Doji be expected. One news here or there & boom!
We have monthly expiry this week, let's see.
Sensexanalysis
Trap Set at the Top? Sensex Sell-Side Objective = 81,886Sensex is currently trading at 82,220 and showing early signs of a potential sell-side move based on Smart Money dynamics. After grabbing buy-side liquidity above recent highs, we’ve now entered a distribution phase.
Price has shown rejection from a premium zone, and a market structure shift is forming on lower timeframes — all pointing toward a probable move to the sell-side liquidity pool near 81,886.
This zone aligns with Smart Money's objective to tap resting liquidity below recent swing lows before any major reversal. Caution is advised for longs. Wait for confirmation if you're planning to ride the short move with the institutions. 🎯💼

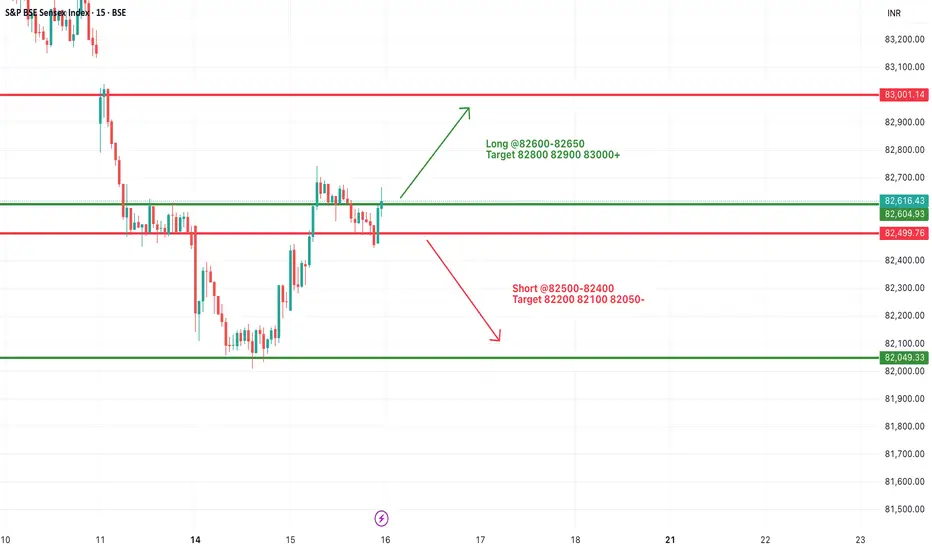
#SENSEX Intraday Support and Resistance Levels - 16/07/2025Sensex is expected to open flat near the crucial 82600–82650 resistance zone, which has acted as a turning point multiple times recently. A sustained move above this range may trigger bullish momentum toward 82800, 82900, and even 83000+. This move would indicate a positive continuation after the recovery seen from recent lows.
However, if the index faces rejection around 82600–82650, it may once again slip below 82500, opening the door for short-side opportunities with targets at 82200, 82100, and 82050. This region has seen a lot of price action over the last few sessions, so volatility may be higher.
#SENSEX Intraday Support and Resistance Levels - 15/07/2025Sensex is likely to kick off the session with a gap-up opening around the 82500 level, reflecting early bullish momentum. If this initial strength holds and the index begins to build above the 82600–82650 zone, it could signal the start of a recovery leg toward higher resistance levels at 82800, 82900, and potentially 83000+. Sustained action above 82650 may encourage momentum traders to chase strength during the day.
However, the 82500–82650 range will act as a battleground. Failure to defend this zone could invite selling pressure. A breakdown below 82500 may expose the index to intraday weakness, opening downside targets at 82200, 82100, and even 82050. In this case, expect volatility to increase near support levels.
Traders should approach with a flexible strategy—watching for breakout confirmation above 82650 or signs of reversal pressure below 82500. Today’s early range could set the tone for the entire session.

#SENSEX Intraday Support and Resistance Levels - 14/07/2025Sensex is likely to open slightly gap-down, reflecting weakness carried over from the previous session. The index is currently trading near the 82450 zone. A breakdown below the 82400 level may trigger further downside movement, with potential support targets at 82200, 82100, and 82000. This zone should be monitored closely for continuation or reversal.
On the upside, any strong recovery above the 82600–82650 level could push the index higher, with resistance targets at 82800, 82900, and 83000+. Sustaining above this range may indicate buying interest returning in the market.
If Sensex spikes toward the 82950–83000 zone and faces resistance, a reversal from there could create shorting opportunities with targets at 82800, 82700, and 82600. However, a clear breakout above 83000 would negate this short setup and shift the bias to bullish.
The index is currently in a consolidation zone, and price action around 82600–82400 will be critical to determine the day’s direction.

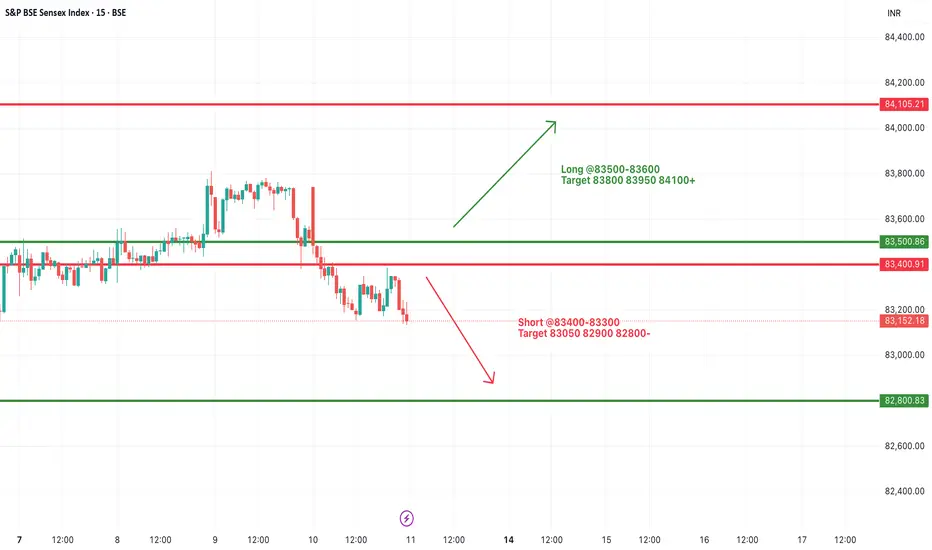
#SENSEX Intraday Support and Resistance Levels - 11/07/2025Sensex is expected to open flat after a consolidation phase and weak closing in the previous session. The index is currently hovering near the support zone of 83400–83300. If Sensex breaks and sustains below this level, further downside may unfold toward 83050, 82900, and 82800. This level should be watched closely as a decisive break may trigger increased selling pressure.
On the upside, a recovery and breakout above 83500–83600 could indicate a potential reversal. Sustaining above this zone can lead the index to rally toward 83800, 83950, and possibly 84100+. However, the price action near this resistance band will be crucial for any confirmation of bullish strength.
Overall, the sentiment remains weak with a bearish bias unless a strong breakout happens on the upside. Traders should remain cautious and focus on these breakout levels for intraday opportunities with proper risk management.
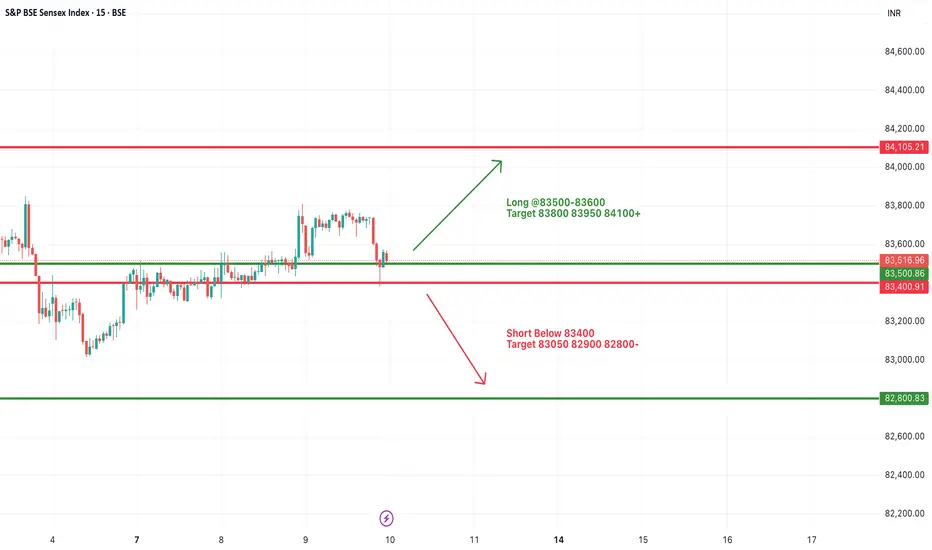
#SENSEX Intraday Support and Resistance Levels - 10/07/2025Sensex is expected to open flat today, continuing the consolidation observed in the past few sessions. The price action remains range-bound with key support near 83400 and resistance around 83600 levels.
Currently, Sensex is hovering near its critical range with buyers and sellers struggling for control. A breakout above the 83500–83600 zone may trigger fresh bullish momentum with targets at 83800, 83950, and 84100+. Sustained movement above 84100 could signal a stronger trend reversal.
On the downside, a breakdown below the 83400 level could lead to weakness, with immediate targets at 83050, 82900, and 82800-.
#SENSEX Intraday Support and Resistance Levels - 09/07/2025Sensex is expected to open slightly gap up near the 83500–83600 range, showing positive momentum as it breaks out from its recent consolidation zone. A sustained move above this level could trigger further upside, with immediate targets seen at 83800, 83950, and 84100+ levels. This zone will act as a crucial resistance-turned-support for the session.
However, if the index fails to hold above 83500 and slips below 83400, it may enter a corrective phase. A breakdown below 83400 could lead to a downward move toward 83050, 82900, and possibly 82800-. Overall, trend remains positive above 83600, and traders should watch for confirmation in the opening session.

#SENSEX Intraday Support and Resistance Levels - 08/07/2025Sensex is expected to open flat today around the 83400 zone, showing no major gap or volatility at the open. The index continues to move in a tight consolidation range between 83300 and 83500. A decisive move outside this zone is likely to give direction to the market.
If the index sustains above 83500, it could lead to a bullish breakout, pushing prices towards 83700, 83800, and eventually 83950+. This breakout may indicate fresh buying interest after a prolonged sideways phase.
However, if Sensex breaches the 83300 level on the downside, it could trigger selling pressure with targets at 83050, 82900, and 82800-. Traders are advised to wait for a clear breakout or breakdown before entering any trades, as the current zone lacks momentum.

NIFTY THIS WEEK? What's the plan
"There’s more hidden in a candle chart than most headlines will ever reveal.”
If you look at this NIFTY chart casually, you’ll see just another uptrend. But if you feel the price — really look into the structure — you’ll notice something deeper:
We’re not just in a rally. We’re in a breakout after base-building. And that’s a very different game.
What I Noticed This Week:
1. Strong Follow-Through
NIFTY didn’t just pop — it’s sustaining gains. Each green candle is following the next without hesitation. That means institutions are buying, not just retailers reacting.
2. Previous Resistance = Gone
Look back at 25,200–25,300. That zone rejected price multiple times. Now? It’s broken clean, with a bullish Marubozu-style candle. That’s a confirmation, not just a fluke.
3. No Panic Selling Yet
Usually, breakouts invite profit booking. This one? Sellers are quiet. When there's no rejection at new highs, it tells you confidence is strong.
But Here’s What You Must Watch:
Are we near psychological exhaustion? Markets can get euphoric and overextend - even in strong trends. Volume Spike or Divergence? If volumes dry or RSI starts diverging, stay alert.
Global cues & Bank Nifty:
If Bank Nifty stalls, NIFTY will slow too. Watch correlation.
What This Means for You:
Trend is strong, but smart traders plan exits in upmoves - not panic in downmoves.
Ask yourself:
Do you have entries based on structure?
Are you overexposed at highs, hoping for more?
Are you following momentum blindly or with plan?
Personal Reflection:
I’ve learned this the hard way:
“Buying strength is good. But riding strength without a stop loss is just greed in disguise.”
So this week:
Observe, don’t chase.
Track - don’t blindly enter.
There’s always another breakout. But there’s only one portfolio.

Sensex Intraday Analysis on May 12, 2025A bearish intraday trend is likely on May 12, 2025. The Sensex may find support at 79,067 (Support 1) and 78,250 (Support 2).
However, gap openings in either direction could invalidate this analysis. Traders are advised to rely on technical indicators before taking positions. Effective risk management remains essential.

Will NIFTY50 fall?Regarding NIFTY 50 Index
my expectation was that after a small growth, the g-wave from the diametric will be completed, then the price correction will start and the reason for it can be anything, definitely if the correction starts, the reason will be the war between India and Pakistan.
Normal:
The correction can continue up to the range of 23209-23456 and after spending the required time, start moving up. If this range is broken, the correction can end in the range of 22300-22700.
Pessimistic:
If the end of the wave-(D) is broken strongly, the upward movement that was formed from 21740 to 24593 will be considered as an X-wave and the wave-(D) will turn into a double pattern. Although the upward movement that formed from 21740 to 24593 does not have all the conditions of the X-wave, but when the market is not normal, we need to be a little flexible in our analysis.
What will be the second pattern of the double combination?
Usually, after the diametrics, the second pattern tends to be a neutral triangle or a contracting triangle or a reverse contracting triangle. But I will not comment on it now and wait for a few waves of the second pattern to form, then we can predict the pattern with more probability.
Good luck
NEoWave Chart

Nifty Probable Path for next 2 monthsNifty May spend some time till July August before beginning another 15% sell off.

Tata Consumer Products Ltd a bearish harmonic Gartley pattern Tata Consumer Products Ltd has formed a **bearish harmonic Gartley pattern, completing at point D near the 1.395 Fibonacci extension—typically a reversal zone. RSI is near overbought, suggesting caution. Based on this technical setup, the stock may face **selling pressure**, making it a sell recommendation with a target of ₹1,040 and a stop loss at ₹1,135. If the price breaks above ₹1,135 with strong volume, trend bias can shift bullish, but currently, it's best viewed with a short-term bearish outlook.
for educational purposes only

Sensex New LowAs per my anlaysis Sensex now low somewhere 71,000 ,its take maybe time but as per my view coming soon on day time frem ,its going to touch new low for this year 2025 , then after going upside .

Sensex Expiry Analysis – 7th January 2025
Sensex Expiry Analysis – 7th January 2025
Market Sentiment:
Overall Bias: Slightly bearish with range-bound possibilities unless a breakout/breakdown occurs.
Key Levels:
Resistance Levels: 78,000 (Immediate), 78,400 (Major).
Support Levels: 77,400 (Immediate), 77,200 (Critical).
Rationale for the Trade Setups:
Intraday Sell Setup:
A breakdown below 77,400 will trigger selling pressure, with targets at 77,200 and 77,000 due to high put writing and liquidity below.
Confidence Level: High, supported by FII/DII bearish positions and price action.
Intraday Buy Setup:
A breakout above 78,000 may trigger a gamma squeeze, with rapid movement toward 78,400 and 78,500 due to unwinding of call positions.
Confidence Level: Moderate, requires confirmation with volume.
Key Observations:
Option Chain Analysis:
Strong call writing at 78,000, making it a crucial resistance.
Heavy put writing at 77,400, indicating immediate support.
Implied Volatility (IV):
Slight increase (+2%), indicating expectations of higher volatility.
Gamma Squeeze Potential:
Above 78,000: Possible sharp upside move to 78,500.
Below 77,200: Potential downside acceleration to 77,000.
Execution Plan:
Buy Above 78,000: Wait for a 15-minute candle close above 78,000 with volume confirmation.
Sell Below 77,400: Enter on a clear breakdown below 77,400 with strong momentum.
Additional Notes:
Maintain tight stop-losses due to expiry-day volatility.
FIIs are net bearish in index futures; this reinforces the downside bias.
Range-bound expiry is possible if the index remains between 77,400-78,000.
Disclaimer:
The information provided is for educational and informational purposes only and should not be construed as financial or trading advice.Please consult with a certified financial advisor and use your discretion before making any trading decisions.

The Nifty Spot direction for the month of December 2024If you listen, you might forget. If you see, you will remember. Presenting the Nifty Spot Daily/End-of-Day Trend Forecast for December 2024. Pay close attention to the calculated turning dates and their directions, as these insights can guide traders in making informed decisions. Please note that price levels may vary, as the primary focus is on timing and trend direction.
In summary, December 2024 appears to be a bearish month for the Nifty. My Timing Analysis provides valuable insights to help traders closely assess market direction.
If you are a trader, do not trade without Stop-Loss.

2024 Nifty Advance forecast and Real Time comparisonBased on my mathematical calculations, I advised investors to exercise caution and refrain from making aggressive lump sum investments starting in July 2024. In mid-December 2023, I had forewarned clients about a potential market decline expected to occur anytime from July 2024 onwards. While there has been a delay in the anticipated correction, clients who heeded this advice stayed away from the market, preserving their capital—a testament to the principle that "a penny saved is a penny earned".

Sensex Analysis for Tomorrow 18/10/24Sensex Analysis for Tomorrow 18/10/24
Pls Use Brokers chart for live price updation in Sensex
Yellow Zone is major Resistance Level.
All The important are given with horizontal black line.

Sensex (SENSEX) AnalysisFollow and Boost the post, Thanks.
Based on the 1-hour chart for the S&P BSE Sensex Index, here is the summary and analysis:
Key Levels:
- Current Price: 73,885.60
- Retracement Levels:
- 0.5 Retracement: 75,537.72
- 0.618 Retracement: 75,947.52
- Targets:
- Target 1: 75,936.42
- Target 2: 77,260.70
- Target 3: 79,420.46
Chart Analysis:
1. Retracement Phase: The chart shows the Sensex Index in a retracement phase from a recent high, moving towards lower levels.
2. Support and Resistance Levels: The chart indicates potential support around the 0% retracement level at 73,801.25 and resistance levels at the key Fibonacci retracement levels.
3. Ascending Channel: The index appears to be trading within an ascending channel, indicating a general upward trend despite the current retracement.
Potential Scenarios:
1. Bullish Scenario:
- If the index finds support around the current level (73,801.25), it could start rebounding towards the upper targets.
- The first significant resistance to watch for is the 0.5 retracement level at 75,537.72, followed by the 0.618 retracement level at 75,947.52.
- Breaking above these levels could lead the index towards Target 1 (75,936.42), Target 2 (77,260.70), and eventually Target 3 (79,420.46).
2. Bearish Scenario:
- If the index fails to hold the support around 73,801.25, it might continue to fall towards the lower boundary of the ascending channel.
- Further decline could lead to testing the lower support level around 72,081.92.
Trading Strategy:
1. Watch for Support: Monitor the price action closely around the current level (73,801.25). Look for signs of a reversal or strong buying interest at this level.
2. Buy Position: Consider entering a long position if the index shows a strong bounce from the support level with increasing volume and bullish candlestick patterns.
3. Stop-Loss: Place a stop-loss slightly below the support level at 73,801.25 to manage risk in case of a further decline.
4. Target: Aim for the targets identified (75,936.42, 77,260.70, and 79,420.46) for the long position.
Conclusion:
- The S&P BSE Sensex Index is currently in a retracement phase within an overall ascending trend. The key support level to watch is around 73,801.25. If the index finds support and rebounds, it could move towards the identified targets. Conversely, a break below the support level could lead to further downside. Monitoring the price action and volume around these key levels will be crucial for making informed trading decisions.

SENSEXThe SENSEX has decisively surpassed a key resistance level, signaling a potential upward trend.

SENSEX and Bank Nifty Setups Friday 10 may 2024 SENSEX and Bank Nifty Setups Friday 10 may 2024 The trend in Indian markets are going in the downtrend but as of now Nifty especially Sensex near there rising channel higher low area values zone. seems Friday may 10th 2024 levels in Sensex and Nifty 50 would be challenging because Indian bricks is rising and if some cool of is going to happen in tomorrow's early 2 hours of training session of Friday then possibly a small nude short covering rally will be available in both of indices
Nifty Bank is much away from its rising train line at support or demand line
and the final area where smart buyers are pending orders placed are waiting to be getting executed the zone of 47000 46600
these are level to watch on Friday session

Sensex Intraday Setup for Friday 15 March,2024I have posted two charts: the First is to understand the Intraday, and the second is my short-term view. Today is the weekly closing and the day that decides the market trend for next week. 72,500 is the last hope for the Bulls and a very critical zone, so keep an eye on these levels. They can help you play for the maximum today or in the upcoming days.
Intraday Range: 72,900 to 73,400 ( A more comprehensive range and good for the Options sellers who love to sell Options
Long above 73,400 for the target of 73,700/73,900
Short Below: 72,900 for the target to 72,600/72,500
Trade Accordingly
